Abstract
An inexpensive, laboratory-based, strain gauge valve gape monitor (SGM) was developed to monitor the valve gape behavior of bivalve molluscs in response to diel-cycling hypoxia. A Wheatstone bridge was connected to strain gauges that were attached to the shells of oysters (Crassostrea virginica). The recorded signals allowed for the opening and closing of the bivalves to be recorded continuously over two-day periods of experimentally-induced diel-cycling hypoxia and diel-cycling changes in pH. Here, we describe a protocol for developing an inexpensive strain gauge monitor and describe, in an example laboratory experiment, how we used it to measure the valve gape behavior of Eastern oysters (C. virginica), in response to diel-cycling hypoxia and cyclical changes in pH. Valve gape was measured on oysters subjected to cyclical severe hypoxic (0.6 mg/L) dissolved oxygen conditions with and without cyclical changes in pH, cyclical mild hypoxic (1.7 mg/L) conditions and normoxic (7.3 mg/L) conditions. We demonstrate that when oysters encounter repeated diel cycles, they rapidly close their shells in response to severe hypoxia and close with a time lag to mild hypoxia. When normoxia is restored, they rapidly open again. Oysters did not respond to cyclical pH conditions superimposed on diel cycling severe hypoxia. At reduced oxygen conditions, more than one third of the oysters closed simultaneously. We demonstrate that oysters respond to diel-cycling hypoxia, which must be considered when assessing the behavior of bivalves to dissolved oxygen. The valve SGM can be used to assess responses of bivalve molluscs to changes in dissolved oxygen or contaminants. Sealing techniques to better seal the valve gape strain gauges from sea water need further improvement to increase the longevity of the sensors.
Keywords: Environmental Sciences, Issue 138, Valve gape, Crassostrea virginica, Eastern oyster, diel-cycling hypoxia, cyclical pH, bivalve behavior, bivalve gape, SGM
Introduction
Hypoxia, i.e., dissolved oxygen concentrations [DO] sufficiently low to negatively affect biological and ecological processes but often functionally defined as [DO] of < 2 mg/L1, and anoxia (functionally defined as [DO] of 0.0-0.2 mg/L) are occurring more frequently and severely in the world's coastal waters, estuaries and the deep ocean2,3 and are often exacerbated by increasing eutrophication4,5. With an increasing areal extent of hypoxia and anoxia, macrofauna are negatively affected and lose habitat extent and habitat quality. Climate change is predicted to worsen hypoxia and anoxia6.
In many stratified, nutrient-enriched estuaries such as Chesapeake Bay, USA, seasonally persistent hypoxia can prevail and can occur year after year2. In addition, diel-cycling of hypoxia is frequent in estuaries such as the Chesapeake Bay and other locations and occurs late during the night or the early morning hours in the summer7,8.
Most studies have focused on the effect of continuous exposure of organisms to low [DO] and on their tolerance to hypoxia and anoxia9,10,11,12,13,14. Moreover, studies have looked at the large-scale shift in species distributions, abundances, and species composition in response to extended low [DO]4,15. Often species that are very sensitive to low [DO], die in masses,16 shifting the remaining species to a younger, smaller-sized, short-lived fauna as, for example, found on the Louisiana-Texas Shelf ecosystem4.
Behavioral changes typically precede community collapse17 and studies have reported on behavioral responses of organisms to extended low [DO]4,16,17,18,19,20,21,22,23,24,25. These studies, however, do not focus on the responses of organisms to diel-cycling exposures of hypoxia and the fluctuating nature of [DO] availability in estuaries.
Diel-cycling hypoxia in shallow estuaries has received increasing awareness as studies monitor [DO] more frequently over the course of days with sondes in estuaries16,26. Water can remain hypoxic for hours at the end of the night or early morning hours in the summer when there is no oxygen-generating photosynthesis during the night but high oxygen-consuming aerobic respiration7,16. It was also found that the tides affected the diel cycling of low DO conditions with the most extreme minima observed when low tides coincided with the end of the night27. Only after several hours of hypoxia does [DO] come back to normoxia7,16,28 in the daily cycle.
To determine the behavioral response of C. virginica to diel-cycling hypoxia and pH we monitored the opening and closing of the valves of oysters exposed to laboratory induced diel cycling of [DO] and cyclical pH. Gape responses of bivalves have been used to detect adverse environmental conditions. Valve closures of bivalves in response to contaminants29,30,31, toxic algae32,33,34, thermal pollution35,36,37, food quantity decrease38,39,40, feeding regime39,41, emersion37,42, photoperiod43,44, pH45,46, and combined pH and dissolved oxygen47 have been measured. Gape techniques have, for example, included direct observations48,49,13, continuous measurements using reed switches and magnets (Dreissena monitor)50, or fiber-optic sensors51 that require clear water. In addition, magnet and magnetic-field strength Hall sensors have been used to study mussel gape angle52,53,54,55, and a high-frequency electromagnetic induction system that can measure the varying distance between two electric coils that are glued on the valves has been used56,57,58,59. A high voltage source is required for the electromagnetic induction system and power has to be delivered to both sides of the shell52. This system is also commercially available as the "MOSSELMONITOR" (http://mosselmonitor.nl/).
On a tight research budget, we constructed an inexpensive strain gauge monitor (SGM) to continuously measure oyster gape over laboratory-induced diel cycling of [DO] and pH, under low visibility conditions. Our system is also much simpler than competing systems, allowing many animals to be instrumented during an experiment. We wanted to determine the behavioral responses of C. virginica to diel cycling severe ([DO] = 0.6 mg/L) hypoxia with control pH (pH = 7.8) and cycling pH (pH = 7.8-7.0), respectively, and gape responses to mild ([DO] = 1.7 mg/L) hypoxia. Moreover, we wanted to determine if oysters are able to rapidly respond to changes in [DO] over the diel cycle and how they respond when normoxia returns after a hypoxic event. Perhaps oysters are optimally adapted to the rapidly fluctuating environment that is found in many estuaries16,27 where they live. While more complex valve gape monitors are available, the SGM offers an inexpensive technique that allows continuous measurements of valve gape in waters even in low visibility conditions.
Figure 1. Wheatstone bridge for the valve gape apparatus. Please click here to view a larger version of this figure.
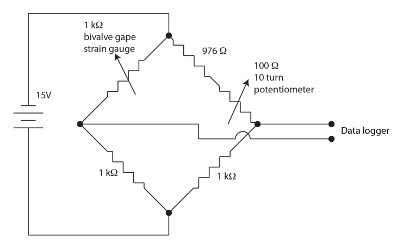
The strain gauge sensors used for monitoring bivalve gape are resistive films in a meander pattern on a polyimide backing. Small amounts of strain modulate the resistance of the sensor. The bivalve flexes the strain gage when it gapes causing a change in the sensor's resistance. We employed a nulling, balanced, Wheatstone bridge for each bivalve channel as shown in Figure 1 to measure the change in sensor resistance. The Wheatstone bridge is nulled by the potentiometer allowing a fairly high gain to be employed by the datalogger. A Wheatstone bridge is a standard method for accurately measuring an unknown resistance using a ratio to a known resistance standard and a voltmeter. The history of this very old technique is discussed in Ekelof (2001)60. We integrated 12 channels, each with its own Wheatstone bridge and nulling potentiometer, into the Strain Gauge Monitor (SGM) unit.
Protocol
1. Construction of the Wheatstone Bridge for the Valve Gape Apparatus
NOTE: The strain gauge is nominally 1000 Ω, so to fully balance and null the bridge, all components should be 1000 Ω.
As in Figure 1, solder two 1 kΩ precision resistors to each other and then to a ~976 Ω resistor and a 100 Ω 10 turn potentiometer. The typical strain gauge range is a few Ω off of the 1000 Ω nominal, so only this resistance needs to be matched. Use a fixed 976 Ω resistor and an adjustable resistor (10 turn potentiometer) for this purpose.
Bring one side of the variable arm and one side of the 1 kΩ resistor to a connector to attach to the bivalve strain gauge as shown in Figure 1.
Attach the top and the bottom of the bridge to a power supply to provide bias current to the bridge as shown in Figure 1.
Attach the midpoints of the bridge to the preamplifier and data-recorder, as shown in Figure 1. This will record the bivalve response as its gape movement modulates the resistance of the strain gauge.
After the bivalve strain gauge is attached, null the bridge by adjusting the 10 turn potentiometer until the voltage at the data recorder input is zero. Use a separate BNC connector and a hand held voltmeter for this purpose. NOTE: Nulling the output means that very high gains can be used with the data recorder without saturating the input, allowing very precise voltages (gape response) to be measured. NOTE: Our multichannel setup uses discrete components hand soldered on a standard piece of electronics "perf-board". This could easily be formalized on a very inexpensive circuit board with little additional effort.
2. General Setting for Diel-Cycling Hypoxia and Cyclical pH
Keep oysters with known low disease prevalence61 in 75-L aquaria under a 14 h light: 10 h dark photoperiod, 7 days per week48, and expose them to cyclical changes in [DO] mimicking diel-cycling hypoxia as found in nature7,8. During 14 h of light, simulate the light levels on a sunny day at 2-m depth in the Rhode River, Maryland61.
Set up diel-cycling hypoxia and cyclical pH in the laboratory for long-term experiments as described in detail by Burrell et al. (2015)49. Manipulate [DO] and pH in each aquarium and hold at pre-determined levels at all times. To avoid valve closure due to food limitation, add phytoplankton62 to the aquaria. Compensate for any potential DO uptake from algal decomposition by regulating [DO] in each aquarium.
3. Bivalve Acclimation
Acclimate oysters to diel-cycling hypoxia for about one week before performing gape experiments.
4. Setting Up Diel-Cycling Hypoxia Plateau Stages
Figure 2. [DO] was manipulated experimentally every day to generate diel cycling hypoxia. Here, 2 consecutive diel cycles are shown over which gape measurements were taken. Each diel cycle contains four [DO] phases: a = supersaturation (SS), b = normoxia after supersaturation, c = low plateau (LP), d = normoxia after low plateau. For the Low Plateau, severe hypoxia ([DO] = 0.6 mg/L) with control or cycling pH is indicated with a thick black line, mild hypoxia ([DO] = 1.7 mg/L) with cycling pH with a thin grey line and normoxia ([DO] = 7.3 mg/L) with a dashed line. Grey boxes indicate 10-h dark intervals over two days. Please click here to view a larger version of this figure.
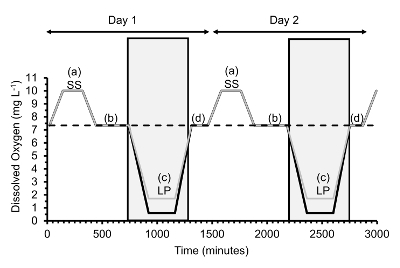
To create diel cycling hypoxia, adjust [DO] over the course of a day in four consecutive phases where [DO] is held constant: 2 h supersaturation, 6 h normoxia after supersaturation, 4 h low plateau (normoxia in the case of the controls) and 2 h normoxia after the low plateau phases.
During the low plateau phase, keep the normoxic treatment constant at a [DO] of 7.3 mg/L, the mildly hypoxic treatment constant at a [DO] of 1.7 mg/L, and the severe hypoxia treatments constant at a [DO] of 0.6 mg/L.
For severe hypoxia, run two pH treatments during the low plateau, i.e., severe hypoxia with control pH in which the pH is kept at 7.8 and severe hypoxia with cyclical pH where the pH is cycled from 7.8 to 7.0 during the low plateau. Run the mildly hypoxic treatment with cyclical pH where pH is cycled from 7.8 to 7.0. Run a second mildly hypoxic treatment with constant pH if desired.
5. Ramping Up/Down of [DO] Between Plateau Stages
Schedule the ramp up or down of [DO] between the four constant phases to take 2 h each, except for the ramp down from normoxia after supersaturation to the low plateau phase, which takes 3 h. Often, hypoxia has been found to occur late at night or early morning hours in the summer7,8; thus, keep the low plateau phase in the dark as well as the periods ramping down to it or up from it, for a total length of darkness of 10 h.
Repeat diel-cycling hypoxia 4-5 days a week61.
Add oysters with sensors in the ramp-up phase before supersaturation and remove them, after closing them, two days later so they experience two complete diel cycles (Figure 2) with sensors attached.
6. Making the Sensor Cable
Figure 3. Bivalve SGM strain gauge valve sensor.(a) Strain gauge sensor, (b) strain gauge attached to an oyster showing a loop of the strain gauge between both valves, (c) strain gauge sensor mounted on an oyster. Please click here to view a larger version of this figure.
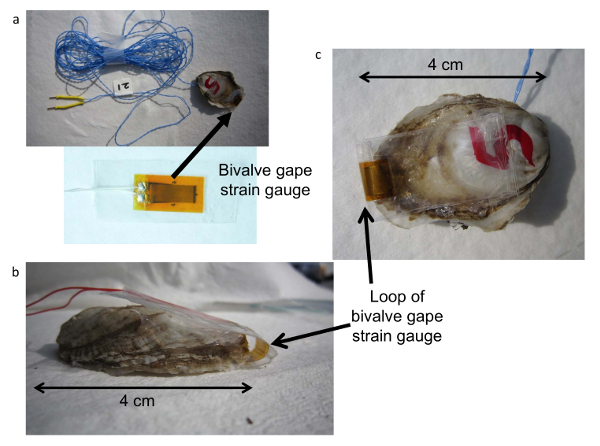
Construct valve gape sensor cables by twisting two 32 AWG (7/40) wires (see Table of Materials) of desired color (Figure 3a). Cut a length of wire twice the length of the desired gape sensor cable, i.e., twice the length from the aquarium to the SGM plus a little extra.
Have two people stand across from each other, each holding one end of the cable.
Slide the handle of a pair of scissors over the cable so that in the middle of the cable a pair of scissors is held by the cable. Keep the cable under tension at all times (it cannot go slack).
Have both people twist the cable in the opposite direction keeping the cable under tension. As the cable starts to twist, the pair of scissors in the middle (which provides weight) will sink down, and both ends of the cable can twist around each other.
Put the two ends of the cable together and hold them high up, not allowing the scissors with the cable to touch the ground or go slack. After the cable is finished twisting, cut the cable on the other end so there are 4 cable leads total, two on each end.
Alternatively, to speed this step up, have one person hold a drill with the wires clamped in on one end, keep tension on the wires, and twist the wires by turning the drill on.
Strip 2 cm of insulation from the wires at each end of the twisted pair.
7. Soldering the Sensor
Tin the exposed cable.
Solder Dsub connector male crimp pins on the two leads on one end of the sensor cable by pretinning the pins and inserting the cables.
Then, insulate the leads by putting shrink tubing over each lead. Choose shrink tubing that is not much larger in diameter than the cable leads. Shrink the heat shrink with a heat gun. The shrink tubing should now be tightly wrapped around the leads. NOTE: These two leads get plugged into the Wheatstone bridge during experiments.
Solder the remaining end of the sensor cable to the two contacts of a 1000 Ω strain gauge with dimensions of 13.5 mm * 5.5 mm grids on the remaining two leads (Figure 3a).
Add a sensor identifying tag to the sensor cable (Figure 3a).
8. Sealing the Sensor
Note: The strain gauges corrode quickly in seawater and thus must be very well sealed. The quality of the seal affects the useful life of the sensor.
Seal the strain gauges by attaching them to PCT-2A tape leaving 15 mm of tape at the long ends and 2 mm on the sides of the sensor (Figure 3a). After attaching PCT-2A tape to the underside of the strain gauge, add quick gel on the sensor leads and the attached open ends of the cables.
Attach a second piece of PCT-2A tape of the same size as the bottom piece to the top side of the sensor and attach both pieces of tape with the strain gauge in the middle together. Do not allow the quick gel to flow anywhere other than over the leads and the sensor cables.
To improve the seal, add thin strips of PCT-2A tape to the edges where the two pieces of tape surrounding the sensor meet. Do this for the three exposed edges of the sensors.
Repeat steps 6.1 to 8.4 eleven times to construct 12 sensor cables with sensors, one for each channel on the Wheatstone bridge. Note: Successful sealing of the strain gauges was the key variable affecting bivalve gape sensor survival in seawater and for minimizing occasional "jumps" in sensor output. Earlier trials without the sealing technique described above resulted in early sensor corrosion and subsequent failure, or rapid drift beyond the measurement range. Future improvements should include techniques to improve the seal.
9. Attaching the Valve Gape Sensor to a Bivalve (Figure 3b,c)
Remove oyster from diel-cycling hypoxia aquarium before the low plateau phase.
With nail polish write an identifying number on the clean, dry shell of each C. virginica.
Attach the sealed strain gauges to the clean and dried valves of live C. virginica (Figure 3b, c) using aquarium sealant to allow the sensor to be removed after the run. Attach the gape sensor with the leads on the right (flat) valve of oyster about mid-way on the shell (Figure 3c) and leave a loop of the strain gauge (Figure 3b) across the valves so as not to impede the opening of the valves (Figure 3b). Glue the remaining free end of the sensor on the left valve. NOTE: Observations confirm that oysters open their valves normally with the sensors in place.
It does not matter which way around the sensor is glued on, however, the direction of the signal will be altered if some leads are glued on the left valve and some on the right valve. The direction of the signal becomes clear from the forced closing of the bivalve at the end of a run. For all bivalves, gluing the strain gauge part with the sensor leads to the same valve side for a consistent direction of change in the gape response signal.
During each step of the process of sealing sensors and attaching them to the oysters, check the sensor resistance periodically to make sure it stays within the range of the readout electronics and to check for potential sensor damage during processing.
Attach 12 oysters to 12 sensors to fill all 12 channels of the SGM.
Add oysters to the different aquaria just before the supersaturation plateau phase.
10. Setup of Datalogger and Multiplexer for the Valve Gape Apparatus
Attach a sensor to the bivalve and then connect the cable to the SGM with individual Wheatstone bridges (Figure 1) for each sensor (a total of 12 bridges) and connected to a datalogger.
Set the data logger sample period to read once every 2.5 s and then averaged for 15 s. NOTE: The 62k sample memory on the datalogger used here allowed 12 h of unattended operation. Larger dataloggers and faster sampling rates can be selected, if desired.
Zero the gape signal for each individual sensor after attaching the sensor to a bivalve using the potentiometer dials on the SGM.
When necessary, as in higher salinities, correct each sensor periodically for drift in sensor response so that the sensor remains in the range of the SGM (-25 to +25 mV) output of the Wheatstone bridge. The SGM range was chosen for maximum sensitivity between the Wheatstone bridge and the input of the datalogger.
11. Deployment of Bivalves with Gape Sensors in Diel-Cycling Hypoxia
After the aquarium sealant has cured (ca 30 min) return the bivalves to an oxygenated holding bucket with flow-through water for at least 5 h to allow the aquarium sealant to leach before submersion in the experiment.
Place oysters in the aquariums during the ramp-up phase to the supersaturation (SS) plateau (Figure 2).
12. Recovery of Bivalves With Gape Sensors
When recovering the oyster from the aquarium with diel-cycling hypoxiaat the end of the two day period, use your fingers to trigger the oyster to close and produce a closing signal in the sensor voltage. This way, the direction and the magnitude of the closing signal can be recorded
Define the oyster as open if the sensor value is larger than ½ of the closed value. Define the oyster as closed if the sensor value is smaller than ½ the closing value. NOTE: Eastern oysters do not open much at the intermediate range.
13. Linearization of Raw Valve Gape Data
Figure 4.Linearization of the raw gape data of an oyster. (a) 14 h light: 10 h dark phases, (b) [DO] over a two-day period with periods of severe hypoxia ([DO] 0.6 mg/L), (c) Raw gape data time series of one oyster. Linear drift of the data is caused by corrosion of the sensor and has to be removed in post-processing, (d) gape data time series after post-processing, (e) approximate real time. To determine the magnitude and the direction of the closing spike, the oyster is triggered to close at the end of a run. Magnitudes vary between different sensors. Please click here to view a larger version of this figure.
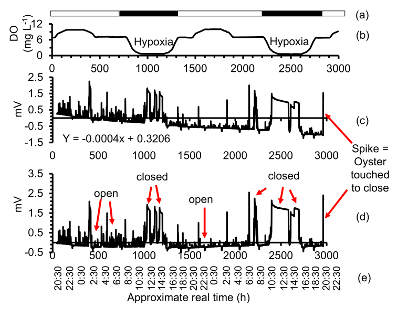
Visually identify oyster gape activity, and use the closed (or open, whichever one is longer) phases of the bivalves to determine instrument drift. Use IF statements in spreadsheet software to mark the closed values with one and open values with zero (e.g., =IF (Cell > 5, 1 (true), 0 (false))).
Remove the shortest phases and run a linear regression on the remaining raw data. Use the regression equation to linearize the experimental data (Figure 4). Linearization has to be done for each sensor individually. Note: Sensor drift is linear over short (minutes) and long (days) time scales and the amount of drift varies from sensor to sensor. Drift is typically negligible over short time spans such as an hour, in which only occasionally linear drift has been noted. Sensor drift necessitates that calibrations of valve gape and sensor gape have to be done for each sensor separately and that a linearization has to be done for each sensor in post-processing of the data.
14. Calibration of Sensors: Actual Gape Width Versus Sensor mV
In a side experiment, sensor voltage can be calibrated to the actual gape width of oysters.
In an aquarium, set up an oyster with a gape sensor. Initiate gape recording. Trigger the oyster to close by touching it. Soon after, the oyster will open up again.
As the oyster is opening, take photographs and write down the sensor voltage of the gape apparatus each time a photograph is taken. Keep track of which photograph goes with which gape apparatus reading. Place a reference scale in the photograph, at the same level of the valves.
Analyze the distance the oyster is open in each photograph (mm) using an open source image processing program such as ImageJ.
Compare actual gape width to sensor voltage and run a regression analysis. This gives the calibration for the actual opening status and further sensor measurements can then be related to actual gape width of the bivalve. Note: While this shows gape width is linearly related to sensor voltage, in actuality, this process takes too long and was not performed for the hypoxia gape experiments. For the hypoxia gape experiments it was important to remove the oysters for the least amount of time necessary from their aquaria to equip them with sensors and return them to the aquaria. For some experiments, the gape width measurement may be important and the calibration techniques above should be followed.
Representative Results
Oysters exposed to uninterrupted normoxic estuarine water (no hypoxia during the low plateau phase of the daily cycle) were open most of the time and only briefly closed infrequently (Figure 5). When they closed varied from oyster to oyster. This pattern has also been found by Loosanoff and Nomejko 194644 and Higgins 198039. Oysters also did not respond to the difference in dark and light phases.
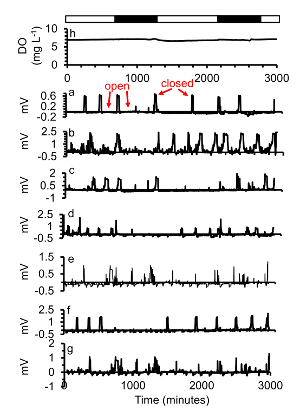
Figure 5. (a-g) A subset of gape responses of seven oysters exposed to (h) two days of normoxia ([DO] = 7.3 mg/L) close occasionally, each oyster with a different pattern. Simulated night time is indicated in the black bars, simulated day time with white bars. This figure has been modified from Porter and Breitburg 201663. Please click here to view a larger version of this figure.
Most oysters exposed to severe hypoxia ([DO] = 0.6 mg/L) during the low plateau phase during diel-cycling hypoxia closed soon after the target [DO] was reached, and some oysters even closed before the target [DO] was reached and remained closed for most of the time that severe hypoxia continued (Figure 6). Control and cyclical pH did not affect gape.
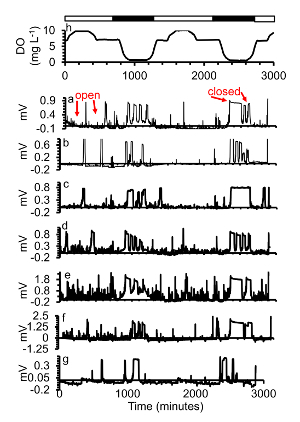
Figure 6. (a-g)A subset of gape responses of seven oysters exposed to (h) two days of diel-cycling hypoxia with severe hypoxia ([DO] = 0.6 mg/L) during the low plateau phase. Simulated night time is indicated in the black bars, simulated day time with white bars. This figure has been modified from Porter and Breitburg 201663. Please click here to view a larger version of this figure.
With mild hypoxia ([DO] = 1.7 mg/L), closings often occurred later during the low plateau phase instead of at the point when target [DO] was reached (Figure 7).
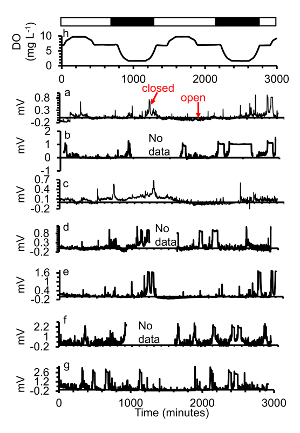
Figure 7. (a-g)A subset of gape responses of seven oysters exposed to (h) two days of diel-cycling hypoxia with mild hypoxia ([DO] = 1.7 mg/L) during the low plateau phase. Simulated night time is indicated in the black bars, simulated day time with white bars. Power was interrupted in c, e, g ("no data"). This figure has been modified from Porter and Breitburg 201663. Please click here to view a larger version of this figure.
During the low plateau phase with varied [DO], oysters under severe ([DO] = 0.6 mg/L) diel-cycling hypoxia with control pH (pH = 7.8) as well as cyclical pH (pH = 7.8-7.0) were closed significantly longer than oysters under normoxia (7.3 mg DO/L). There were no significant differences in the amount of closures between the control and cyclical pH under severe hypoxia. Oysters under mild ([DO] = 1.7 mg/L) diel-cycling hypoxia were closed similar amounts of time during the low plateau as oysters under severe hypoxia with control pH or cyclical pH. In addition, oysters under mild diel-cycling hypoxia were closed a similar amount of time as the oysters under normoxia during the low plateau phase. There were no significant differences in the amount of closures between the control and cyclical pH under severe hypoxia in any of the phases.
During the normoxia phase after the low plateau, oysters that experienced severe hypoxia during the low plateau were open most of the time (Figure 8) and they often opened while [DO] levels were ramping up, even before the normoxia plateau had been reached (Figure 6). During the supersaturation and the normoxia after supersaturation phases, respectively, oysters of all treatments were open most of the time. Oysters showed these patterns over repeated diel cycles over the two day time span.
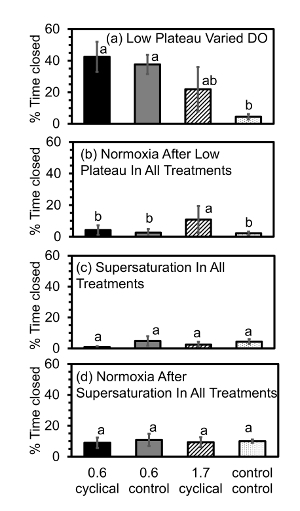
Figure 8. Percent time oysters were closed during the (a) low plateau, (b) normoxia after the low plateau, (c) supersaturation, and (d) normoxia after suspersaturation phases during the diel cycling of [DO]. During the low plateau phase in (a): "0.6, cyclical" = [DO] of 0.6 mg/L (severe hypoxia), cyclical pH (pH = 7.8-7.0) (n = 4); "0.6, control" = [DO] of 0.6 mg/L (severe hypoxia), control pH (pH = 7.8) (n = 4); "1.7, cyclical" = [DO] of 1.7 mg/L (mild hypoxia), cyclical pH (pH = 7.8-7.0) (n = 4); "control, control" = [DO] of 7.3 mg (normoxia), control pH (pH = 7.8) (n = 4). Statistical differences are indicated by different letters above the bars (Nested ANOVA, p≤ 0.05). Error bars are standard errors of the mean. Please click here to view a larger version of this figure.
During the low plateau phase, 1/3 or more oysters from the severe hypoxia, cyclical pH were closed 70% of the time and oysters from the severe hypoxia, control pH were closed 49% of the time (Figure 9). In contrast, during the low plateau phase, 1/3 or more oysters from the mild hypoxic cyclical pH were closed 29% of the time and from the normoxic control pH treatment 12% of the time. The most oysters that closed simultaneously during the low plateau phase, were 82% and 67% of oysters in the severe hypoxia, cyclical pH and severe hypoxia, control pH treatments, respectively. In the mild hypoxic, cyclical pH treatment, a maximum of 45% of oysters closed during the low plateau and oysters exposed to only normoxia a maximum of 42% briefly closed simultaneously. In the normoxia after the low plateau, the supersaturation, and the normoxia after supersaturation, rarely more than 1/3 of oysters closed at any one time.
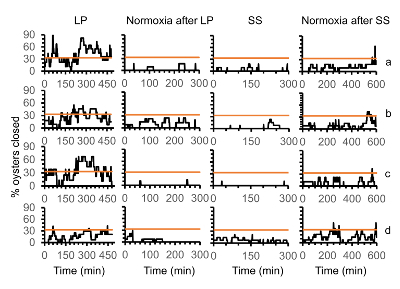
Figure 9. Percent of oysters closed at the same time during the low plateau, normoxia after low plateau, supersaturation, and normoxia after supersaturation phases depicted in Figure 2. For (a), the low plateau was severely hypoxic ([DO] = 0.6 mg/L) and had cyclical pH (pH = 7.8-7.0) (n= 13 oysters). For (b), the low plateau was mildly hypoxic ([DO] = 1.7 mg/L) and had cyclical pH (pH = 7.8-7.0) (n = 11 oysters). For (c), the low plateau was severely hypoxic ([DO] = 0.6 mg/L) and had control pH (pH = 7.8) (n = 11 oysters). For (d), the low plateau phase was normoxic ([DO] = 7.3 mg/L) (n= 11 oysters). Horizontal line depicts where one third of the oysters were closed simultaneously. Please click here to view a larger version of this figure.
Gape width is linearly related to sensor mV (Figure 10). The direction that the sensor is glued on the valve determines the direction of the signal.
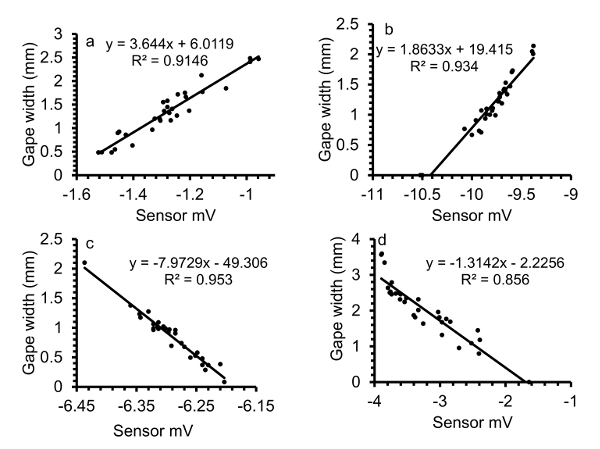
Figure 10. Calibrations of gape sensor voltage to actual gape width of oysters. (a, b) Gape sensor leads affixed to the right valve of the oysters, (c, d) gape sensor leads affixed to the left valve. For consistency in the direction of the response, the sensors should be affixed in the same valve direction of each oyster. Please click here to view a larger version of this figure.
Discussion
Typical studies focus on the continuous, extended time periods of low oxygen conditions and the response, often measured as the survival, of animals. However, at present, our understanding of the behavioral responses of animals to diel-cycling hypoxia is minimal63. Thus, more studies should focus on the behavior of organisms in response to diel-cycling hypoxia which occurs regularly over the summer in many estuaries7,8.
Here, we present a method of continuously measuring the behavioral responses of bivalves to diel-cycling hypoxia and cyclical pH. Oysters did not respond behaviorally to the diel-cycling of pH. However, oysters responded strongly to low oxygen conditions by greatly reducing shell gape. Moreover, more than one third of the oysters closed simultaneously for long periods of time under the hypoxic treatments but most opened again under the normoxic phase that followed. Increasing gape and reducing valve closure to compensate for extended times of valve closure during the severe hypoxia could reduce the effects of diel-cycling hypoxia on the oysters themselves and on the phytoplankton they filter. Thus, such behavioral compensation could minimize food web or ecosystem effects.
A critical step in this SGM method is to successfully seal the gape sensor. If the sensor is not sealed properly, seawater can get to the strain gauge, increase drift, and eventually render it inoperable. 29 sensors were deployed over the course of a mesocosm experiment in Bergeron (2005)64 and the amount of time that they functioned assessed. The longest running sensors functioned for more than 16 d, when the experiment was terminated. The shortest amount of time a sensor lasted was 0.5 d. The average length of successful sensor deployment was 4.9 ± 3.0 days, which includes the sensors that were terminated early. Most sensors worked over the two-day deployment in the diel-cycling hypoxia experiment.
The lifetime of the sensors should be improved, although the current device is suitable for many applications. The aquarium sealant contains acetic acid that may increase the corrosion in the sensors. In the future, non-acidic electronics grade RTV silicone should be used. This may also avert the linear drift that was found and that had to be removed in post-processing. At present, it is recommended to construct a new sensor for each gape run.
A present limitation is that the SGM has only been used in a laboratory setting and sensor cables need to be made sufficiently long to reach the various aquaria. Another limitation of the method is that analyses are not done automatically and have to be performed by hand and the linear drift needs to be corrected individually. If the actual gape space of the bivalve is to be measured, each sensor has to be calibrated individually, as the signal magnitude varies from sensor to sensor. It is important at the end of a run to trigger the bivalve to close to obtain the magnitude and direction of the closing spike. If gape is measured in the field, adverse environmental conditions such as periods of low oxygen conditions may be detected by monitoring the bivalves using the SGM and detecting when more than one third close simultaneously.
Prior to Porter and Breitburg (2016)63, valve gape had not been measured on bivalves exposed to diel-cycling hypoxia. However, various techniques exist to measure valve gape. An advantage of this technique is that it is very inexpensive and does not require direct line of sight to the bivalve. Recurring costs are only the costs for strain gauges. The system can also be made field-deployable by housing the Wheatstone bridge and the datalogger in a waterproof enclosure to be removed periodically for downloading data. The bivalves would be housed in a wet compartment.
We demonstrate significant valve gape responses of oysters to diel-cycling hypoxia and demonstrate that oysters do not respond to cyclical changes in pH. Future work should focus on better sealing the sensor to further reduce early sensor failure and drift possibly using flexible heat-melt adhesive tape as in Jou et al. (2013)57 and by using non-acidic electronic grade RTV silicone. Future studies should measure the valve gape response of other bivalve species to diel-cycling hypoxia and also examine the effect of diel-cycling hypoxia and food limitation on valve gape behavior. It is known that bivalves close in response to low food concentrations but the interaction between diel-cycling hypoxia and food concentration has not been examined.
Disclosures
We don't have anything to disclose.
Acknowledgments
We thank Melinda Forseth for taking photos of oysters and measuring their gape width in ImageJ. We thank Denise Breitburg for access to the aquaria with diel cycling hypoxia and cyclical pH conditions. We thank the Smithsonian Environmental Research Center, Edgewater, Maryland, for space for the experiments. The hypoxia experiments were funded by a National Oceanic and Atmospheric Administration - Center for Sponsored Coastal Ocean Research grant No. NA10NOS4780138 and the Smithsonian Hunterdon Fund to Denise Breitburg. The valve gape measurements during the hypoxia experiments were funded by a Faculty Enhancement Grant by Washington College to Elka T. Porter.
References
- Vaquer-Sunyer R, Duarte CM. Thresholds of hypoxia for marine biodiversity. Proceedings of the National Academy of Sciences of the United States of America. 2008;105(40):15452–15457. doi: 10.1073/pnas.0803833105. [DOI] [PMC free article] [PubMed] [Google Scholar]
- Diaz RJ, Rosenberg R. Spreading dead zones and consequences for marine ecosystems. Science. 2008;321:926–929. doi: 10.1126/science.1156401. [DOI] [PubMed] [Google Scholar]
- Levin LA, Breitburg DL. Linking coasts and seas to address ocean deoxygenation. Nature Climate Change. 2015;5:401–403. [Google Scholar]
- Diaz RJ, Rosenberg R. Marine benthic hypoxia: A review of its ecological effects and the behavioural responses of benthic macrofauna. Oceanography and Marine Biology: An annual Review. 1995;33:245–303. [Google Scholar]
- Patterson HK, Boettcher A, Carmichael RH. Biomarkers of dissolved oxygen stress in oysters: a tool for restoration and management efforts. PLoS One. 2014;9(8):104440. doi: 10.1371/journal.pone.0104440. [DOI] [PMC free article] [PubMed] [Google Scholar]
- Altieri AH, Gedan KB. Climate change and dead zones. Global Change Biology. 2015;21(4):1395–1406. doi: 10.1111/gcb.12754. [DOI] [PubMed] [Google Scholar]
- Tyler RM, Brady DC, Targett TE. Temporal and spatial dynamics of diel-cycling hypoxia in estuarine tributaries. Estuaries and Coasts. 2009;32(1):123–145. [Google Scholar]
- Breitburg DL, et al. Landscape-level variation in disease susceptibility related to shallow-water hypoxia. PLoS One. 2015;10(2):0116223. doi: 10.1371/journal.pone.0116223. [DOI] [PMC free article] [PubMed] [Google Scholar]
- Stickle WB, Kapper MA, Liu L-L, Gnaiger E, Wang SY. Metabolic adaptations of several species of crustaceans and molluscs to hypoxia: toterance and microcalometric studies. Biological Bulletin. 1989;177(2):303–312. [Google Scholar]
- Gamenick I, Jahn A, Vopel K, Guiere O. Hypoxia and sulphide as structuring factors in a macrozoobenthic community on the Baltic Sea shore: colonization studies and tolerance experiments. Marine Ecology Progress Series. 1996. pp. 73–85.
- Modig H, Olafsson E. Responses of Baltic benthic invertebrates to hypoxic events. Journal of Experimental Marine Biology and Ecology. 1998;229(1):133–148. [Google Scholar]
- Riedel B, Zuschin M, Stachowitsch M. Tolerance of benthic macrofauna to hypoxia and anoxia in shallow coastal seas: a realistic scenario. Marine Ecology Progress Series. 2012;458:39–52. [Google Scholar]
- Lombardi SA, Harlan NP, Paynter KT. Survival, acid-base balance, and gaping responses of the Asian Oyster C. ariakensis and the Eastern Oyster C. virginica during clamped emersion and hypoxic immersion. Journal of Shellfish Research. 2013;32(2):409–415. [Google Scholar]
- Jansson A, Norkko J, Dupont S, Norkko A. Growth and survival in a changing environment: Combined effects of moderate hypoxia and low pH on juvenile bivalve Macoma balthica. Journal of Sea Research. 2015;102:41–47. [Google Scholar]
- Gooday AJ, et al. Faunal responses to oxygen gradients on the Pakistan margin: A comparison of foraminiferans, macrofauna and megafauna. Deep Sea Research Part II: Topical Studies in Oceanography. 2009;56(6-7):488–502. [Google Scholar]
- Montagna PA, Ritter C. Direct and indirect effects of hypoxia on benthos in Corpus Christi Bay, Texas, U.S.A. Journal of Experimental Marine Biology and Ecology. 2006;330(1):119–131. [Google Scholar]
- Villnas A, Norkko J, Lukkari K, Hewitt J, Norkko A. Consequences of increasing hypoxic disturbance on benthic communities and ecosystem functioning. PLoS One. 2012;7(10):44920. doi: 10.1371/journal.pone.0044920. [DOI] [PMC free article] [PubMed] [Google Scholar]
- Breitburg D. Effects of hypoxia, and the balance between hypoxia and enrichment on coastal fishes and fisheries. Estuaries. 2002;25(4):767–781. [Google Scholar]
- Costantini M, et al. Effect of hypoxia on habitat quality of striped bass (Morone saxatilis) in Chesapeake Bay. Canadian Journal of Fisheries and Aquatic Sciences. 2008;65(5):989–1002. [Google Scholar]
- Ludsin SA, et al. Hypoxia-avoidance by planktivorous fish in Chesapeake Bay: Implications for food web interactions and fish recruitment. Journal of Experimental Marine Biology and Ecology. 2009;381:121–131. [Google Scholar]
- Zhang H, et al. Hypoxia-driven changes in the behavior and spatial distribution of pelagic fish and mesozooplankton in the northern Gulf of Mexico. Journal of Experimental Marine Biology and Ecology. 2009;381:80–91. [Google Scholar]
- Sparks BL, Strayer DL. Effects of low dissolved oxygen on juvenile Elliptio complanata (Bivalvia:Unionidae) Journal of the Norther American Benthological Society. 1998;17:129–134. [Google Scholar]
- Llanso RJ. Effects of hypoxia on estuarine benthos: the lower Rappahannock River (Chesapeake Bay), a case study. Estuarine, Coastal and Shelf Science. 1992;35(5):491–515. [Google Scholar]
- Riedel B, Zuschin M, Haselmair A, Stachowitsch M. Oxygen depletion under glass: Behavioural responses of benthic macrofauna to induced anoxia in the Northern Adriatic. Journal of Experimental Marine Biology and Ecology. 2008;367(1):17–27. [Google Scholar]
- Riedel B, et al. Effect of hypoxia and anoxia on invertebrate behaviour: Ecological perspectives from species to community level. Biogeosciences. 2014;11(6):1491–1518. [Google Scholar]
- Breitburg DL. Near-shore hypoxia in the Chesapeake Bay: Patterns and relationships among physical factors. Estuarine Coastal and Shelf Science. 1990;30:593–609. [Google Scholar]
- Baumann H, Wallace RB, Tagliaferri T, Gobler CJ. Large natural pH, CO2 and O2 fluctuations in a temperate tidal salt marsh on diel, seasonal, and interannual time scales. Estuaries and Coasts. 2015;38:220–231. [Google Scholar]
- Breitburg DL, et al. Landscape-level variation in disease susceptibility related to shallow-water hypoxia. PLoS One. 2015;10(2):0116223. doi: 10.1371/journal.pone.0116223. [DOI] [PMC free article] [PubMed] [Google Scholar]
- de Zwart D, Kramer JM, Jenner HA. Practical experiences with the biological early warning system "mosselmonitor". Environmental Toxicology and Water Quality. 1995;10(4):237–247. [Google Scholar]
- Kadar E, et al. Avoidance responses to aluminum in the freshwater bivalve Anodonta cygnea. Aquatic Toxicology. 2001;55:137–148. doi: 10.1016/s0166-445x(01)00183-7. [DOI] [PubMed] [Google Scholar]
- Soliman MFM, El-Shenawy NS, Tadros MM, Abd El-Azeez AA. Impaired behavior and changes in some biochemical markers of bivalve (Ruditapes decussatus) due to zinc toxicity. Toxicological & Environmental Chemistry. 2015;97(5):674–686. [Google Scholar]
- Shumway SE, Cucci TL. The effects of the toxic dinoflagellate Protogonyaulax tamarensis on the feeding and behaviour of bivalve molluscs. Aquatic Toxicology. 1987;10:9–27. [Google Scholar]
- Basti L, et al. Effects of the toxic dinoflagellate Heterocapsa circularisquama on the valve movement behaviour of the Manila clam Ruditapes philippinarum. Aquaculture. 2009;291(1-2):41–47. [Google Scholar]
- Tran D, Haberkorn H, Soudant P, Ciret P, Massabuau J-C. Behavioral responses of Crassostrea gigas exposed to the harmful algae Alexandrium minutum. Aquaculture. 2010;298(3-4):338–345. [Google Scholar]
- Shumway SE, Koehn RK. Oxygen consumption in the American oyster Crassostrea virginica. Marine Ecology Progress Series. 1982;9:59–68. [Google Scholar]
- Nicastro KR, Zardi GI, McQuaid CD, Pearson GA, Serrao EA. Love thy neighbour: group properties of gaping behaviour in mussel aggregations. PLoS One. 2012;7(10) doi: 10.1371/journal.pone.0047382. [DOI] [PMC free article] [PubMed] [Google Scholar]
- Dowd WW, Somero GN. Behavior and survival of Mytilus. congeners following episodes of elevated body temperature in air and seawater. Journal of Experimental Biology. 2013;216(3):502–514. doi: 10.1242/jeb.076620. [DOI] [PubMed] [Google Scholar]
- Higgins PJ. Effects of food availability on the valve movements and feeding behavior of juvenile Crassostrea virginica (Gmelin). I. Valve movements and periodic activity. Journal of Experimental and Experimental Marine Biology and Ecology. 1980;45:229–244. [Google Scholar]
- Riisgård HU, Lassen J, Kittner C. Valve-gape response times in mussels (Mytilus edulis)-Effects of laboratory preceding-feeding conditions and in situ tidally induced variation in phytoplankton biomass. Journal of Shellfish Research. 2006;25:901–911. [Google Scholar]
- Robson AA, De Leaniz CG, Wilson RP, Halsey LG. Behavioural adaptations of mussels to varying levels of food availability and predation risk. Journal of Molluscan Studies. 2010;76:348–353. [Google Scholar]
- Robson AA, de Leaniz CG, Wilson RP, Halsey LG. Effect of anthropogenic feeding regimes on activity rhythms of laboratory mussels exposed to natural light. Hydrobiologia. 2010;655:197–204. [Google Scholar]
- Nicastro KR, Zardi GI, McQuaid CD, Stephens L, Radloff S, Blatch GL. The role of gaping behaviour in habitat partitioning between coexisting intertidal mussels. BMC Ecology. 2010;10:17. doi: 10.1186/1472-6785-10-17. [DOI] [PMC free article] [PubMed] [Google Scholar]
- Loosanoff VS, Nomejko CA. Feeding of oysters in relation to tidal stages and to periods of light and darkness. Biological Bulletin. 1946;90(3):244–264. [Google Scholar]
- Comeau LA, Mayrand E, Mallet A. Winter quiescence and spring awakening of the Eastern oyster Crassostrea virginica at its northernmost distribution limit. Marine Biology. 2012;159(10):2269–2279. [Google Scholar]
- Pynonnen KS, Huebner J. Effects of episodic low pH exposure on the valve movements of the freshwater bivalve Anodonta cygnea L. Water Research. 1995;29(11):2579–2582. [Google Scholar]
- Jakubowska M, Normant-Saremba M. The effect of CO2-induced seawater acidification on the behaviour and metabolic rate of the baltic clam Macoma balthica. Annales Zoologici Fennici. 2015;52(5-6):353–367. [Google Scholar]
- Jakubowska M, Normant M. Metabolic rate and activity of blue mussel Mytilus edulis trossulus.under short-term exposure to carbon dioxide-induced water acidification and oxygen deficiency. Marine and Freshwater Behaviour and Physiology. 2015;48(1):25–39. [Google Scholar]
- Newell CR, Wildish DJ, MacDonald BA. The effects of velocity and seston concentration on the exhalent siphon area, valve gape and filtration rate of the mussel Mytilus edulis. Journal of Experimental Marine Biology and Ecology. 2001;262:91–111. [Google Scholar]
- Maire O, Amouroux J-M, Duchene J-C, Gremare A. Relationship between filtration activity and food availability in the Mediterranean mussel Mytilus galloprovincialis. Marine Biology. 2007;152(6):1293–1307. [Google Scholar]
- Borcherding J. Ten years of practical experience with the Dreissena-monitor, a biological early warning system for continuous water quality monitoring. Hydrobiologia. 2006;556(1):417–426. [Google Scholar]
- Frank DM, Hamilton JF, Ward EE, Shumway SE. A fiber optic sensor for high resolution measurement and continuous monitoring of valve gape in bivalve molluscs. Journal of Shellfish Research. 2007;26(2):575–580. [Google Scholar]
- Wilson R, Reuter P, Wahl M. Muscling in on mussels: New insights into bivalve behaviour using vertebrate remote-sensing technology. Marine Biology. 2005;147(5):1165–1172. [Google Scholar]
- Nagai K, Honjo T, Go J, Yamashita H, Seok Jin O. Detecting the shellfish killer Heterocapsa circularisquama (Dinophyceae) by measuring bivalve valve activity with a Hall element sensor. Aquaculture. 2006;255(1-4):395–401. [Google Scholar]
- Robson A, Wilson R, de Leaniz CG. Mussels flexing their muscles: a new method for quantifying bivalve behaviour. Marine Biology. 2007;151(3):1195–1204. [Google Scholar]
- Robson AA, Thomas GR, de Leaniz CG, Wilson RP. Valve gape and exhalant pumping in bivalves: optimization of measurement. Aquatic Biology. 2009;6(1-3):191–200. [Google Scholar]
- de Zwart D, Kramer JM, Jenner HA. Practical experiences with the biological early warning system "mosselmonitor". Environmental Toxicology and Water Quality. 1995;10(4):237–247. [Google Scholar]
- Jou L-J, Lin S-C, Chen B-C, Chen W-Y, Liao C-M. Synthesis and measurement of valve activities by an improved online clam-based behavioral monitoring system. Computers and Electronics in Agriculture. 2013;90:106–118. [Google Scholar]
- Barile NB, Scopa M, Recchi S, Nerone E. Biomonitoring of coastal marine waters subject to anthropogenic use: development and application of the biosensor Mosselmonitor. Ovidius University Annals of Chemistry. 2016;27(2):81–86. [Google Scholar]
- Ballesta-Artero I, Witbaard R, Carroll ML, van der Meer J. Environmental factors regulating gaping activity of the bivalve Arctica islandica in Northern Norway. Marine Biology. 2017;164(5):116. doi: 10.1007/s00227-017-3144-7. [DOI] [PMC free article] [PubMed] [Google Scholar]
- Ekelof S. The genesis of the Wheatstone bridge. Engineering Science and Education Journal. 2001;10:37–40. [Google Scholar]
- Keppel AG, Breitburg DL, Wikfors GH, Burrell RB, Clark VM. Effects of co-varying diel-cycling hypoxia and pH on disease susceptibility in the eastern oyster Crassostrea virginica. Marine Ecology Progress Series. 2015;538:169–183. [Google Scholar]
- Burrell RB, Keppel AG, Clark VM, Breitburg DL. An automated monitoring and control system for flow-through co-cycling hypoxia and pH experiments. Limnology and Oceanography: Methods. 2015;14:168–185. [Google Scholar]
- Porter ET, Breitburg DL. Eastern oyster Crassostrea virginica, valve gape behavior under diel-cycling hypoxia. Marine Biology. 2016;163(218) [Google Scholar]
- Bergeron CM. The impact of sediment resuspension on mercury cycling and the bioaccumulation of methylmercury into benthic and pelagic organisms. University of Maryland; 2005. M.S. thesis. [Google Scholar]


