Abstract
The dense microbial ecosystem in the gut is intimately connected to numerous facets of human biology, and manipulation of the gut microbiota has broad implications for human health. In the absence of profound perturbation, the bacterial strains that reside within an individual are largely stable over time1. In contrast, the fate of exogenous commensal and probiotic strains applied to an established microbiota is variable, largely unpredictable, and greatly influenced by the background microbiota2,3. Therefore, investigation into factors governing strain engraftment and abundance is of critical importance to the emerging field of microbiome reprogramming. Here, we generate an exclusive metabolic niche via administration of a marine polysaccharide, porphyran, and an exogenous Bacteroides strain harboring a rare gene cluster for porphyran utilization. Privileged nutrient access enables reliable engraftment of the exogenous strain at predictable abundances in mice harboring diverse communities of gut microbes. This targeted dietary support is sufficient to overcome priority exclusion by an isogenic strain4, and enables strain replacement. We demonstrate transfer of the 60kb porphyran utilization locus into a naïve strain of Bacteroides, and show finely tuned control of strain abundance in the gut across multiple orders of magnitude by varying porphyran dosage. Finally, we show that this system enables introduction of a new strain into the colonic crypt ecosystem. These data highlight the influence of nutrient availability in shaping microbiota membership, expand the ability to perform a broad spectrum of investigations in the context of a complex microbiota, and have implications for cell-based therapeutic strategies in the gut.
Changes to the microbial membership of the highly competitive and dynamic gut microbiota can impact numerous aspects of host biology5–7. Despite the importance of gut microbe composition in human health, the rules governing invasion of commensal strains into an existing complex community are not well understood. Resident strains often appear to exclude similar invading strains3,4 although in some cases, the opposite is true: the niche occupied by existing strains can be exploited by a similar invading strain8. The inability to predict or control the outcome of fecal microbiota transplants9–11 illustrates the need for basic insight into the factors that influence whether new strains of bacteria can integrate into a pre-existing, complex microbiota.
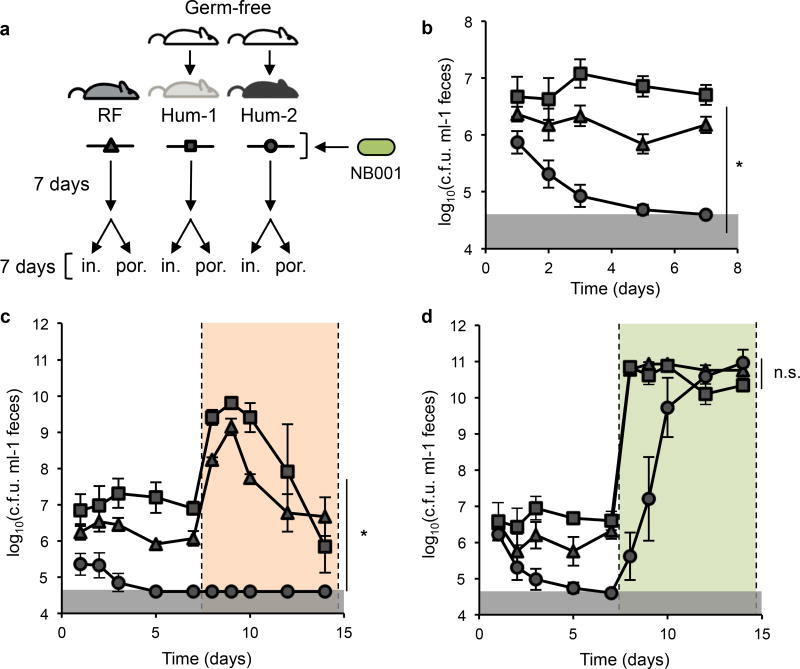
To characterize the extent to which incoming exogenous bacteria variably colonize hosts with distinct microbiotas, we used mice harboring a conventional mouse microbiota and two groups of ex-germ free mice, each colonized with the gut microbiota from two different healthy human donors from the United States (“humanized”) as model hosts. These three groups of mice were administered a rare strain of the prominent gut commensal species Bacteroides ovatus (NB001), which we isolated specifically for its ability to utilize both dietary fructans and marine polysaccharides (discussed below). NB001 was monitored by GFP-positive12 colony forming units (c.f.u.) in feces via selective plating over the course of seven days (Fig. 1a). The different communities (Extended Data, Fig. 1) varied in their ability to integrate NB001 (range of mean log10(c.f.u.) per ml in feces <4.60 to 6.70; Fig. 1b), and one human microbiota was resistant to colonization altogether.
Figure 1. Niche availability varies by microbiota and can be modulated by addition of a privileged nutrient.
a, Schematic of experimental design. Groups of mice with three different gut communities (equilibrated for four weeks on standard lab diet before 7 day exposure to MAC-deficient chow, see Methods) mouse (RF), or human (Hum-1, Hum-2), were colonized with NB001. NB001 was tracked in feces for seven days, and mice were switched to specialized polysaccharide chow containing either inulin (in.) or porphyran-rich seaweed (por.). b, Density of NB001 in feces in the three gut communities over the course of seven days (RF n=9, Hum-1 n=11, Hum-2 n=10) Kruskal-Wallis test, p<0.0001. c, Density of NB001 in feces prior to and upon addition of inulin in the diet (orange shading, RF n=4, Hum-1 n=4, Hum-2 n=4) Kruskal-Wallis test, p=0.03 (*). d, Density in NB001 in feces prior to and upon addition of seaweed in the diet (green shading, RF n=5, Hum-1 n=7, Hum-2 n=6). Kruskal-Wallis test, p=0.19 (n.s.). Error bars indicate s.e.m. Gray shaded boxes represent limit of detection.
Diet is a primary selective force that shapes community membership and functionality13–16. Members of the commensal genus Bacteroides are prolific utilizers of myriad diet-derived microbiota-accessible carbohydrates (MACs) through the machinery encoded by their polysaccharide utilization loci (PULs)17,18. Given the competition for resources in the gut, we hypothesized that specific MACs may serve as a lever by which colonization can be modulated across varied communities. Previously, we employed this strategy in gnotobiotic mice colonized with two species of Bacteroides, using the dietary MAC inulin to enable the inulin-utilizing strain to proliferate19. To test the applicability of this approach in the context of a complex microbiota, we administered inulin to the three aforementioned groups of mice seven days after inoculation with NB001, which is capable of robust growth on inulin as a sole carbon source (Extended Data, Fig. 2a). Over seven days of feeding the same inulin-based diet used in our previous study (10% inulin w/w) to these three groups of mice, NB001 exhibited variable responses across the background microbiotas (range of mean log10(c.f.u.) per ml in feces <4.60 to 6.67; Fig. 1c).
In contrast, microbiota utilization of the non-ubiquitous marine polysaccharide porphyran, the primary carbohydrate in the seaweed Porphyra yezoensis used to prepare culinary nori, is much less common in US microbiotas15. The consumption of porphyran by rare Bacteroides strains is enabled by a horizontally-transferred PUL, which originated in marine bacteria15,20. Whole genome sequencing of NB001 revealed a gene cluster highly homologous to a previously described porphyran PUL (Extended Data, Fig. 2b). We verified the requirement of the intact PUL for specific growth on porphyran in vitro by knockout of porphyran utilization genes (Extended Data, Fig. 2c). We hypothesized that this unique dietary MAC would create a privileged niche within the gut and promote engraftment of an exogenous strain competent in its use. Therefore, we administered a custom diet supplemented with porphyran-rich seaweed (10% nori w/w) to the three groups of mice seven days after inoculation with NB001. Indeed, in response to seaweed in the diet we observed a robust increase in abundance of NB001 (four to six orders of magnitude), irrespective of background microbiota. Additionally, the variability in colonization levels across communities was eliminated (range of mean log10(c.f.u.) per ml in feces 10.34 to 10.96; Fig. 1d), indicating specificity of a privileged nutrient source and its cognate utilization system to promote bacterial growth in vivo. Access to porphyran in the diet rescued NB001 from below the limits of detection in the most resistant microbiota and boosted its abundance to levels indistinguishable from those achieved in the other two microbiotas (Fig. 1d). Despite potential limitations of this specific polysaccharide system in populations colonized with competing porphyran utilizers (e.g., a fraction of Japanese individuals15), together these data suggest a powerful approach in using rare utilization system-nutrient pairs to reliably control strain engraftment independent of the background microbiota, and implicate nutrient availability as a key modulator of strain integration into the gut community.
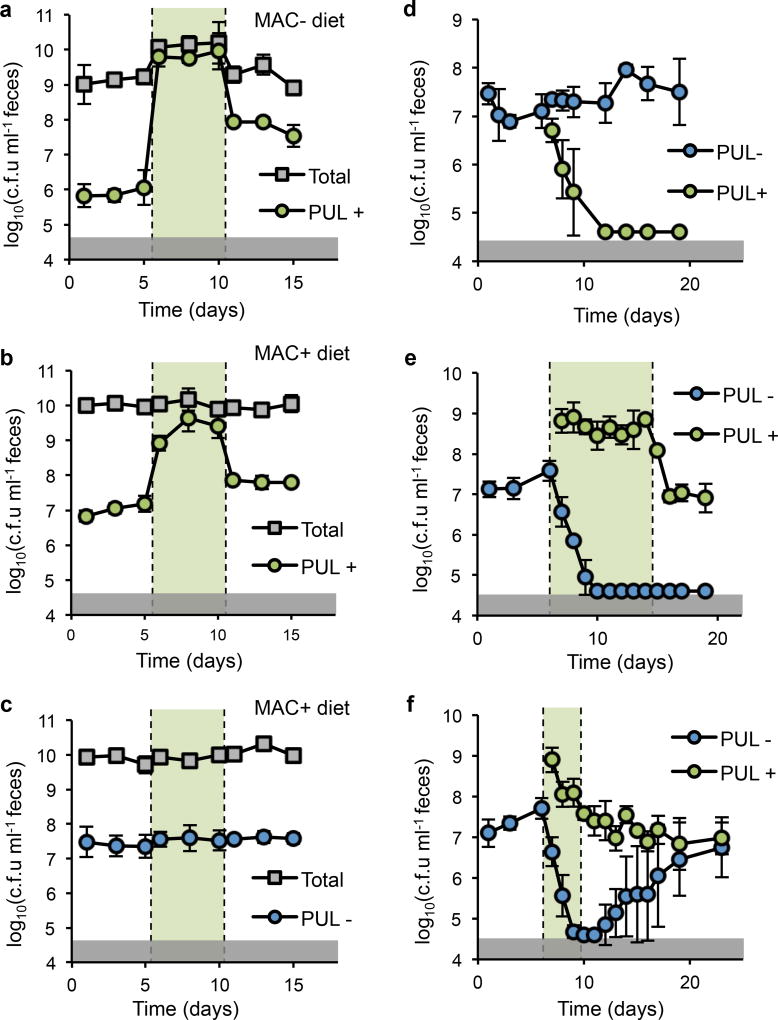
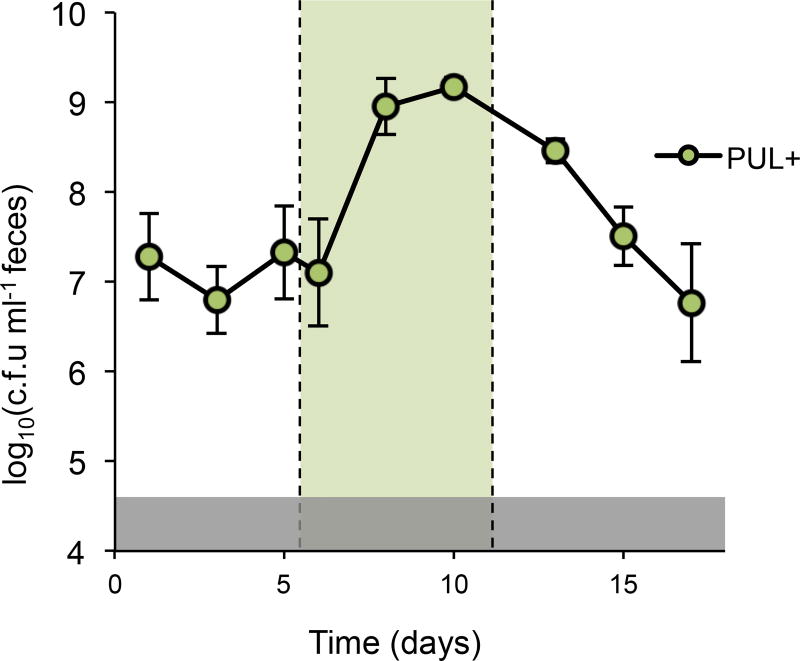
Given the context independence of strain engraftment via access to porphyran in the diet (Fig. 1d), we next tested whether the population size could be reversibly expanded by addition and removal of the substrate in vivo. We colonized conventional mice with NB001 and tracked c.f.u. in feces before, during, and after a five day administration of 1% porphyran in the drinking water. To test the influence of competing polysaccharides in the diet, we performed this experiment on both standard, MAC-rich chow and a MAC-deficient chow that provides no exogenous polysaccharides to the microbiota. With or without other competing dietary MACs NB001 responded robustly to introduction of porphyran, showing a large and highly reproducible increase in abundance (Fig. 2a, b). This response was contingent upon access to porphyran, as deletion of eight genes required for its metabolism abolished the effect (Fig. 2c). Additionally, the porphyran alone did not significantly affect the composition of the background microbiota (Extended Data, Fig. 3), supporting the lack of porphyran use by members of the background community.
Figure 2. Access to a privileged nutrient mediates population size and overcomes isogenic self-exclusion.
Density of NB001 (PUL+), NB001 lacking the ability to utilize seaweed polysaccharides (PUL-), and total culturable anaerobes (Total) in feces of conventional mice. Periods of administration of porphyran in drinking water indicated by green shading (a–c: 1% w/v (maximum possible), d–f: 0.1% w/v (to induce 1-log above PUL+)). a, Mice colonized with PUL+ and fed a MAC-deficient diet or b, MAC-rich diet demonstrated toggling of strain abundance upon administration of porphyran. c, Mice colonized with PUL- and fed a MAC-rich diet showed no change in strain abundance with administration of porphyran. d–f Mice eating a MAC-rich diet were colonized with PUL− for 6 days, and challenged with PUL+ on day 6. d, PUL+ is excluded by PUL− in the absence of porphyran. e, PUL+ displaces PUL− with access to porphyran for eight days. f, PUL+ and PUL− stably co-exist after a three day pulse of porphyran. Error bars indicate standard deviation, n=4 for all experiments. Gray shaded boxes represent limit of detection Time (days)
Bacteroides species engage in interesting colonization behavior in which an early colonizer will exclude a challenging isogenic strain4, a phenomenon known as priority effects in the ecological literature21,22. We hypothesized that this behavior could be overcome by providing a privileged nutrient to the challenging strain to create an exclusive metabolic niche. Indeed, an early-colonizing version of NB001 lacking the porphyran PUL excludes a PUL-competent NB001 challenge strain in conventional mice (Fig. 2d). Supplementing porphyran in the water, accessible only to the challenging strain, enabled the challenging strain to overcome the priority effect, and resulted in displacement of the early colonizer by the challenging strain (Fig. 2e). Replacement of the early-colonizing strain required that the challenging strain have access to porphyran (Extended Data Fig. 4a), and displacement was robust to subsequent challenge by the original colonizer (Extended Data Fig. 4b). Interestingly, an intermediate colonization state could be achieved with shorter porphyran administration (Fig. 2f).
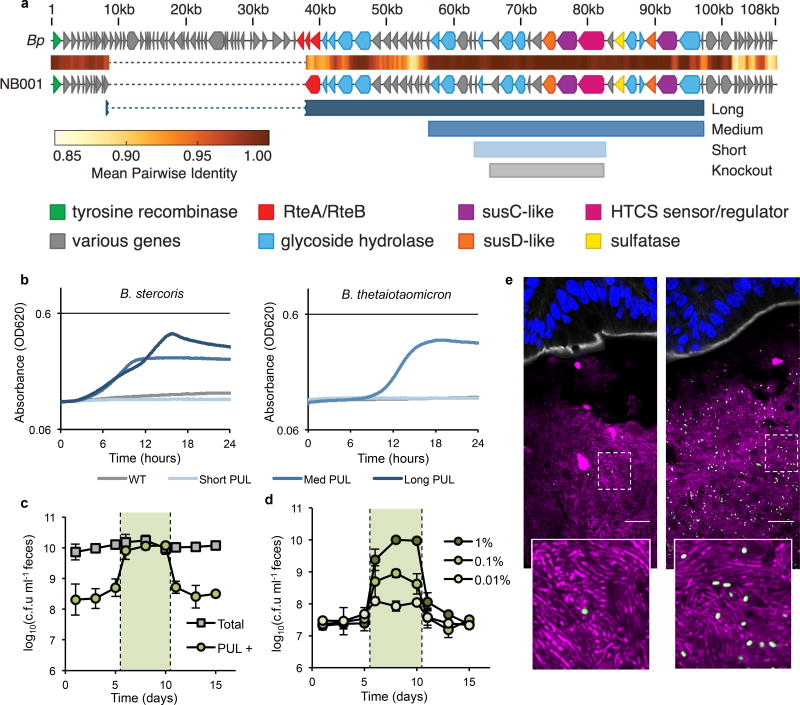
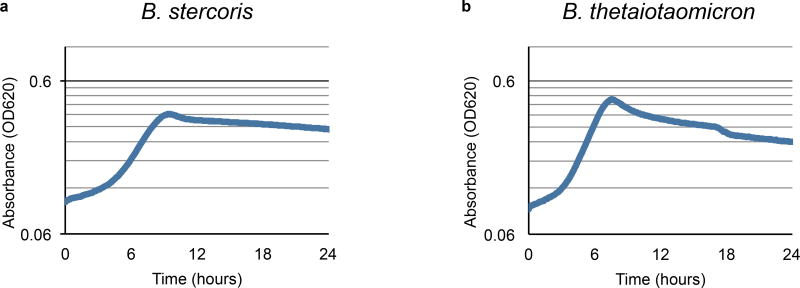
Based on the sequence of the NB001 porphyran polysaccharide utilization locus (PUL), using alignment to the previously published PUL from Bacteroides plebeius15,20 (Fig. 3a), we constructed three different length PULs, ranging from 10 to 34 of the genes (20–60kb) from the full-length PUL (Fig. 3a). Previous methods19 used to transfer a five gene PUL were not sufficient for these much larger constructs, and so we assembled the plasmids via homologous recombination in yeast23 before integration into the chromosome of two target strains unable to utilize porphyran for growth, Bacteroides stercoris and Bacteroides thetaiotaomicron (Extended Data Fig. 5). Transfer of the short 10 gene PUL was insufficient to impart growth on porphyran to either naïve species of Bacteroides tested (Fig. 3b), but the medium 21 and long 34 gene PULs allowed for growth in vitro (Fig. 3b). Interestingly, the two species harboring the medium 21 gene PUL reached different maximum absorbance during growth, though this could be due to differences in efficiency of growth in minimal media (Extended Data Fig. 6). A significant drop-off in conjugation efficiency was observed with the 34 gene PUL, and only B. stercoris yielded transconjugants. When colonized into conventional mice, abundance of B. thetaiotaomicron harboring the medium 21 gene PUL could be reversibly expanded through addition of porphyran in the water (Fig. 3c), as well as B. stercoris harboring the long 34 gene PUL (Extended Data Fig. 7).
Figure 3. Control over population size can be engineered, and is highly tunable.
a, Schematic of porphyran PUL from NB001 aligned to the previously published B. plebeius PUL. Shown below are the different minimal PULs (Long = 34 genes, Medium = 21 genes, and Short = 10 genes) designed and tested for ability to confer growth on porphyran. The eight gene region deleted from NB001 PUL− is shown in gray (Knockout). b, Growth curves for natural and engineered strains on porphyran as sole carbon source. c, B. thetaiotaomicron harboring the medium length PUL colonized in conventional mice consuming a MAC-rich diet demonstrates toggling upon administration of 1% w/v porphryan in the drinking water (shaded green, n=4). Error bars indicate standard deviation. d, NB001 PUL+ colonized in conventional mice consuming a MAC-rich diet demonstrates tunable (finely controlled) response to porphyran in the drinking water (shaded green, n=4 per group). Error bars indicate standard deviation. e, NB001 expressing GFP colonized in conventional mice given 0.01% porphryan (left) or 1% porphyran (right). Image is of proximal colon with host epithelium visualized by DAPI (nuclei, blue), epithelial border visualized by phalloidin (F-actin, white), background microbiota by DAPI segmented from host epithelium (bacteria, magenta), NB001 by endogenous GFP (bacteria, green). Scale bar represents 16 µm.
We next sought to determine if strain abundance could be tuned by varying the amount of porphyran supplemented in the diet. We colonized conventional mice with a GFP fluorescent NB001 strain and tracked c.f.u. in the feces before, during, and after administration of 1%, 0.1%, or 0.01% weight by volume porphyran in the drinking water (resulting in an estimated 70, 7, or 0.7mg porphyran per mouse per day, respectively). For each ten-fold dilution of porphyran administered in the water, we observed a ten-fold decrease in abundance of NB001 in the feces (Fig. 3d), indicating fine control over strain abundance through modulation of the porphyran concentration. When examining prepared frozen tissue sections of proximal colon from mice consuming 0.01% or 1% porphyran in the water for endogenous GFP of the NB001 strain via confocal microscopy, a substantial increase in GFP-positive cells is seen when comparing mice given 0.01% vs. 1% porphyran (Fig. 3e).
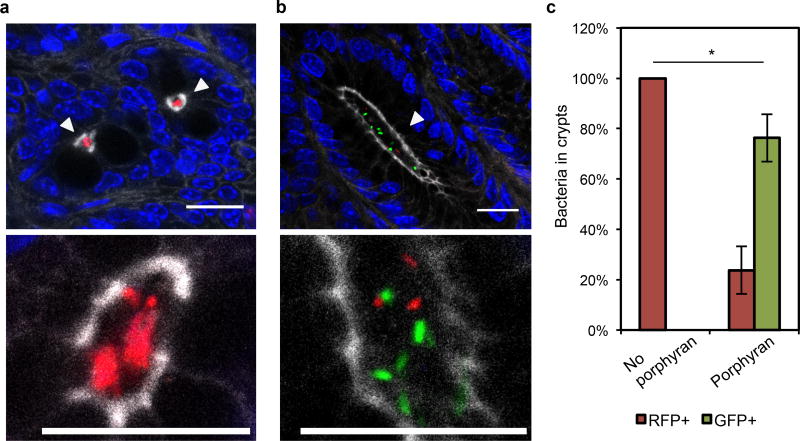
Finally, we investigated whether access to porphyran enabled colonization of the colonic crypts. We previously observed that B. thetaiotaomicron is excluded from crypt colonization when an isogenic strain of B. thetaiotaomicron is already established in the gut12, and sought to overcome this crypt exclusion with privileged access to porphyran. We colonized germ-free mice with wild-type B. thetaiotaomicron expressing red fluorescent protein (RFP) and challenged seven days later with an engineered B. thetaiotaomicron harboring the 21 gene porphyran PUL and expressing green fluorescent protein (GFP). When mice were given no porphyran in the diet, the GFP-expressing strain was excluded (Fig. 4a, c) as anticipated. However, when mice were given a porphyran-rich seaweed chow, the GFP-expressing, porphyran-utilizing strain was able to colonize the colonic crypts (Fig. 4b, c), suggesting privileged nutrient-utilization enables remodeling of this specialized microhabitat.
Figure 4. Access to porphyran enables colonization of the colonic crypt niche.
Wild-type B. thetaiotaomicron expressing RFP was introduced to germ free mice seven days before challenge with engineered B. thetaiotaomicron harboring the 21 gene PUL and expressing GFP. The challenge strain of B. thetaiotaomicron is excluded from colonic crypts when no porphyran is administered, a, but can remodel the crypt population when given access to porphyran through seaweed in the diet, b. Images are proximal colon with host epithelium visualized by DAPI (nuclei, blue), epithelial border including crypt borders visualized by phalloidin (F-actin, white),wild-type B. thetaiotaomicron by endogenous RFP (bacteria, red) and PUL+ B. thetaiotaomicron by endogenous GFP (bacteria, green). Bacteria in crypts are highlighted by white arrowheads. Scale bars represent 16 µm. c, quantification of bacteria in crypts in the presence or absence of porphyran through seaweed in the diet (n=3 mice per group, n>100 crypt-resident bacteria counted per mouse). Two-tailed t-test, p=0.0395 (*). Error bars indicate standard deviation.
Factors governing commensal niche availability in the gut microbiota are not well defined, and predicting the amenability of a given community to the introduction of a new strain is a challenge. Here we have illustrated the concept of exclusive nutrient access as an important principle underlying strain engraftment and abundance control. Moreover, the context independence, reversibility, and tunability of this approach expand utility of these results to broad applications ranging from experimental manipulation of complex communities to fine-tuned control of therapeutic strains or cocktails of microbes. Understanding the role of nutrient utilization in the microbiota clarifies our image of the gut niche landscape, and makes strides toward designing systems that can be deployed to enhance human health.
Methods
Bacterial Culture and Strain Isolation
All bacterial growth was performed at 37° C under anaerobic conditions. Growth for introduction into mice was performed in rich media (tryptone-yeast-glucose12) with no antibiotics added. Growth curves and selective growth on porphyran were performed in Salyers Minimal Media (SMM 100mL in dH2O: 0.1g (NH4)2SO4, 0.1g Na2CO3, 0.05g L-cysteine, 10mL 1M KPO4 pH7.2, 5mL Mineral Salts (1L in dH2O: 18g NaCl, 0.53g CaCl2*2H2O, 0.4g MgCl2*6H2O, 0.2g MnCl2*4H2O, 0.2g CoCl2*6H2O), 1mL 0.4mg/mL FeSO4, 0.1mL 1mg/mL Vitamin K3, 0.1mL Histidine/Hematin*, 0.05mL 0.01mg/mL Vitamin B12) with carbon source added to a final concentration of either 0.2% (Extended Data, Fig. 5), 0.5% (Extended Data, Fig. 2), or 0.8% (Fig. 3b) weight by volume and filter sterilized. Path length for our growth curves was 0.58cm. SMM was either made fresh the day of the experiment, or prepared without histidine/hematin or L-cysteine and stored at 4° C for up to four weeks, with the missing components added the day of the experiment.
C.f.u. were determined by serial dilution of feces (resuspension of 1µL of fresh feces in PBS, performing serial dilutions, and extrapolating to c.f.u./mL feces) and cultivation on brain-heart infusion blood agar (BHI-BA) with appropriate selective antibiotics (200 µg/mL gentamycin, and 25 µg/mL erythromycin or 2 µg/mL tetracycline), or on SMM agar plates (for GFP visualization, 2× SMM tempered to 50° C + equal volume 3% agar tempered to 50° C) with selective antibiotics. Total culturable anaerobe number was determined via plating serial dilutions of fecal matter on BHI-BA without antibiotics.
NB001 (porphyran utilizing B. ovatus) and NB004 (naïve B. stercoris) were isolated from primary waste effluent at the San Jose Wastewater Treatment Facility via selection in liquid culture (SMM) with 200ug/mL gentamycin (as Bacteroides are naturally gentamycin resistant), and for NB001, growth on 0.8% porphyran. Briefly, settled primary effluent was diluted ten-fold into SMM and grown as above for 24 h, subcultured at 1:200 into fresh media and grown for 24 h, and plated in serial dilutions onto BHI-BA. Single colonies were picked into SMM for growth confirmation, cryogenic storage, and downstream analysis. Species were identified via whole genome sequencing. A GFP-expressing, erythromycin-resistant variant of NB001 was generated as described previously12.
Genome Sequencing and Analysis
Genomic DNA was isolated from NB001 and NB004 using a PureLink Genomic DNA Mini Kit (Invitrogen). Samples were prepared for multiplexed Illumina sequencing using a Nextera XT DNA Library Preparation Kit (Illumina) and run on an Illumina MiSeq using a 2×150bp paired-end kit. Approximately 10 million sequencing reads were obtained for each sample. De novo assembly of the reads was performed with the Geneious De Novo Assembler (Biomatters), yielding an average coverage of ~100 reads/bp. Gene annotation and alignment was also performed using Geneious.
Porphyran PUL Transfer and Knockout
Generation of the porphyran utilization deficient mutant was performed using tdk counterselection as described previously24. A thymidine kinase (tdk) deficient mutant (NB007) of NB001 was generated by exposing an aliquot of liquid culture of NB001 to 320nm ultraviolet light from a VWR-20E transilluminator (VWR) for 60 seconds and plating on BHI-BA supplemented with 200ug/mL of 5-fluoro-2’-deoxyuridine (FUdR). Eight genes predicted to be essential for growth on seaweed MACs (homologous to BACPLE_1692-1699) were knocked out using pWD034 (Extended Data Table 1), a plasmid with 1.5kb of homology upstream and downstream of the target region assembled via Golden Gate Assembly into an erythromycin-resistant, tdk-containing vector.
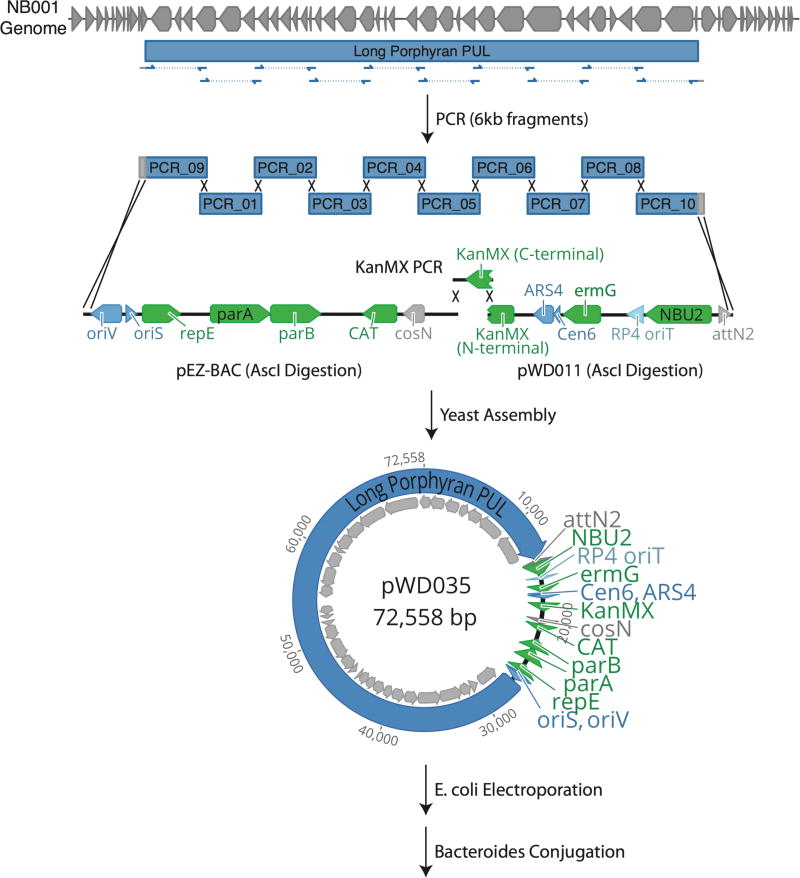
Generation of the seaweed PUL knock-in strains required expansion of previous knock-in methods19 due to the large size of the PULs (20–60kb). Based on gene annotations and sequence alignment to a previously published mobile element conferring seaweed polysaccharide utilization capabilities15,20, we designed three minimal PULs of varying sizes (20kb, 40kb, and 60kb, Fig. 3a). To propagate such large pieces of DNA and integrate them into the Bacteroides genome we used a three-step process: performing yeast assembly into a custom shuttle vector, propagating it in S. cerevisiae and E. coli, and then performing conjugation and genomic integration into Bacteroides species. The minimal PULs were each divided into multiple 6kb fragments with 200bp homology between pieces and assembled in yeast23 with fragments containing the KanMX selectable marker and CEN6/ARS4 origin for selection and growth in yeast, the bacterial artificial chromosome origin and chloramphenicol selectable marker (from pEZ-BAC vector, Lucigen) for selection and growth in E. coli, and the conjugative origin and parts for integration and selection in Bacteroides (Supplementary Information). Yeast cells with successfully assembled constructs were lysed by mechanical disruption with 0.5mm glass disruptor beads (USA Scientific), and lysates (raw lysates not purified for plasmid DNA) mixed 1:20 with electrocompetent E. coli S17-125 cells. DNA was introduced to the E. coli cells via electroporation according to a protocol previously described26. Successfully transformed E. coli were then grown and conjugated with NB004 and B. thetaiotaomicron VPI-5482 (Bt) as previously described12. NB004 successfully integrated all PULs, but Bt was initially unable to integrate any PUL constructs. To improve rates of genomic integration, we pre-integrated an NBU2 integrase-expressing plasmid with tetracycline resistance into Bt, and this improved efficiency such that Bt conjugants were obtained for both the short and medium length PUL constructs.
Porphyran Preparation
Raw culinary nori derived from Porphyra yezoensis (acquired from https://www.rawnori.com) was added at 10% weight by volume to distilled water and subjected to hot water extraction by autoclaving for three hours. The mixture was then cooled and centrifuged at 11,000×g. Resulting supernatant was ethanol precipitated by combining with 100% ethanol to a final concentration of 80% ethanol, 20% supernatant and incubating at 4° C for 24–72 h. Precipitate was recovered by centrifugation at 26,000×g and dried for 24 h before manual grinding to generate a measurable powder.
Mice
Ex-germ free or restricted flora (RF) conventional male or female Swiss-Webster mice (Taconic) aged 8–16 weeks were housed in gnotobiotic isolators and fed either an autoclaved standard diet (LabDiet 5K67) or a custom diet as indicated below (Bio-Serv) in strict accordance with a Protocol for Care and Use of Laboratory Animals approved by the Stanford University Administrative Panel of Laboratory Animal Care. Sample size was chosen to generate enough power for statistical significance, animals were split into groups at time of weaning, and blinding was not performed. Introduction of all Bacteroides strains into either ex-germ free or RF mice was performed by oral gavage of 108 c.f.u. of the given strain in culture media.
Mice were humanized (Fig. 1) with fecal samples from healthy human donors that were stored at −80° C, thawed and resuspended in pre-reduced PBS in anaerobic conditions at a 1:1 dilution, and 0.2 mL administered per oral into germ free mice (total sample administered per mouse equivalent to 0.1mL frozen fecal matter). The mice were allowed to equilibrate the human microbiota for four weeks while consuming the standard lab diet (Purina LabDiet 5K67, mix of crude protein, fat, and carbohydrates). One week before introduction of NB001, mice were switched to MAC-deficient chow (AIN-93G, 68% glucose). Seven days after introduction of NB001, mice were switched to custom diets with inulin or seaweed as the only available MACs (AIN-93G, 10% unique polysaccharide, 58% glucose). RF mice (Fig. 2, 3) were administered porphyran in the water at the percent indicated, weight by volume. Gnotobiotic mice were fed either standard lab diet (Fig. 4a) or custom seaweed chow (Fig. 4b) as above.
16S rRNA Analysis
DNA was extracted from fecal samples using the PowerSoil 96-htp kit (MoBio), and amplified at the 16S v4 region (515F, 806R). Qiime 1.9 was used to analyze the resulting Illumina-generated sequencing reads as previously described27. Data were rarified to the sample with the lowest number of reads (16384), and open-reference OTU picking via UCLUST and taxonomy assignment through the Greengenes 13.8 database was performed.
Microscopy
Tissue was harvested and immediately fixed in 4% paraformaldehyde in PBS for 48 hours at 4C. Cassettes were transferred to 20% sucrose for 24 h, and then samples were embedded in OCT Compound (Tissue-Tek) before sectioning at 30µm on a Leica CM3050 S cryostat. Sections were stained for 30 minutes with 4’,6-Diamidino-2-phenylindole dihydrochloride (DAPI; Sigma-Aldrich) and Alexa Fluor 594 Phalloidin (Life Technologies). Images were taken on a Zeiss LSM 700 confocal microscope.
Data Availability
The 16S sequencing data have been deposited in the Sequence Read Archive under accession number PRJNA436622. Source data for all animal experiments are available with the online version of this paper.
Extended Data
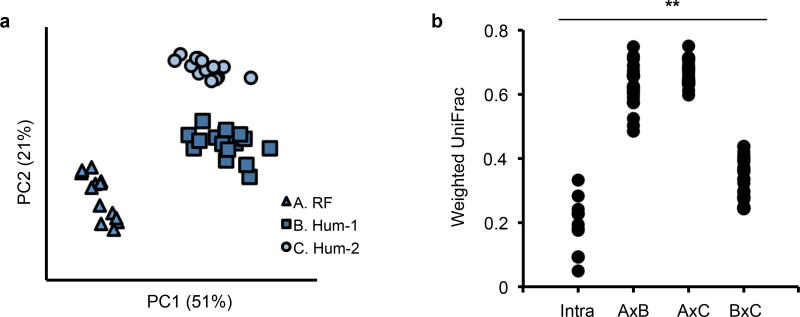
Extended Data Figure 1. Three model background communities of gut microbes are distinct from each other.
a, Principal Coordinates Analysis of weighted UniFrac distance for 16S rDNA amplicons from feces from the three background community groups from Fig. 1 before diet switch, conventional (RF), or humanized (Hum-1 and Hum-2), n=10. b, Comparison of weighted UniFrac distances within each group (Intra) or across groups (A×B, A×C, B×C). Oneway ANOVA, p<0.0001.
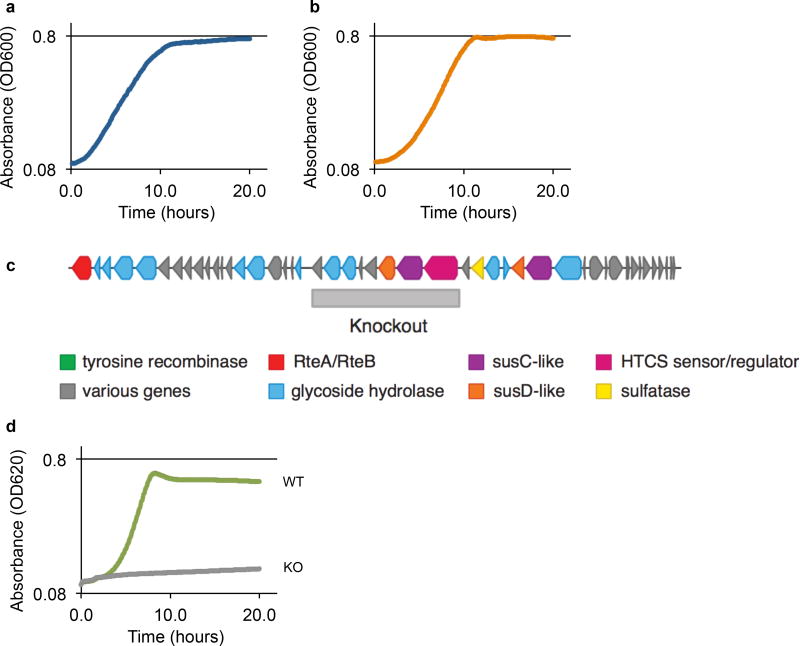
Extended Data Figure 2. NB001 can utilize both inulin and porphyran as sole carbon sources for growth.
NB001 demonstrates growth in minimal media with either a, glucose (doubling time = 157 minutes), or b, inulin (doubling time = 127 minutes), as the only provided carbon source. c, Schematic of porphyran PUL from NB001 aligned to the previously published B. plebeius PUL, based on data from whole genome sequencing. Shown below is the region deleted via homologous recombination to abolish ability to utilize porphyran. d, NB001 demonstrates ability to grow on porphyran (doubling time = 98 minutes) as the sole carbon source (WT), and growth is abrogated when genes required for porphyran utilization are knocked out (KO).
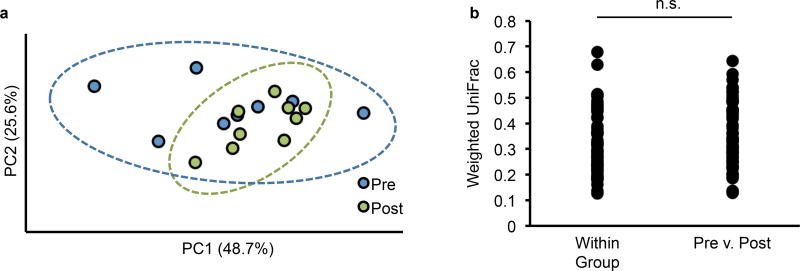
Extended Data Figure 3. Porphyran does not significantly impact the gut microbiota in the absence of a known utilizer.
Weighted UniFrac analysis was performed on fecal 16S data for conventional mice colonized with a porphyran utilization knockout (Fig. 2c) before addition of porphyran (Pre, n=8) or after (Post, n=9). a, Principal Coordinates Analysis b, Unpaired two-tailed t-test, p=0.25
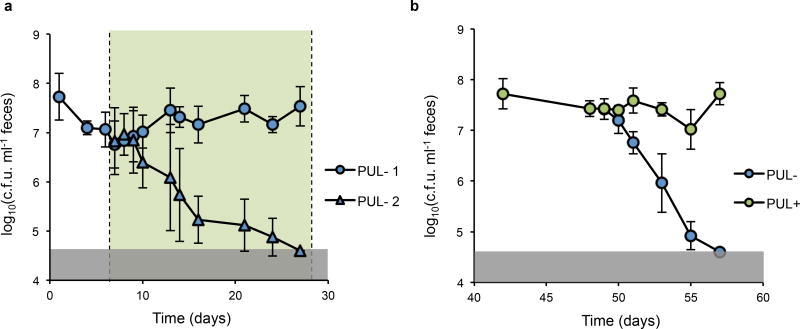
Extended Data Figure 4. Primary colonizer displacement is robust and contingent upon access to porphyran.
a, Conventional mice (n=7) eating a MAC-rich diet were colonized with NB001 (PUL− 1) containing an eight-gene deletion abrogating its ability to utilize porphyran (Extended Data Fig. 2d) demonstrate resistance to subsequent challenge with an isogenic knockout strain (PUL− 2) in the presence of 1% porphryan in the drinking water. Notably, our conventionally raised mice were permissive to colonization by this strain and other species of Bacteroides tested (B. thetaiotaomicron, B. fragilis, B. uniformis, B. vulgatus, stable colonization range of 8*10e5 – 3*10e8 c.f.u. per ml feces), which differs from reports of tests on other conventionally raised mice, potentially reflecting inter-colony microbiota differences. b, Mice from Fig. 2e were challenged with the originally colonizing porphyran utilization knockout (PUL−) that was displaced by the utilizer (PUL+) and demonstrated colonization resistance to the previously displaced knockout strain. Error bars are standard deviation. Gray shaded boxes represent limit of detection.
Extended Data Figure 5. Minimal porphyran utilization PULs were constructed via PCR and yeast assembly.
Schematic representing construction of designed porphyran PULs. Based on alignment to previously published B. plebeius porphyran utilization PUL, three regions were targeted for minimal PUL assembly and amplified via PCR from the NB001 genome. The PCR fragments were assembled with digests of both a custom and commercially available vector in yeast (see Methods), after which colonies carrying correctly assembled plasmids were lysed and directly applied to E. coli for electroporation.
Extended Data Figure 6. B. stercoris and B. thetaiotaomicron demonstrate different abilities to grow in minimal media.
Wild-type a, B. stercoris and b, B. thetaiotaomicron grown in Salyers minimal media with glucose as the only carbon source demonstrate different maximum optical densities reached (B. stercoris max OD = 0.363, B. thetaiotaomicron max OD = 0.453). This suggests a possible explanation for why both species with the 21 gene PUL grow to different maximum optical densities as well (Fig. 3b).
Extended Data Figure 7. Abundance of B. stercoris harboring the 34 gene PUL can be controlled in the context of a conventional mouse microbiota.
Conventional mice (n=5) fed a MAC-rich diet were colonized with a strain of B. stercoris harboring the designed 34 gene porphyran PUL and density of the engineered strain was tracked in the feces. Upon administration of 1% porphyran in the drinking water (green shaded box), density of B. stercoris increased, and subsequently decreased upon removal of porphyran. Error bars are standard deviation. Gray shaded box represents the limit of detection.
Extended Data Table 1.
List of oligonucleotides used to build the porphyran PUL plasmids
| ID | Sequence |
|---|---|
| AA34 | GGGTACAGAAAATCTCGGTC |
| AA35 | TTCATCATGTCGTACGAAGG |
| AA36 | TACTTCCATTTGGGGTGAAG |
| AA37 | TACAGTCCCTTTGGACAATG |
| AA38 | CATACTTTAGCATCGTCGAAAAG |
| AA39 | TTTCCATTTCCAGGATTCCC |
| AA40 | GTAGCTCCGGTGACATTTAC |
| AA41 | TCTTTAGCTGAAGAAACGGC |
| AA42 | AAGCTTGCGTATGTCGATAG |
| AA43 | TTATCGCCATTCTTCAGCAG |
| AA44 | TGGCATCCGACGAATATAAG |
| AA45 | TTTGGAATAGGCCAGTATGC |
| AA46 | AGGTAAAGGCACTGTTTTCC |
| AA47 | ATATAGCCGGAGATTCTCCG |
| AA48 | CATCTACATCATGTCGGACG |
| AA49 | CTGTCCGGTCATGATACATG |
| AA50 | GATTCTCTTGGGGACAGAAC |
| AA51 | AGTTTCCCATTTCACGTCTG |
| AE30 | ATTTATCTATCCATTCAGTTTGATTTCTCAGGACTTTACATCGTCCTGAAAGTATTTGTTttttgggtgttgatatggcag |
| AE31 | ATTTATCTATCCATTCAGTTTGATTTCTCAGGACTTTACATCGTCCTGAAAGTATTTGTTaatcccaatacagtctgttactg |
| AE45 | GTGAGTTGATTGCTACGTAAATAACTTCGTATAGCATACATTATACGAAGTTATGGACTAcgcaggtcaatatccggaa |
| AE46 | GTGAGTTGATTGCTACGTAAATAACTTCGTATAGCATACATTATACGAAGTTATGGACTAggtaaacctccccgatgg |
| AE47 | GTGAGTTGATTGCTACGTAAATAACTTCGTATAGCATACATTATACGAAGTTATGGACTAtttagaacatatttttccgatttgccag |
| AE49 | AAACAGCATTCCAGGTATTAGAAG |
| AE50 | CACTGCCCGCTTTCCAGTCGGGAAACCTGTGCGGCCGCTTTCCTTCTTTCTCTCTTCTGGcagtatagcgaccagcattc |
Extended Data Table 2.
List of PCR products used to build the porphyran PUL plasmids
| ID | Length (bps) | Primer 1 | Primer 2 | Template |
|---|---|---|---|---|
| PCR_01 | 6,220 | AA35 | AA36 | NB001 Genomic DNA |
| PCR_02 | 6,280 | AA37 | AA38 | NB001 Genomic DNA |
| PCR_03 | 6,247 | AA39 | AA40 | NB001 Genomic DNA |
| PCR_04 | 6,169 | AA41 | AA42 | NB001 Genomic DNA |
| PCR_05 | 6,232 | AA43 | AA44 | NB001 Genomic DNA |
| PCR_06 | 6,187 | AA45 | AA46 | NB001 Genomic DNA |
| PCR_07 | 6,185 | AA47 | AA48 | NB001 Genomic DNA |
| PCR_08 | 6,178 | AA49 | AA50 | NB001 Genomic DNA |
| PCR_09 | 6,162 | AE45 | AA34 | NB001 Genomic DNA |
| PCR_10 | 6,138 | AA51 | AE30 | NB001 Genomic DNA |
| PCR_11 | 5,359 | AE46 | AA40 | NB001 Genomic DNA |
| PCR_12 | 4,638 | AE47 | AA42 | NB001 Genomic DNA |
| PCR_13 | 3,524 | AA47 | AE31 | NB001 Genomic DNA |
| Vector_02 | 769 | AE49 | AE50 | KanMX |
Extended Data Table 3.
List of digests used to build the porphyran PUL plasmids
| ID | Length (bps) | Plasmid | Restriction Enzyme |
|---|---|---|---|
| Vector_01 | 4,730 | pWD011 | AscI |
| Vector_03 | 7,234 | pWD012 (pEZ-BAC) | AscI |
Extended Data Table 4.
List of plasmids used in this work
| Plasmid Name |
Description | Length (bps) |
Parts used in yeast assembly | Relevant Figure |
|---|---|---|---|---|
| pWW3452 | High GFP, erythromycin resistance | 6,031 | N/A | Fig. 1, Fig. 3e |
| pNBU2-ermGb | Erythromycin resistance | 4,909 | N/A | Fig. 2, Extended Data Fig. 3 |
| pNBU2-tetQb | Tetracycline resistance | 6,662 | N/A | Fig. 2, Extended Data Fig. 3 |
| pWD034 | Porphyran PUL Deletion (main operon) | 7,148 | N/A | Fig. 2c |
| pWD035 | Long Porphyran PUL | 72,558 | PCR_01, PCR_02, PCR_03, PCR_04, PCR_05, PCR_06, PCR_07, PCR_08, PCR_09, PCR_10, Vector_01, Vector_02, Vector_03 | Fig. 3a, b |
| pWD036 | Medium Porphyran PUL | 53,695 | PCR_04, PCR_05, PCR_06, PCR_07, PCR_08, PCR_10, PCR_11, Vector_01, Vector_02, Vector_03 | Fig. 3a, b, c |
| pWD037 | Short Porphyran PUL | 32,364 | PCR_05, PCR_06, PCR_12, PCR_13, Vector_01, Vector_02, Vector_03 | Fig 3a, b |
| cLS428 | High mCherry, tetracycline resistance | 7,621 | N/A | Fig. 4 |
Acknowledgments
We thank N. Ratnayeke for early experimental assistance, S. Higginbottom for gnotobiotic assistance, and K. Ng, Z. Russ, and W. Van Treuren for analytical assistance. We would also like to thank the Amieva and Huang Labs for use of their microscopy resources, and D. Shepherd for valuable discussions. Many thanks also to N. Pudlo and E. Martens for the protocol on porphyran extraction, and E. Sonnenburg, T. Fukami, and M. Fischbach for commenting on this manuscript. This material is based upon work supported by the National Science Foundation under Grant No. 1648230, the NIDDK (R01-DK085025 to JLS), and an NSF Graduate Fellowship (DGE-114747 to E.S.S).
Footnotes
Supplementary Information is available in the online version of this paper.
Author Contributions
E.S.S. and J.L.S. generated the idea for the project. E.S.S. performed the in vivo studies, 16S sample preparation and analysis, and in vitro growth studies. W.C.D. sequenced and analyzed the NB001 genome and constructed the porphyran PUL plasmids. K.M.P. and E.S.S. performed in vivo crypt studies, imaging, and analysis. W.R.W. isolated NB001 and performed in vitro growth characterization. All authors contributed to experimental design and data analysis, and E.S.S. and J.L.S. wrote the manuscript. All authors discussed the results and commented on the manuscript.
E.S.S., W.C.D., W.R.W., and J.L.S. are founders at Novome Biotechnologies, Inc. and have filed a provisional patent based on the work described here.
References
- 1.Faith JJ, et al. The Long-Term Stability of the Human Gut Microbiota. Science. 2013;341:1237439. doi: 10.1126/science.1237439. [DOI] [PMC free article] [PubMed] [Google Scholar]
- 2.Frese SA, Hutkins RW, Walter J. Comparison of the Colonization Ability of Autochthonous and Allochthonous Strains of Lactobacilli in the Human Gastrointestinal Tract. Adv. Microbiol. 2012;2:399–409. [Google Scholar]
- 3.Maldonado-Gomez MX, et al. Stable Engraftment of Bifidobacterium longum AH1206 in the Human Gut Depends on Individualized Features of the Resident Microbiome. Cell Host Microbe. 2016;20:515–526. doi: 10.1016/j.chom.2016.09.001. [DOI] [PubMed] [Google Scholar]
- 4.Lee SM, et al. Bacterial colonization factors control specificity and stability of the gut microbiota. Nature. 2013;501:426–429. doi: 10.1038/nature12447. [DOI] [PMC free article] [PubMed] [Google Scholar]
- 5.Ivanov II, et al. Induction of Intestinal Th17 Cells by Segmented Filamentous Bacteria. Cell. 139:485–498. doi: 10.1016/j.cell.2009.09.033. [DOI] [PMC free article] [PubMed] [Google Scholar]
- 6.Atarashi K, et al. Induction of Colonic Regulatory T Cells by Indigenous Clostridium Species. Science. 2011;331:337–341. doi: 10.1126/science.1198469. [DOI] [PMC free article] [PubMed] [Google Scholar]
- 7.Lawley TD, et al. Targeted Restoration of the Intestinal Microbiota with a Simple, Defined Bacteriotherapy Resolves Relapsing Clostridium difficile Disease in Mice. PLoS Path. 2012;8:e1002995. doi: 10.1371/journal.ppat.1002995. [DOI] [PMC free article] [PubMed] [Google Scholar]
- 8.Stecher B, et al. Like will to like: Abundances of closely related species can predict susceptibility to intestinal colonization by pathogenic and commensal bacteria. PLoS Path. 2010;6 doi: 10.1371/journal.ppat.1000711. [DOI] [PMC free article] [PubMed] [Google Scholar]
- 9.Ratner M. Seres's pioneering microbiome drug fails mid-stage trial. Nature Biotech. 2016;34:1004–1005. doi: 10.1038/nbt1016-1004b. [DOI] [PubMed] [Google Scholar]
- 10.Ericsson AC, Personett AR, Turner G, Dorfmeyer RA, Franklin CL. Variable colonization after reciprocal fecal microbiota transfer between mice with low and high richness microbiota. Front. Microbiol. 2017;8:1–13. doi: 10.3389/fmicb.2017.00196. [DOI] [PMC free article] [PubMed] [Google Scholar]
- 11.Landy J, et al. Variable alterations of the microbiota, without metabolic or immunological change, following faecal microbiota transplantation in patients with chronic pouchitis. Sci. Rep. 2015;5:12955. doi: 10.1038/srep12955. [DOI] [PMC free article] [PubMed] [Google Scholar]
- 12.Whitaker WR, Shepherd ES, Sonnenburg JL. Tunable Expression Tools Enable Single-Cell Strain Distinction in the Gut Microbiome. Cell. 2017;169:538–546. e12. doi: 10.1016/j.cell.2017.03.041. [DOI] [PMC free article] [PubMed] [Google Scholar]
- 13.Sonnenburg ED, et al. Diet-induced extinctions in the gut microbiota compound over generations. Nature. 2016;529:212–215. doi: 10.1038/nature16504. [DOI] [PMC free article] [PubMed] [Google Scholar]
- 14.Ridaura VK, et al. Gut Microbiota from Twins Discordant for Obesity Modulate Metabolism in Mice. Science. 2013;341:1241214–1241214. doi: 10.1126/science.1241214. [DOI] [PMC free article] [PubMed] [Google Scholar]
- 15.Hehemann JH, et al. Transfer of carbohydrate-active enzymes from marine bacteria to Japanese gut microbiota. Nature. 2010;464:908–912. doi: 10.1038/nature08937. [DOI] [PubMed] [Google Scholar]
- 16.David LA, et al. Diet rapidly and reproducibly alters the human gut microbiome. Nature. 2014;505:559–563. doi: 10.1038/nature12820. [DOI] [PMC free article] [PubMed] [Google Scholar]
- 17.Sonnenburg JL, et al. Glycan foraging in vivo by an intestine-adapted bacterial symbiont. Science. 2005;307:1955–1959. doi: 10.1126/science.1109051. [DOI] [PubMed] [Google Scholar]
- 18.Xu J, et al. Evolution of Symbiotic Bacteria in the Distal Human Intestine. PLoS Biol. 2007;5:1574–1586. doi: 10.1371/journal.pbio.0050156. [DOI] [PMC free article] [PubMed] [Google Scholar]
- 19.Sonnenburg ED, et al. Specificity of polysaccharide use in intestinal Bacteroides species determines diet-induced microbiota alterations. Cell. 2010;141:1241–1252. doi: 10.1016/j.cell.2010.05.005. [DOI] [PMC free article] [PubMed] [Google Scholar]
- 20.Hehemann JH, Kelly AG, Pudlo NA, Martens EC, Boraston AB. Bacteria of the human gut microbiome catabolize red seaweed glycans with carbohydrate-active enzyme updates from extrinsic microbes. Proc. Natl Acad. Sci. USA. 2012;109:19786–19791. doi: 10.1073/pnas.1211002109. [DOI] [PMC free article] [PubMed] [Google Scholar]
- 21.Drake JA. Community-assembly mechanics and the structure of an experimental species ensemble. Am. Nat. 1991;137:1–26. [Google Scholar]
- 22.Fukami T. Historical Contingency in Community Assembly: Integrating Niches, Species Pools, and Priority Effects. Annu. Rev. Ecol. Evol. Syst. 2015;46:1–23. [Google Scholar]
- 23.Chandran S, Shapland E. Synthetic DNA. 2017:187–192. doi: 10.1007/978-1-4939-6343-0_14. [DOI] [PubMed] [Google Scholar]
- 24.Martens EC, Chiang HC, Gordon JI. Mucosal glycan foraging enhances fitness and transmission of a saccharolytic human gut bacterial symbiont. Cell Host Microbe. 2008;4:447–457. doi: 10.1016/j.chom.2008.09.007. [DOI] [PMC free article] [PubMed] [Google Scholar]
- 25.Simon R, Priefer U, Pühler A. A broad host range mobilization system for in vivo genetic engineering: transposon mutagenesis in gram negative bacteria. Nature Biotech. 1983;1:784–791. [Google Scholar]
- 26.Ostrov N, et al. Design, synthesis, and testing toward a 57-codon genome. Science. 2016;353:819–822. doi: 10.1126/science.aaf3639. [DOI] [PubMed] [Google Scholar]
- 27.Caporaso JG, et al. QIIME allows analysis of high-throughput community sequencing data. Nature Methods. 2010;7:335–336. doi: 10.1038/nmeth.f.303. [DOI] [PMC free article] [PubMed] [Google Scholar]
Associated Data
This section collects any data citations, data availability statements, or supplementary materials included in this article.
Data Availability Statement
The 16S sequencing data have been deposited in the Sequence Read Archive under accession number PRJNA436622. Source data for all animal experiments are available with the online version of this paper.


