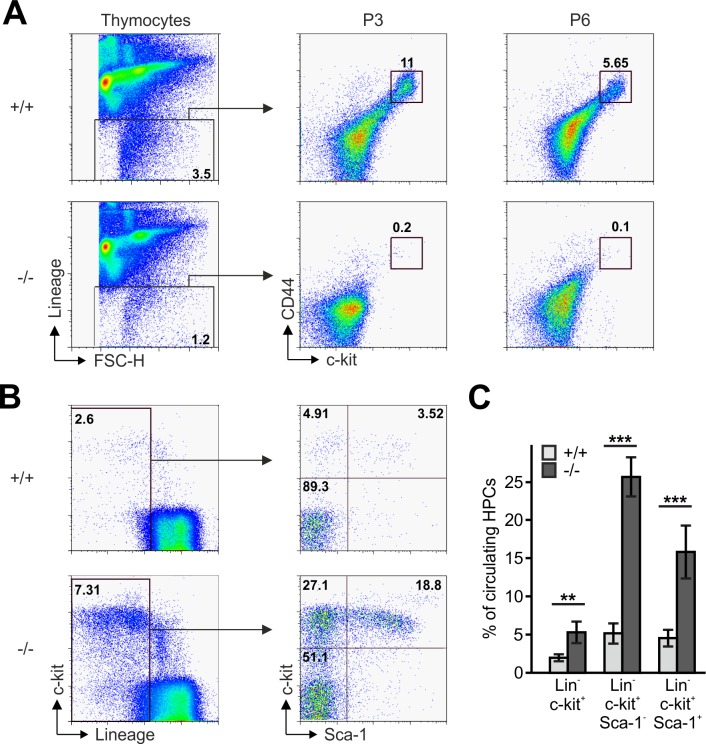
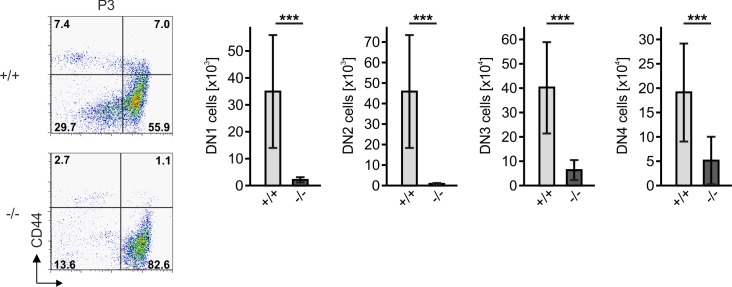
Figure 3. Reduced frequencies of T cell progenitors in Fermt3-/- thymi.
(A) Thymocytes from Fermt3+/+ and Fermt3-/- mice were stained for lineage markers (B220, CD19, TER119, NK1.1, CD11b, Gr-1, CD8α, CD3e, TCRβ, TCRγδ and CD11c), CD44 and c-kit to identify DN1-2 (Linneg, c-kithi, CD44hi) and the DN3-4 (Linneg, c-kitlow, CD44low) populations. (B and C) PB from Fermt3+/+ and Fermt3-/- animals (P3) were stained for lineage markers (TER119, B220, CD11b, Gr-1, CD11c, NK1.1, CD4 and CD8α), c-kit and Sca-1 to identify hematopoietic progenitor cells and analysed by flow cytometry. N = 4. Numbers within the representative FACS plots indicate cell percentages. Bars indicate means ± standard errors. **p<0.01; ***p<0.001. See also Figure 3—figure supplement 1.


