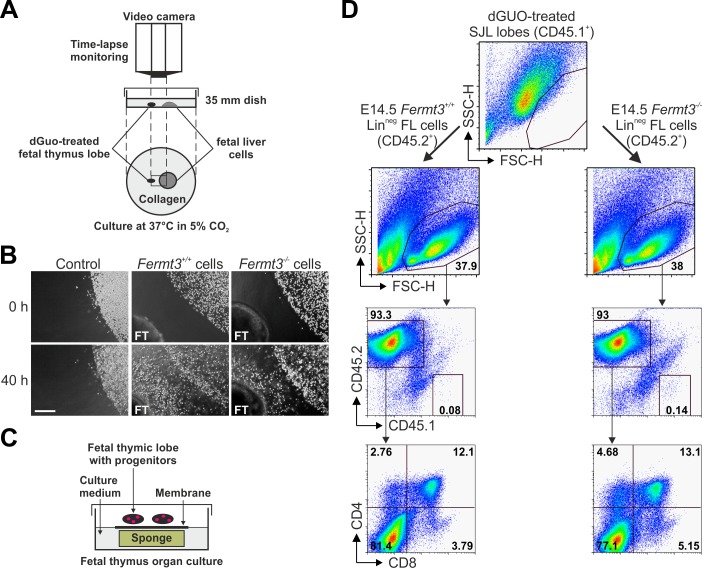
Figure 7. Kindlin-3-deficient T cell progenitors home to the fetal thymus and further develop into SP T cells ex vivo.
(A) Schematic description of the thymus attraction experiment. (B) Representative images of the thymus attraction experiment at the beginning and 40 hr after starting the experiment. Linneg fetal liver cells from control or Fermt3-/- embryos (both CD45.2+) are seen in the upper right corner of the images, a dGuo-treated wild-type fetal thymus lobe (FT, CD45.1+) is located at the lower left corner. Scale bar 250 µm. (C) Schematic description of the fetal thymus organ culture. (D) dGuo-treated fetal thymus lobes seeded with fetal liver cells as performed in (B) were further cultured for 18 days. Cells were stained for CD45.1, CD45.2, CD4, and CD8. Numbers within the representative FACS plots indicate cell percentages.

