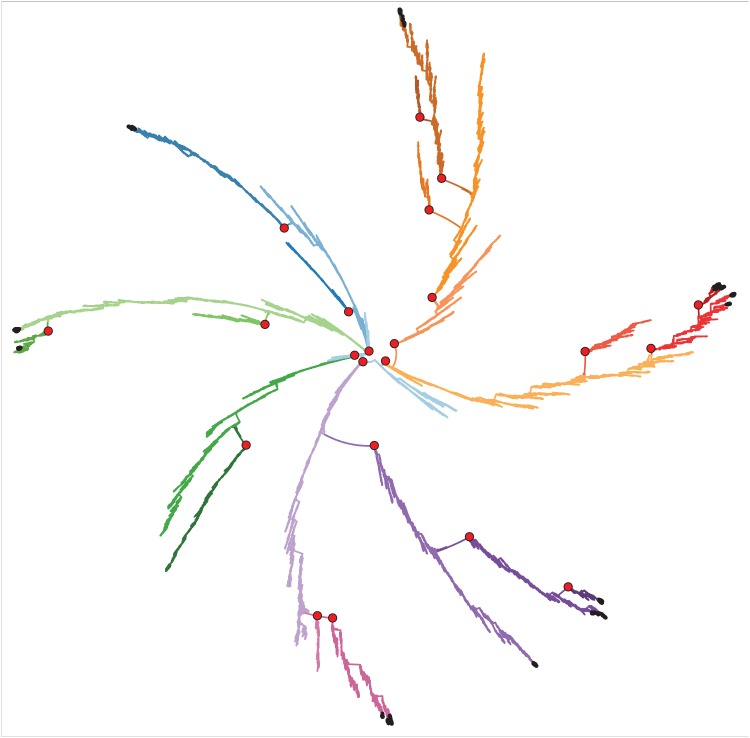
Appendix 1—figure 1. Genealogical tree corresponding to the simulation reported in Figure 3 of the main text.
This tree contains around 80000 different strains clustered into 24 species with the threshold of generations. Colors are the same as in Figure 3a, b, c and f of the main text. Black dots represent the strains that are present in the last snapshot of Figure 3a and b (Generation ). 10 out of 24 species are still extant in the last snapshot. Red circles show the branching points.

