Abstract
Differences in female and male brains exist across the animal kingdom and extend from molecular to anatomical features. We show here that sexually dimorphic anatomy, gene expression, and function in the nervous system can be modulated by past experiences. In the nematode C. elegans, sexual differentiation entails the sex-specific synaptic pruning of synaptic connections between sex-shared neurons, giving rise to sexually dimorphic circuits in adult animals 1. We discovered that starvation during juvenile stages is memorized in males to suppress the emergence of sexually dimorphic synaptic connectivity. These circuit changes confer increased chemosensory responsiveness in adult males following juvenile starvation. We find that an octopamine-mediated starvation signal dampens serotonin production to convey the memory of starvation. Serotonin production is monitored by a 5-HT1A serotonin receptor homolog which acts cell-autonomously to promote the pruning of sexually dimorphic synaptic connectivity under well-fed conditions. Our studies demonstrate how life history can impact neurotransmitter production, synaptic connectivity, and behavioral output in a sexually dimorphic circuit.
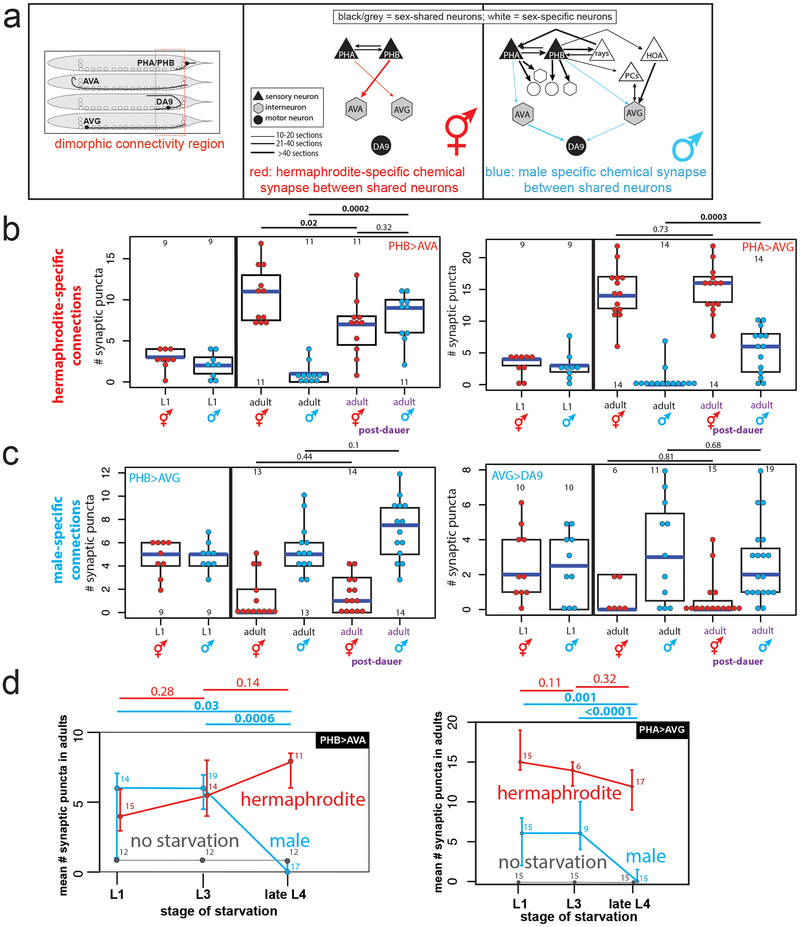
During sexual maturation, nervous systems develop a number of sexually dimorphic features. To investigate whether sexually dimorphic maturation of the nervous system is modulated by early-life experience, we considered the two sexes of C. elegans, male and hermaphrodites 2. Among the most striking sexual dimorphisms in C. elegans are sex-specific synaptic connectivity patterns 3,4. These sex-specific wiring differences arise during sexual maturation (the L4 stage) via sex-specific pruning of “sex-hybrid” juvenile connectivity 1,4 (Fig.1a). We found that early-life experience alters sex-specific synaptic pruning. Specifically, adult males that pass as sexually immature juveniles through a developmental arrest stage induced by unfavorable external conditions display no sex-specific pruning of the normally hermaphrodite-specific PHB>AVA and PHA>AVG synaptic connections (Fig.1b, Extended Data Fig.1a,b). In contrast, normally male-specific connections prune in hermaphrodites that pass as juveniles through this dauer stage (Fig.1c). These observations suggest a sexually dimorphic sensitivity to the memory of environmental stress. While a number of stressors had no effect on male-specific synapse pruning (Extended Data Fig.1c), starvation of males (but not hermaphrodites) at early juvenile stages fully recapitulated the impact of dauer passage on male-specific synapse pruning (Fig.1d, Extended Data Fig.1d). In contrast, starvation during the L4 stage did not result in defects in male-specific synaptic pruning (Fig.1d). Synaptic pruning is first observable in the L4 stage 4, demonstrating that starvation prevents pruning if the stress occurs before its onset, but does not halt or reverse synaptic pruning.
Fig.1: Starvation inhibits male-specific synaptic pruning.
(a) Schematic of adult chemical synaptic connectivity based on electron micrograph reconstruction3,4. Left panel shows location of dimorphic synaptic connections within animal. mMN = male motor neuron, mIN= male interneuron.
(b) Hermaphrodite-specific PHB>AVA and PHA>AVG synaptic connections are maintained in post-dauer adult males as quantified by GRASP and iBLINC, respectively. Each dot represents one animal (red=hermaphrodite, cyan=male in all figures, n=number of animals, shown in each column), blue bars show median, black boxes represent quartiles, vertical black lines show range (b,c,d). Control animals are the progeny of the post-dauer animals. L1 animals (pre-synaptic pruning) shown to the left. p-values shown by two-sided Wilcoxon rank-sum test with Bonferroni corrections for multiple testing (where applicable; see Methods) (b,c,d). Representative images shown Extended Data Fig.1a. While we observed a decrease in synaptic puncta in starved PHB>AVA hermaphrodites, this was not consistently reproducible across experimental replicates and thus is likely an experimental artifact.
(c) The male-specific PHB>AVG and AVG>DA9 synaptic connections prune normally in post-dauer adult hermaphrodites. Representative images shown Extended Data Fig.1a.
(d) Starvation in the L1 or L3 stages, but not L4, results in a failure of PHB>AVA and PHA>AVG to prune in males. Animals were starved for 24 hours (12 hours of starvation was insufficient to affect male-specific pruning). Center is mean number of synaptic puncta, error bars show standard deviation. “No starvation” shows progeny of starved animals as control. n=number of animals, shown above each data point.
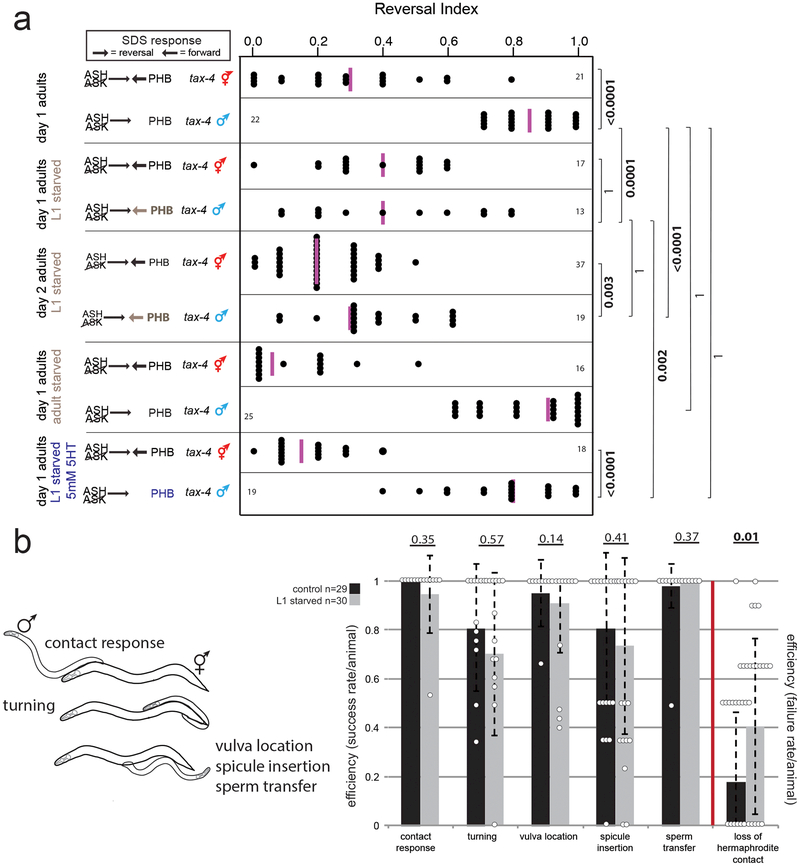
The PHB phasmid sensory neurons modulate the avoidance response to noxious chemicals (e.g. SDS) via synapses onto the AVA command interneurons in juvenile animals of both sexes, as well as adult hermaphrodites; in adult males, pruning of the PHB>AVA synaptic contacts eliminates this behavioral output 4,5. Juvenile-starved adult males retain the ability to respond to SDS, as predicted by the failure to prune PHB>AVA (Fig.2a). In contrast, males starved during adulthood (after pruning had already occurred) do not show any change in SDS avoidance behavior (“adult starved,” Fig.2a), consistent with normal PHB>AVA pruning. Thus, a starvation experience allows males to retain juvenile sensory acuity, and results in the loss of an adult behavioral sexual dimorphism. However, maintenance of juvenile sensory acuity affects other behaviors in the adult male. Adult males differ from adult hermaphrodites in that they search for, and mate with, hermaphrodites 6,7. Following juvenile starvation, males display a defect in maintaining contact with hermaphrodites during mating, a phenotype previously associated with AVA ablation (the command interneuron postsynaptic to both PHA and PHB)8 (Fig.2b, Extended Data Fig.2b). Overall, adverse juvenile experience prevents male-specific synaptic pruning and increases noxious sensory responsiveness, but also decreases male mating efficiency.
Fig.2: Juvenile starvation in males results in aberrant maintenance of juvenile behavior.
(a) Males show enhanced chemosensory avoidance behavior following L1 starvation. Left panel shows predicted synaptic input into avoidance behavior1,5. All experiments used tax-4 (p678) mutants to disable amphid input, as previously described5. Control animals are non-starved siblings of starved animals. Each dot represents the reversal index of one animal over 10 experimental trials, vertical magenta bar is median. n=number of animals, shown in panel a,b. p-values shown by two-sided Wilcoxon rank-sum test with Bonferroni corrections for multiple testing (where applicable; see Methods) and 95% confidence intervals. Neither L1-starved nor continuously-fed adult males change between adulthood days 1 and 2 (Extended Data Fig.2a).
(b) Males show mating defects. Each step of mating (schematized left) was scored in adult males following L1 starvation (grey bars) and compared to progeny of the starved generation (black bars). For behaviors left of the red bar, efficiency is success rate/animal. For “loss of hermaphrodite contact”, efficiency is failure rate/animal. Error bars show standard deviation, center bar shows mean. Each dot represents one animal (overlapping points graphically omitted). p-values shown by two-sided Wilcoxon rank-sum test.
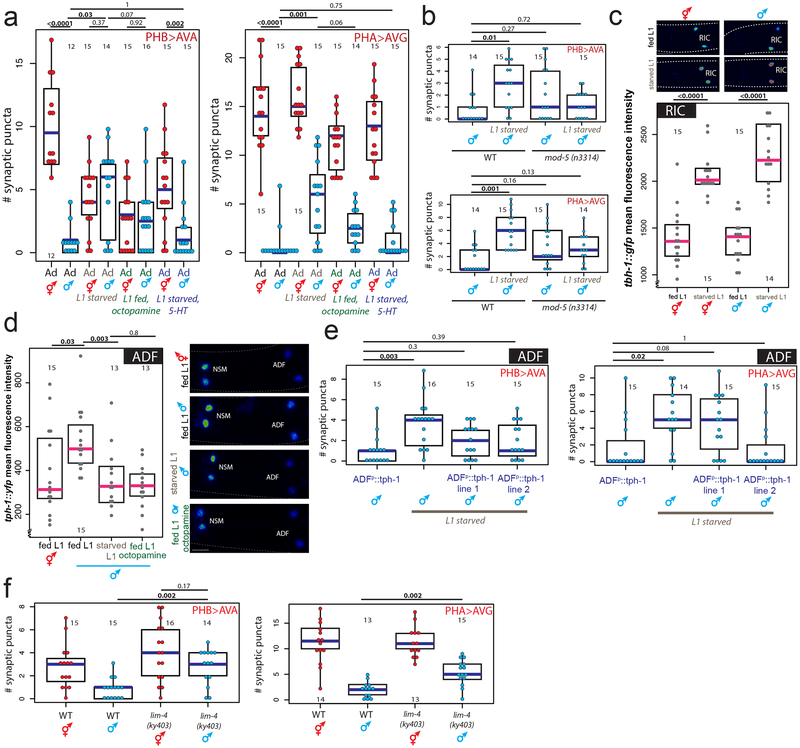
In C. elegans, several feeding-dependent behaviors such as locomotion and aversive memory are known to be modulated by the monoamines serotonin and octopamine, wherein serotonin signals well-fed conditions (similar to vertebrates) and octopamine (similar to norepinephrine in vertebrates9) signals starvation10,11. To investigate whether monoamine signaling regulates male-specific synaptic pruning, we supplemented well-fed animals with exogenous octopamine during the L1 stage and found that this indeed mimicked starvation, suppressing male-specific synaptic pruning of the PHB>AVA and PHA>AVG connections (Fig.3a, Extended Data Fig.3a). Conversely, starving L1 animals in the presence of exogenous serotonin fully rescued male pruning of the PHB>AVA and PHA>AVG connections, in addition to restoring the SDS avoidance behavioral dimorphism (Fig.2a,3a). Consistent with this result, pruning was also rescued in males that were starved in the presence of the selective serotonin reuptake inhibitor fluoxetine or in mod-5/SERT mutants, both known to increase extracellular serotonin 12 (Fig.3b, Extended Data Fig.3b,c). No pruning defects were observed in males defective for dopamine production (Extended Data Fig.3d).
Fig.3: Serotonin and octopamine convey feeding and starvation signals via the ADF neurons.
(a) Octopamine and 5-HT (serotonin) mimic starvation and feeding, respectively. Quantification of PHB>AVA and PHA>AVG synaptic connectivity in adults of both sexes using GRASP or iBLINC (a, b, e, f).. Each dot represents the number of synaptic puncta in one animal, blue bars median, black boxes quartiles, vertical black lines range (a, b, e, f). n=number of animals, shown in each column (a, b, c, d, e, f). p-values shown by two-sided Wilcoxon rank-sum test with Bonferroni corrections (where applicable; see Methods) for multiple testing (a, b, c, d, e, f). Representative images shown Extended Data Fig.3a.
(b) mod-5 mutants rescue pruning defects in PHB>AVA and PHA>AVG connections in L1-starved adult males. Representative images shown Extended Data Fig.3c.
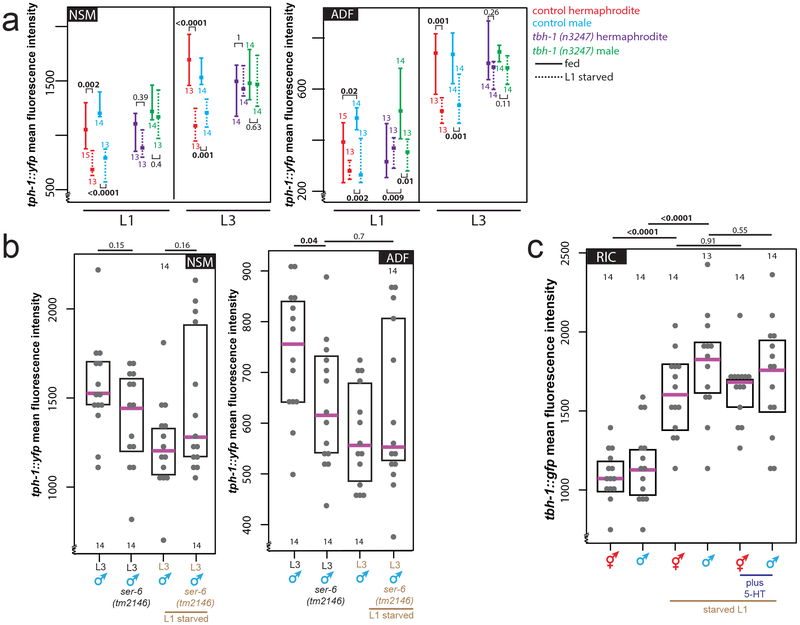
(c) Starvation induces octopamine production. Expression levels of a tbh-1 reporter in RIC in fed or starved L1 animals. Heat-map rendered fluorescence intensity images above, quantification below. Scale bars, 10μm, all panels. Magenta bar median, black boxes quartiles (c,d). Anterior left, dorsal up in all figures.
(d) tph-1 transcription in the ADF neurons is increased in males and decreased by starvation or exogenous octopamine. Expression levels of a tph-1 transcriptional fosmid in ADF in fed L1 animals, starved L1 animals, or L1 animals fed in the presence exogenous octopamine.
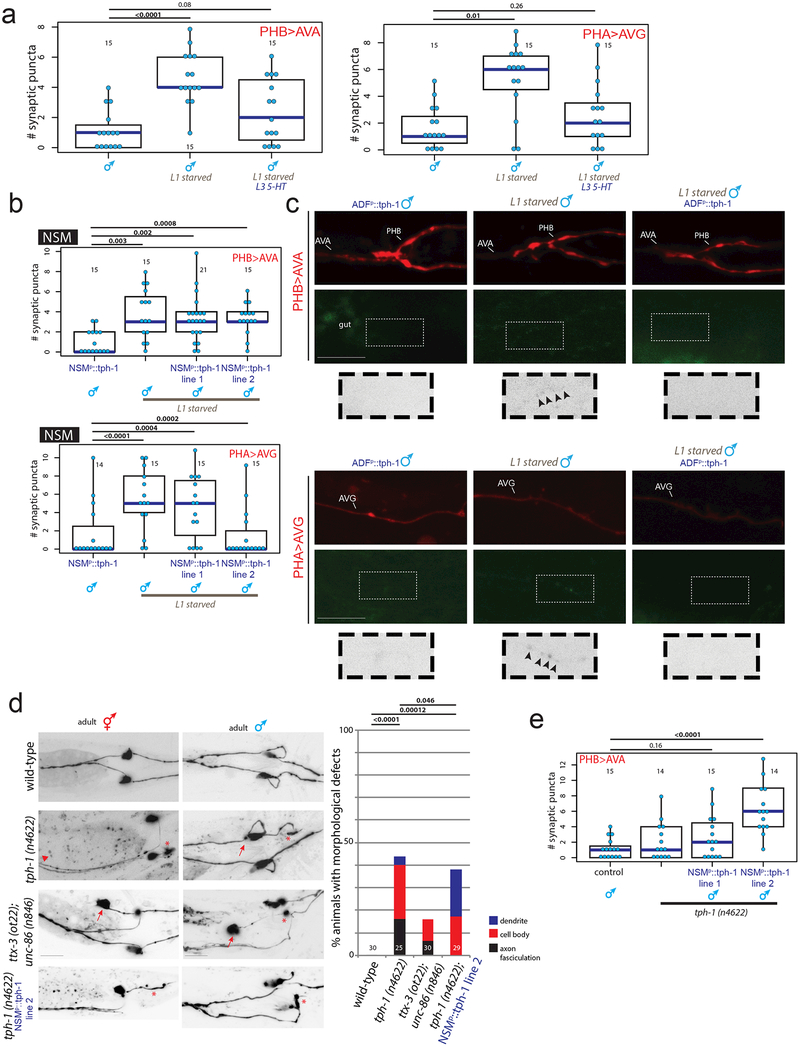
(e) tph-1 overexpression in ADF mimics the rescuing effect of exogenous 5HT. Quantification of PHB>AVA and PHA>AVG synaptic connectivity using GRASP and iBLINC. Two independent transgenic lines were tested for each experiment, L1 starved animals without transgenic lines are siblings of transgenic animals, controls are non-starved adult males with transgenic arrays. Representative images shown Extended Data Fig.6c.
(f) Genetic ablation of ADF results in failure to prune. Quantification of PHB>AVA and PHA>AVG synaptic connectivity in both sexes in lim-4 mutants24.
The effects of exogenous octopamine and serotonin on pruning suggest a role for monoamine signaling in regulating male-specific synaptic pruning but do not address requirement of endogenous octopamine and serotonin. Therefore, we examined expression levels of the rate-limiting enzymes of octopamine and serotonin synthesis. In larval C. elegans, octopamine is produced exclusively in the sex-shared RIC interneuron class by tyramine-β-hydroxylase (tbh-1) 13. Consistent with our results with exogenous octopamine treatment, starvation at either the adult 14 or L1 stage (Fig.3c) increases transcription of tbh-1 (Fig.3c, Extended Data Fig 4a). The expression of the serotonin-synthesizing enzyme tryptophan hydroxylase (tph-1), is also dependent on starvation, at least in adult animals 15, with an octopamine receptor conveying the starvation signal16. At the first larval stage, tph-1 is exclusively expressed in two sex-shared classes of serotonin-producing neurons, the bilateral NSM and ADF neuron pairs15. Under well-fed conditions, a tph-1 fosmid reporter was dimorphically expressed in both NSM and ADF, with L1 males showing higher levels of expression than hermaphrodites (Fig.3d, Extended Data Fig.4b). Upon L1 starvation, tph-1 expression acutely decreases in male ADF, but not NSM, neurons (Fig.3d, Extended Data Fig.4b). Addition of exogenous octopamine to otherwise well-fed animals mimicked the effect of starvation on tph-1 transcription in male ADF neurons (Fig.3d), whereas the addition of tyramine did not (Extended Data Fig.4c). Confirming the effects observed with a tph-1 reporter transgene, single molecule fluorescent in situ hybridization (smFISH) of endogenous tph-1 mRNA also revealed sexually dimorphic expression in ADF, as well as its transcriptional decrease following L1 starvation (and a lack of tph-1 downregulation in NSM) (Extended Data Fig.4d).
Unlike the upregulation of the octopamine producing tbh-1 gene, downregulation of tph-1 reporter expression persisted even after animals were returned to food (Extended Data Fig.4a,e). Furthermore, in continuously-fed animals, tph-1 expression peaks during the L3 stage in both sexes (the onset of sexual maturation), while tbh-1 expression is unchanged over the course of development (Extended Data Fig.4a,e). Strikingly, this upregulation never occurs in L1-starved animals, and this starvation memory is dependent on tbh-1 and thus, octopamine production (Extended Data Fig.5a). We also observed decreased tph-1 transcription in ADF but not NSM during the L3 stage in SER-6 octopamine receptor mutants, corroborating the relevance of octopamine signaling for regulating serotonin levels during sexual maturation (Extended Data Fig.5b). Conversely, exogenous serotonin did not suppress the tbh-1 upregulation (Extended Data Fig.5c). Demonstrating the functional relevance of persistent serotonin downregulation, male-specific pruning defects in L1-starved animals were rescued by supplementing with exogenous serotonin during the L3 stage (after the animals had been returned to food; Extended Data Fig.6a). We conclude that a temporary increase in starvation-induced octopamine production triggers a long-term alteration in serotonin production.
To further examine whether levels of serotonin production in the sex-shared ADF neuron regulate sex-specific synaptic pruning during male sexual maturation, we also used neuron-specific promoters to overexpress tph-1 in NSM or ADF during L1 starvation. tph-1 overexpression in ADF, but not in NSM, rescued sex-specific pruning of PHB>AVA and PHA>AVG in males that had been starved (Fig.3e, Extended Data Fig.6b,c). Through selective removal of serotonin production from either NSM or ADF neurons (using cell-specific tph-1 mutant rescue experiments and genetic elimination of either NSM or ADF; Fig.3f, Extended Data Fig.6d,e), we found that serotonin production specifically in ADF is not only sufficient but required to modulate neuronal male-specific synaptic maturation. This analysis also revealed an earlier role of NSM-secreted serotonin in phasmid neuron migration and morphology (Extended Data Fig.6d).
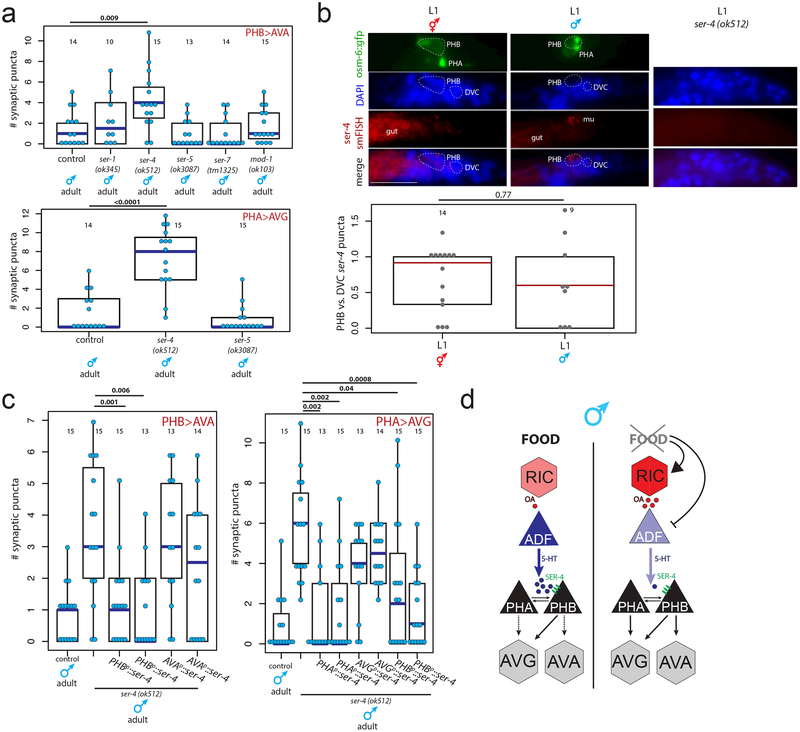
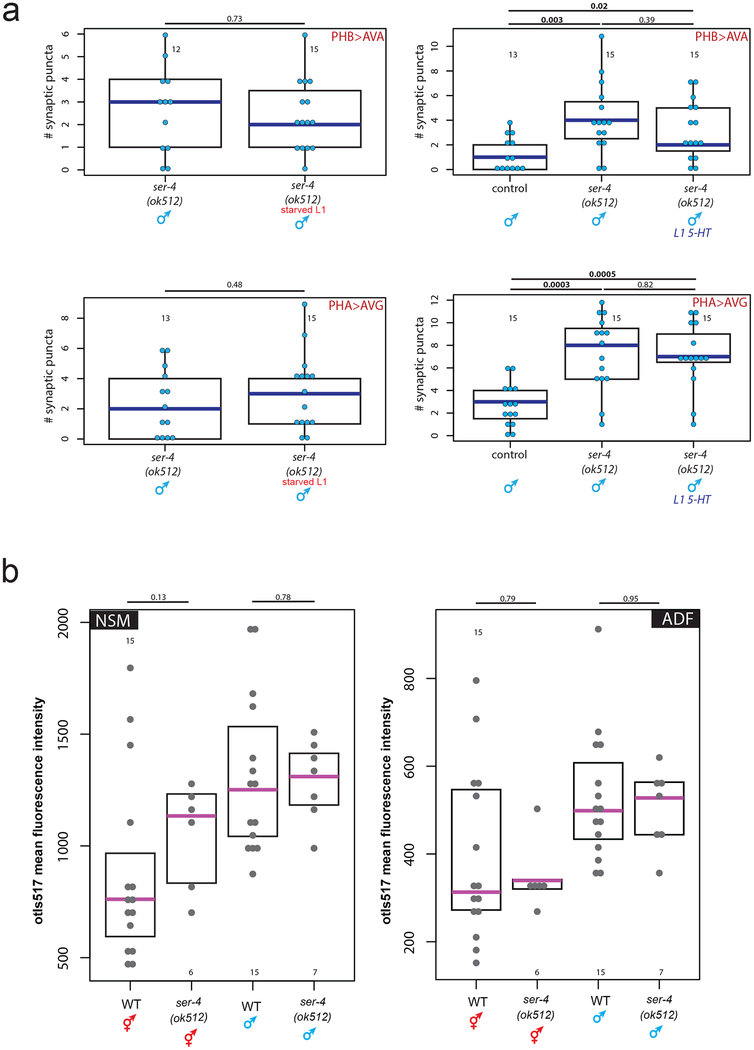
To ask how serotonin signals from the ADF head neurons to the phasmid>interneuron connections in the tail, we analyzed PHA>AVG and/or PHB>AVA connectivity in males mutant for each of the four metabotropic serotonin receptors in C. elegans17,18. In well-fed males lacking the ser-4/5HT1A receptor, juvenile synaptic connectivity was maintained, phenocopying juvenile starvation (Fig.4a, Extended Data Fig.7a). This phenotype was neither enhanced by juvenile starvation nor rescued by exogenous serotonin in ser-4 mutants, suggesting that the ser-4 serotonin receptor acts directly and non-redundantly downstream of the feeding cue (Extended Data Fig.8a). Furthermore, tph-1 transcription levels were unaffected in the ser-4 mutant, confirming that ser-4 does not feed back onto serotonin production itself (Extended Data Fig.8b).
Fig.4: The ser-4/5HT1A serotonin receptor acts downstream of the feeding signal.
(a) Quantification of PHB>AVA and PHA>AVG synaptic connectivity in adult males mutant for serotonin receptors. Each dot represents one animal, blue bar represents median, black box represents quartiles, vertical black bars represent range (a, c). n=number of animals, shown in each column (a, b, c). p-values shown by two-sided Wilcoxon rank-sum test with Bonferroni corrections for multiple testing (where applicable, see Methods) (a, b, c).
(b) ser-4 smFISH puncta are present in PHB in both sexes at L1. Maximum intensity projections of one half of each animal are shown for ser-4 smFISH and DAPI panels, the center slice from the stacks is shown in the GFP panel. “merge” shows overlay of ser-4 smFISH onto DAPI. Each grey dot represents normalized ser-4 smFISH puncta in one PHB neuron, red bar indicates median, box indicates quartiles. Higher magnification individual z-slices are shown in Extended Data Figure 7b.
(c) Expression of ser-4 cDNA in PHB or PHA rescues the PHB>AVA and PHA>AVG pruning defects, respectively. Two independent transgenic lines were evaluated for each promoter.
(d) Summary.
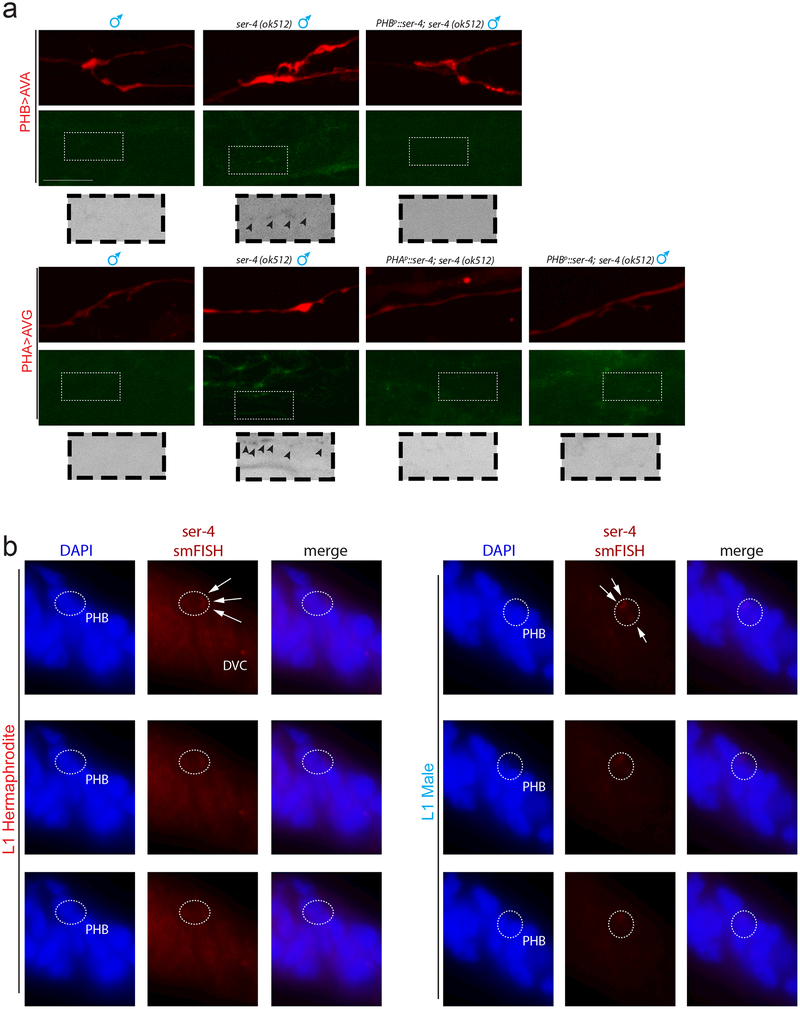
In both C. elegans and vertebrates, ser-4/5HT1A responds to extrasynaptic serotonergic signaling 19,20, raising the possibility that serotonin from ADF might directly modulate phasmid connectivity. Using smFISH probes against the ser-4 mRNA, we identified ser-4 transcripts in several neurons, including PHB but not PHA neurons, and detected no signals in ser-4 mutants (confirming probe specificity) (Fig.4b, Extended Data Fig.7b). To determine whether ser-4 exerts its role neuron-autonomously within the phasmid sensory circuit, we performed cell-specific rescue experiments. We found that AVA-driven ser-4 was unable to rescue PHB>AVA pruning in ser-4 mutants but expressing ser-4 in PHB rescued the pruning defect, consistent with a cell-autonomous function (Fig.4c, Extended Data Fig.7a).
Serotonin signaling can also act cell non-autonomously in the phasmids to modulate synaptic pruning. Specifically, we found that PHB-expressed ser-4 rescued pruning of the PHA>AVG connection (Fig.4c, Extended Data Fig.7a). Moreover, although we found that ser-4 is expressed in the PHB but not PHA neurons, expression of ser-4 in PHA rescued the PHA>AVG pruning defect (Fig.4c, Extended Data Fig.7a). The extensive, male-specific gap junctional connections of the PHA and PHB neurons 3,4 may allow PHA and PHB to readily cross-communicate a signal from a serotonin receptor.
Early-life stress is known to have long-lasting effects in vertebrates 21, also involving serotonin signaling 22. For example, prenatal stress in mouse models for human serotonin transporter variants affects adult memory, anxiety, and depressive-like behavior 23. Yet while both behavioral effects and some molecular effects of early-life stress in vertebrates have been identified, it has been difficult to link specific molecular changes to corresponding behavioral outcomes, a notion further confounded by complex contributions of genetic background 22. Here we show that a juvenile starvation stress results in lasting circuit and behavioral effects in adult male, but not hermaphrodite, C. elegans by affecting serotonin levels during sexual maturation (Fig.4d). We find that serotonin normally signals extrasynaptically to act as a cue for male-specific synaptic pruning. This provides insight into both how temporary early-life stress can result in specific lasting changes to the nervous system and how stress can intersect with sexual maturation and result in differential effects between the two sexes, a feature that has also been observed in vertebrate models 21,22. We anticipate that still-unknown genetic components underlying the many differences in sexual maturation between the two sexes of both C. elegans and vertebrates will shed light on the sexually differential sensitivity to juvenile starvation and other early-life stress.
METHODS
Strains
Wild-type strains were C. elegans variety Bristol, strain N2. Worms were maintained by standard methods25. Worms were grown at 20oC on nematode growth media (NGM) plates seeded with bacteria (E.coli OP50) as a food source. GRASP and iBLINC reagents are previously published 1,26,27. A detailed list of all mutant and transgenic strains used is available in Supplementary Table 1.
Cloning and constructs
To generate pEAB42 (srg-13p::ser-4::SL2::tagRFP), ser-4 cDNA was amplified off of pEAB69 (ser-4 cDNA in pUC57) and inserted into pEAB6 (srg-13p::fem-3::SL2::tagRFP) using Restriction-Free (RF) cloning to replace the fem-3 cDNA. To generate pEAB43 (gpa-6p::ser-4::SL2::tagRFP), pEAB59 (flp-18p::ser-4::SL2::tagRFP), and pEAB60 (inx-18p::ser-4::SL2::tagRFP), the srg-13 promoter was digested out of the SphI/XmaI sites of pEAB42 and each promoter was ligated in (from pEAB1 (2.2kb upstream of srg-13 fused to wCherry), pEAB3 (2.6kb of the gpa-6 promoter fused to GFP), pEAB10 (3.1kb of the flp-18 promoter fused to GFP), and pMO10 (intron 2 of inx-18 with the AIY enhancer site deleted1 fused to wCherry).
pKA805 (psrh-142::tph-1::GFP) and pKA807 (pceh-2::tph-1::GFP) were kind gifts from Kaveh Ashrafi.
Microscopy
Worms were anesthetized using 100mM of sodium azide (NaN3) and mounted on 5% agar on glass slides. Worms were analyzed by Nomarski optics and fluorescence microscopy, using a Zeiss 880 confocal laser-scanning microscope. Multidimensional data was reconstructed as maximum intensity projections using Zeiss Zen software. For GRASP experiments, animals were imaged using 63× objective and puncta were quantified by scanning the original full Z-stack for distinct dots in the area where the processes of the two neurons overlap. GRASP experiments were scored blinded to genotype for mutant analysis and rescue array analysis, and experimental condition for starvation, heat stress, hyperosmotic stress, and serotonin rescue experiments. For fluorescence intensity experiments, animals were imaged using 40× objective with fixed imaging settings, and quantification was performed using the Zeiss Zen software by measuring the mean fluorescent intensity of the neuronal cell body in the center Z-slice of each neuron, and then averaging the intensity of the left and right neurons of each pair to control for differences based on Z-position. Sex of L1 animals was determined using rectal epithelial cell morphology and/or coelomocyte position.
Figure preparation
Plots for GRASP and expression data were generated in R using the beeswarm package. Figures were prepared using Adobe Photoshop CS6 and Adobe Illustrator CS6.
Statistics and Reproducibility
Two-tailed Wilcoxon rank-sum tests were performed in R in addition to post-hoc Bonferroni corrections to adjust p-values for number of pairwise tests in all cases where more than two pairwise statistical tests were performed. Freeman-Halton extension of one-sided Fisher exact tests were performed for the categorical data in Extended Figure 6d. All experiments were repeated independently (technical replicates) a minimum of two times with similar results; any case where replication failed is indicated in the corresponding figure legend. Within each figure, all datasets contain only representative biological replicates.
No statistical method was used to determine sample size, and animals were not randomized into trial groups.
Starvation and neurotransmitter assays
L1 starvation assays were performed by plating a synchronized population of embryos (following hypochlorite treatment of gravid adults) onto unseeded NGM and allowing 12 hours at 20C for embryo hatching, followed by 24 hours at 20C for starvation (unless otherwise noted) before transfer onto seeded NGM by washing L1 animals using M9 buffer. Later starvation assays (L3, L4, adult) were performed by washing synchronized populations grown at 20C off seeded NGM plates using M9 buffer, performing at least 3 washes in M9 at 510rcf to remove OP50, and then plating animals on NGM plates without bacto-peptone to prevent the growth of any residual OP50 for 24 hours before transfer back to seeded NGM.
For neurotransmitter assays, all drugs were mixed into NGM media (for serotonin starvation assays, without bacto-peptone) before pouring to a final concentration of 20mg/mL (octopamine), 5mM (serotonin), 5mM (tyramine) or 0.1mg/mL (fluoxetine). Drugs used were 5-hydroxytryptamine hydrochloride (Sigma-Aldrich catalog #H9523), (1)-octopamine hydrochloride (Sigma-Aldrich catalog #O0250), tyramine hydrochloride (Sigma-Aldrich catalog #T2879), and Fluoxetine Hydrochloride, USP (Spectrum Chemical catalog # F1200). L1 animals were synchronized onto drug-containing plates identically to starvation assays (above) and then transferred onto plain seeded NGM plates 24 hours post-hatching.
L1 heat stress assay
Heat stress assays were performed by transferring synchronized, well-fed L1 animals (6 hours post-hatching) to a 35C incubator for 30 minutes, and then recovering plates at 20C until adulthood.
L1 osmotic stress assay
Hyperosmotic stress assays were performed by growing L1 animals on plates containing 200mM of NaCl for 24 hours after hatching (in the continuous presence of food) and then transferring animals to standard NGM plates until adulthood.
SDS-avoidance behavior
SDS avoidance assay was based on procedures described5. A small drop of solution containing either the repellent (0.1% SDS in M13 buffer) or buffer (M13 buffer: 30 mM Tris-HCl pH 7.0, 100 mM NaCl, 10 mM KCl) is delivered near the tail of an animal while it moves forward. Once in contact with the tail, the drop surrounds the entire animal by capillary action and reaches the anterior amphid sensory organs. Drop was delivered using 10 uL glass calibrated pipets (VWR international) pulled by hand on a flame to reduce the diameter of the tip. The capillary pipette was mounted in a holder with rubber tubing and operated by mouth. Assayed worms were transferred individually to fresh non-wet unseeded NGM plates. Each assay started with testing the animals with drops of M13 buffer alone. The response to each drop was scored as reversing or not reversing. The avoidance index is the number of reversal responses divided by the total number of trials. An Inter Stimuli Interval of at least two minutes was used between successive drops to the same animal. Each animal was tested 10 times, and all animals that survived all 10 trials were included in the datasets. Two biological and technical replicates were performed for each experiment. Each replicate began with n=40 animals for each condition.
Mate-searching behavior
Male-leaving assay was based on procedures described6. Males were separated from hermaphrodites at the L4 stage and transferred to assay plates 24 hours later. Assays were performed on NGM plates (5cm diameter) and seeded with 20uL of OP50 to create a small lawn that was allowed to grow overnight. Distance from the lawn was recorded every 3 hours over a total assay period of 12 hours, and then mean distance from the lawn was calculated for each assayed male. Two biological and technical replicates were performed for each experiment.
Mating behavior assays
Mating assays were based on procedures described7. Males were picked at the L4 stage and kept apart from hermaphrodites for 24 hours, either following 24 hours of starvation during L1. One male was transferred to a plate covered with a thin fresh OP50 lawn containing 10–15 adult unc-31(e928) hermaphrodites. These hermaphrodites move very little, allowing for an easy recording of male behavior. Hermaphrodites were also isolated from opposite sex at the L4 stage and used 24 hours later, and were always well-fed. Animals were monitored and sequence of events was recorded within a 10 min window or until the male ejaculated, whichever occurred first. Males were digitally recorded using the Exo Labs model 1 camera mounted on Nikon Eclipse E400 compound microscope with long-distance X20 lenses. % efficiency (per mating behavior step)=100×(the number of successful performances of mating behavior step/the number of times the male attempted the mating behavior step). % loss of hermaphrodite contact=100×(the number of times male lost contact with hermaphrodite and eventually re-initiated the mating sequence/the number of hermaphrodites the male contacted during assay). Two biological and technical replicates were performed for each experiment.
Single molecule fluorescent in situ hybridization (smFISH)
smFISH was performed as previously described28. Briefly, L1 larvae (6 hr post-hatching on food for control or 24 hr starved for “L1 starved”) were washed off NGM, fixed (4% PFA) for 45min at room temperature. Fixed worms were washed twice with PBS, resuspended in 70% ethanol, and incubated two overnights at 4C. The fixed sample was centrifuged and incubated with wash buffer for 5 min. After wash buffer was removed, hybridization buffer containing the ser-4 or tph-1 and ric-4 probes (designed using the Stellaris RNA FISH probe, ser-4 and tph-1 conjugated to CalFluor 590, ric-4 conjugated to Quasar 670, from Biosearch Technologies) was added to the sample. The sample was incubated overnight at 37C. The sample was subsequently incubated in wash buffer with DAPI for 30 min at 37C protected from light. The sample suspended in 2× SSC and then resuspended in GLOX buffer for 2 min. The sample was then resuspended in the GLOX buffer to which the glucose oxidase were added. The sample was then mounted and imaged immediately. Images were acquired using an automated fluorescence microscope (Zeiss, AXIO Imager Z.2) with a 63× objective. Acquisition of Z-stack images (each slice 0.3 microns thick) was performed with the ZEN 2 pro software. Representative images are shown following max-projection of Z-stacks in the Zeiss Zen software. Puncta were quantified by scanning through the Z-slices sequentially in Zeiss Zen software. Each staining experiment was performed with two biological and technical replicates.
For ser-4 smFISH, osm-6::gfp (oyIs59) labels all ciliated sensory neurons and was used to identify the phasmid neurons. Identification of DVC and anal depressor muscle (“mu”) was based on a previously published ser-4 transcriptional reporter19. Number of smFISH puncta in one PHB neuron was normalized to number of puncta in DVC (in the same animal) to control for staining fluctuations.
For tph-1 smFISH, NSM and ADF neurons were identified by their stereotyped position and smFISH puncta colocalizing with the DAPI-stained nuclei were quantified.
Data Availability Statement
The data that support the findings of this study are available from the corresponding author upon reasonable request.
Extended Data
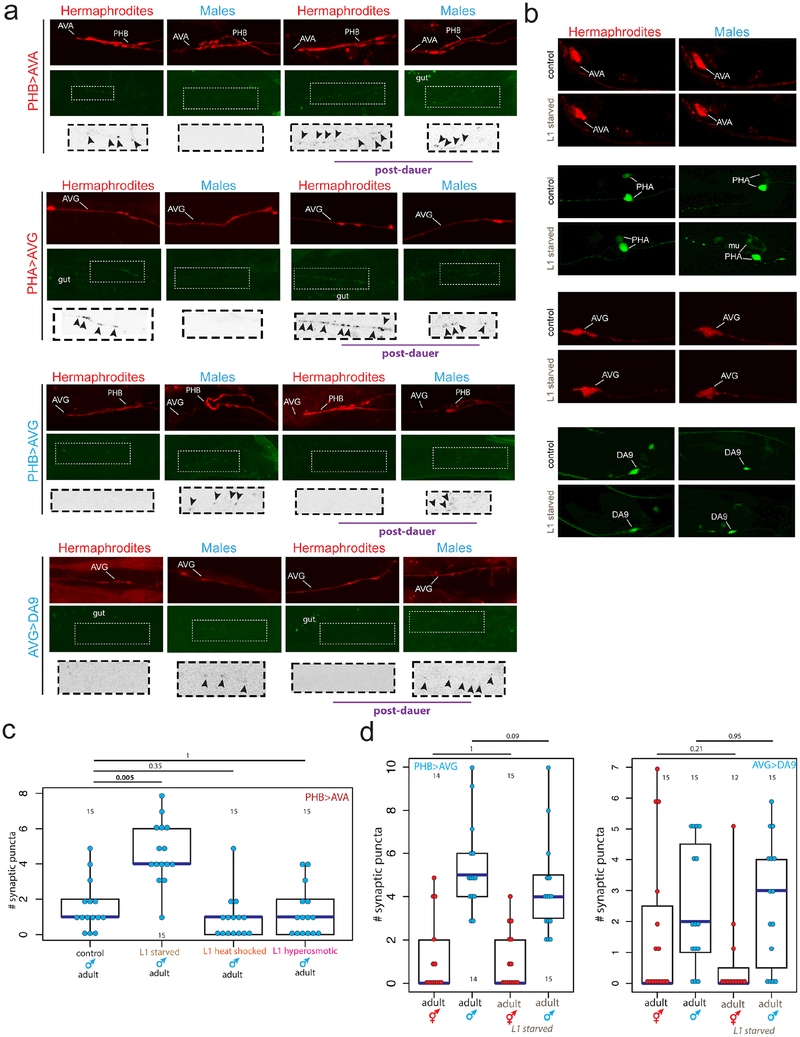
Extended Data Figure 1: Trans-synaptic labeling by GRASP.
(a) The normally hermaphrodite-specific PHB>AVA and PHA>AVG synaptic connections fail to prune in post-dauer adult males, while the normally male-specific PHB>AVG and AVG>DA9 connections are pruned in post-dauer adult hermaphrodites. Top panel shows red cytoplasmic axon label, middle panel shows GRASP (PHB>AVA, PHB>AVG, AVG>DA9) or iBLINC signal (PHA>AVG), bottom panel shows magnified inset of color-inverted synaptic puncta with arrowheads to indicate puncta. Intestinal auto-fluorescence is labeled “gut.” Representative images shown, for quantification and replication see Fig. 1b,c and Methods.
(b) Starvation does not affect expression of the cell-specific promoters used for GRASP, and thus the effects on synaptic pruning are not an artifact of changes in promoter expression. Representative maximum intensity projection images of control animals and animals recovered from 24 hours of L1 starvation are shown. mu=muscle (srg-13p is variably expressed in some muscle cells in addition to PHA).
(c) Neither L1 heat shock (30min at 35C) nor L1 osmotic stress (24 hours on plates with 200mM NaCl) affect the male-specific pruning of the PHB>AVA connection. Each dot represents one animal (red=hermaphrodite, cyan=male in all figures, n=number of animals, shown in each column), blue bars show median, black boxes represent quartiles, vertical black lines show range (c, d). p-values shown by two-sided Wilcoxon rank-sum test with Bonferroni corrections for multiple testing (where applicable; see Methods).
(d) L1 starvation does not affect the normally male-specific PHB>AVG and AVG>DA9 synapses. Control animals are the progeny of starved animals.
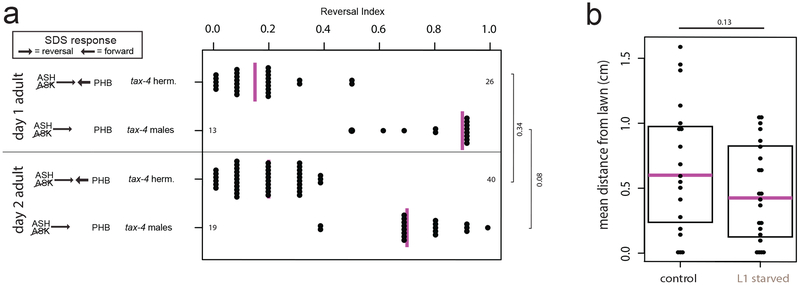
Extended Data Figure 2: Behaviors unaffected by starvation or additional adult development.
(a) SDS avoidance response is unchanged in day 2 adults. Left panel shows predicted synaptic input into avoidance behavior by relevant amphid and phasmid neurons1,5. Each dot represents the average reversal index of one animal over 10 experimental trials, median shown with vertical magenta bar. p-values shown by two-sided Wilcoxon rank-sum test.
(b) Male mate-searching behavior is unaffected following L1 starvation. Each dot represents the average distance one male traveled away from a bacterial lawn at four time points over 12 hours (n=48 animals control, 20 animals “L1 starved”), in the absence of hermaphrodites. Magenta bars indicate median, black boxes indicate quartiles. p-values shown by two-tailed t-test. In contrast, we did find mate-searching defects in adult males following recovery from dauer, suggesting that these males may have additional changes to the nervous system (data not shown).
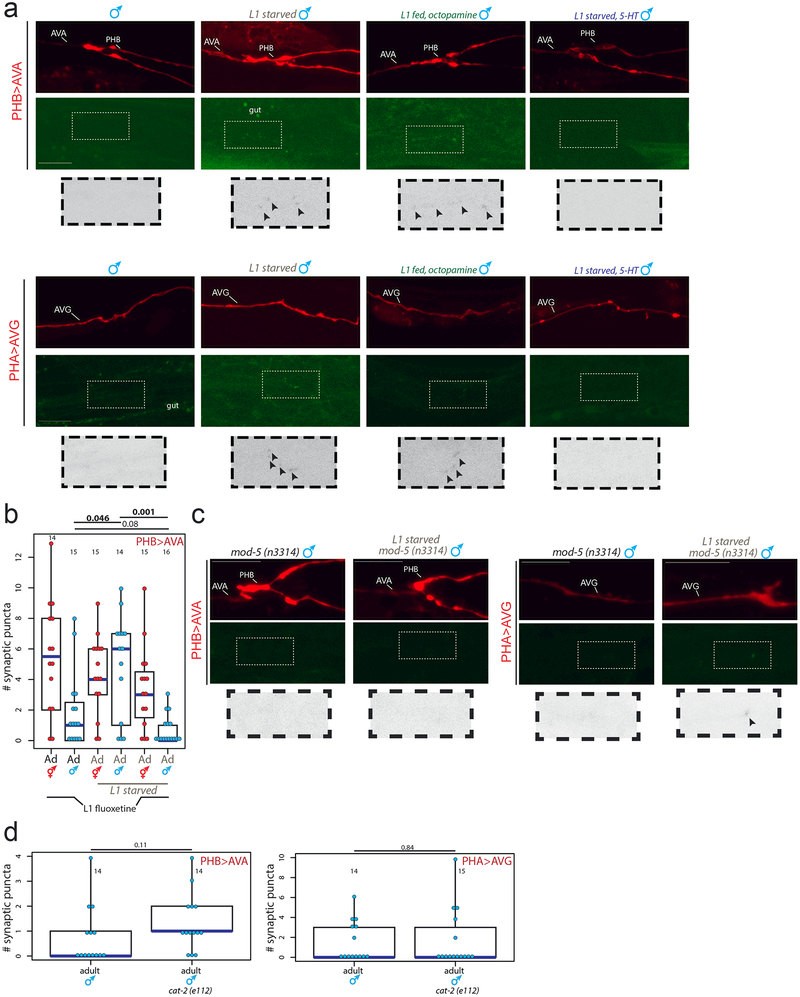
Extended Data Figure 3: Effects of starvation and exogenous or endogenous monoamine signaling on synaptic connectivity.
(a) The normally hermaphrodite-specific PHB>AVA and PHA>AVG synaptic connections fail to prune in adult males following L1 starvation or treatment with exogenous octopamine during L1, but can be rescued with exogenous serotonin during L1 starvation. Top panel shows red cytoplasmic axon label, middle panel shows GRASP (PHB>AVA) or iBLINC signal (PHA>AVG), bottom panel shows magnified inset of color-inverted synaptic puncta with arrowheads to indicate puncta. Scale bars, 10μm, all panels. Representative images shown, for quantification and replication see Fig. 3a and Methods.
(b) Increases in extrasynaptic 5HT through fluoxetine suppresses the failure to prune synapses. Quantification of PHB>AVA synaptic connectivity in adults following exposure to fluoxetine during L1 (on food), L1 starvation without fluoxetine, or L1 starvation in the presence of exogenous fluoxetine (0.1mg/mL). Each dot represents one animal (red=hermaphrodite, cyan=male in all figures, n=number of animals, shown in each column), blue bars show median, black boxes represent quartiles, vertical black lines show range (b, d). p-values shown by two-sided Wilcoxon rank-sum test with Bonferroni corrections for multiple testing (where applicable; see Methods).
(c) The effect of L1 starvation on male-specific synaptic pruning is rescued in the mod-5 mutant background. Representative images shown, for quantification and replication see Fig. 3b and Methods.
(d) Loss of dopamine production (in a mutant for the cat-2 tyrosine hydroxylase) has no effect on the pruning of the PHB>AVA and PHA>AVG connections in males.
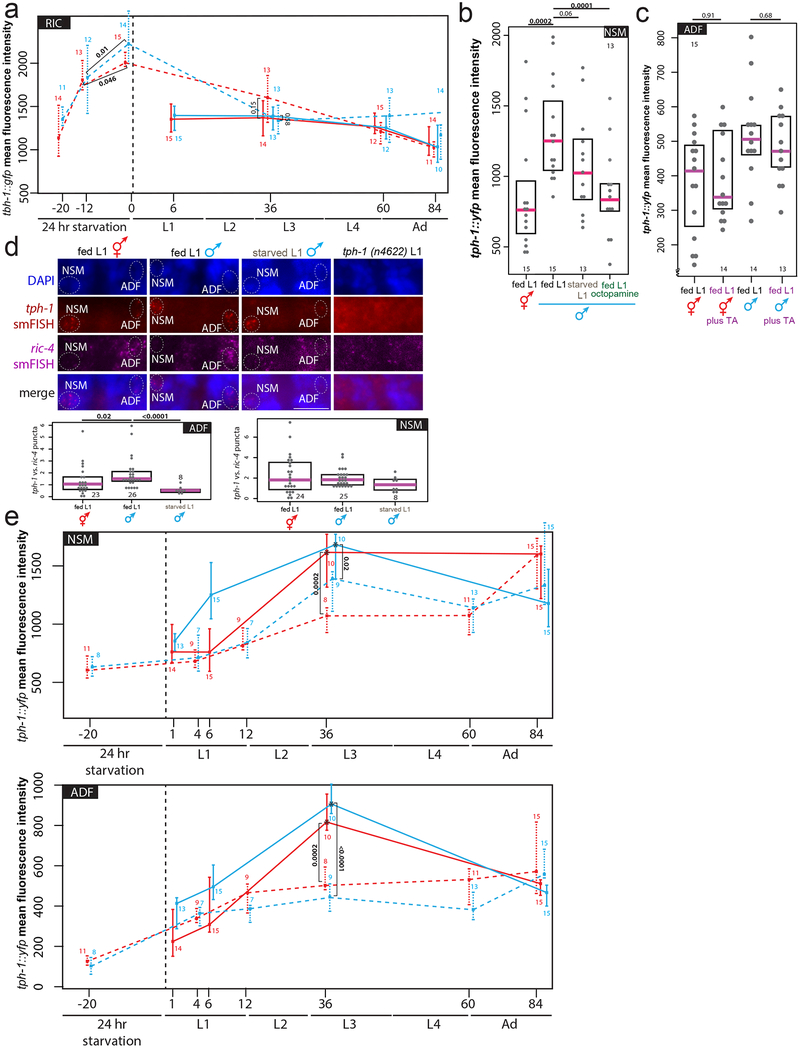
Extended Data Figure 4: Effects of starvation on tbh-1 and tph-1 transcription.
(a) Time-course of tbh-1 transcriptional levels in fed (solid lines) and L1-starved (dashed lines) animals. We note that tbh-1 levels are even higher after 24 hours of starvation vs. 12 hours of starvation, providing a molecular correlate for our observation that 12 hours of starvation is insufficient to affect male-specific synaptic pruning (Fig. 1d). Larval stages (and hours post-hatching for fed animals or post-transfer to food for starved animals at which imaging took place) shown on x-axis. Center indicates median, error bars indicate quartiles (a, e). p-values shown by two-sided Wilcoxon rank-sum test (a, b, c, d, e). n= number of animals (shown below data points for fed, above for L1-starved) (a, e).
(b) Expression levels of a tph-1 transcriptional fosmid in NSM in fed L1 animals, starved L1 animals, or L1 animals fed in the presence of 20mg/mL exogenous octopamine. Each grey dot represents averaged expression level in one animal. Magenta bar indicates median, black box represents quartiles (b, c, d). n= number of animals (shown in each column) (b, c, d).
(c) Expression levels of a tph-1 transcriptional fosmid are not affected in ADF or NSM neurons (NSM data not shown) by exogenous tyramine in fed L1 hermaphrodites and males. “TA”=tyramine.
(d) tph-1 transcript levels quantified by smFISH. Maximum intensity projection images of one half of animal to show one NSM and one ADF neuron. “merge” shows overlay of tph-1 smFISH puncta onto DAPI. Number of tph-1 smFISH puncta were normalized to number of ric-4/SNAP-25 synaptic protein smFISH puncta in the same neuron to control for staining fluctuations, each dot (n=) one neuron, shown in each column.
(e) Time-course of tph-1 transcriptional levels in fed (solid lines) and L1-starved (dashed lines) animals. Larval stages (and hours post-hatching for fed animals or post-transfer to food for starved animals at which imaging took place) shown on x-axis. Asterisks (fed L3 animals) indicate that animals were imaged at different laser settings (60% of all other time points) to prevent pixel oversaturation in images: thus, we under-estimate the magnitude of the L3 serotonin spike here.
Extended Data Figure 5: Serotonin is downregulated by starvation and functions downstream, but not upstream, of tbh-1 transcription.
(a) tbh-1 is not required for the initial downregulation of tph-1 transcription in ADF upon L1 starvation, but is required for the formation of the persistence of this downregulation into the L3 stage. Neither initial tph-1 downregulation nor a starvation memory were apparent in NSM in a tbh-1 null mutant. In well-fed conditions, there is no significant difference between control and tbh-1 mutant animals. Center indicates median, error bars indicate quartiles. Solid lines indicate continuously-fed animals, dashed lines indicate L1-starved animals. n= number of animals, shown in each column (a, b, c). p-values shown by two-sided Wilcoxon rank-sum test (a, b, c).
(b) The ser-6 octopamine receptor is required during sexual maturation to maintain tph-1 transcription levels in ADF but not NSM under well-fed conditions, and upon starvation tph-1 transcription levels in the ser-6 mutant do not further decrease, supporting the necessity of ser-6 for proper ADF starvation response. Magenta bar indicates median, black box represents quartiles (b,c).
(c) Upregulation of tbh-1 transcription upon L1 starvation is unaffected by the addition of exogenous serotonin (5mM), suggesting that serotonin does not act upstream of tbh-1 upregulation (and subsequent octopamine production).
Extended Data Figure 6: Regulation and neuronal migration effects of serotonin signaling.
(a) Effects of L1 starvation on male-specific synaptic pruning can also be rescued by exogenous serotonin during L3 (while animals are feeding). Each dot represents one adult male animal (n= number of animals, shown in each column), blue bar represents median, black box represents quartiles, vertical black bars represent range (a, b, e). p-values shown by two-sided Wilcoxon rank-sum test (a, b, e).
(b) tph-1 overexpression in NSM does not rescue starvation effects on pruning. Quantification of PHB>AVA and PHA>AVG synaptic connectivity in L1 starved adult males overexpressing tph-1 in NSM. Two independent transgenic lines were tested for each experiment, L1 starved animals without transgenic lines are siblings of transgenic animals, controls are non-starved adult males with transgenic arrays. None of the transgenic lines resulted in partial or complete rescue.
(c) Overexpression of tph-1 under an ADF-specific promoter during L1 starvation rescues the male-specific pruning of the PHB>AVA and PHA>AVG synaptic connections. Representative images shown, for quantification and replication see Fig. 3e and Methods.
(d) tph-1 (n4622) and ttx-3 (ot22); unc-86 (n846) mutants (in which the NSM neuron does not express tph-1 or produce serotonin29) have cell body displacement, dendrite, and axon fasciculation defects in the phasmids. Overexpression of tph-1 under an NSM-specific promoter in the tph-1 (n4622) mutant background rescues the severity and penetrance of these defects. Representative images of defects in the PHB neuron are shown here as inverted black and white fluorescence images. * indicates dendrite defect, arrow shows anteriorly shifted cell body, arrowhead shows fasciculation defect. Scale bars 10μm. Percent animals with visible defects categorized and quantified to the right, n= number of animals, shown in each column. p-values shown by Freeman-Halton extension of one-sided Fisher exact test.
(e) Overexpressing tph-1 under an NSM-specific promoter in the tph-1 (n4622) mutant background (essentially, an ADF-specific tph-1 null) results in male-specific PHB>AVA pruning defects. Of two independent NSM::tph-1 transgenic lines, one resulted in a slight but insignificant defect in pruning, and one resulted in a significant defect in pruning.
Extended Data Figure 7: ser-4 expression in PHB is permissive for synaptic pruning.
(a) The normally hermaphrodite-specific PHB>AVA and PHA>AVG synaptic connections fail to prune in ser-4 mutant males, but can be rescued by cell-specific expression of ser-4 cDNA in PHB or PHA. Top panel shows red cytoplasmic axon label, middle panel shows GRASP (PHB>AVA) or iBLINC signal (PHA>AVG), bottom panel shows magnified inset of color-inverted synaptic puncta with arrowheads to indicate puncta. Scale bars, 10μm, all panels. Representative images shown, for quantification and replication see Fig. 4c and Methods.
(b) ser-4 smFISH puncta are present in PHB in both sexes at L1. Three consecutive individual z-slices taken from the maximum intensity projections in Fig. 4b are shown, moving laterally through each animal from top to bottom rows. Dotted circles outline the PHB nuclei (DAPI) identified using osm-6::gfp (see Fig. 4b). Arrowheads in the top row indicate the location of ser-4 puncta, which fade out of focus as the slices progress laterally. For quantification and replication see Fig. 4b and Methods.
Extended Data Figure 8: ser-4 is necessary for PHB>AVA and PHA>AVG synaptic pruning and acts downstream of the ADF serotonin signal.
(a) Starvation does not enhance the male synaptic pruning defect in ser-4 mutants, and the ser-4 mutant phenotype cannot be rescued by exogenous serotonin. Each dot represents one animal (n= number of animals, shown in each column), blue bar represents median, black box represents quartiles, vertical black bars represent range. p-values shown by two-sided Wilcoxon rank-sum test (a, b).
(b) Expression levels of a tph-1 transcriptional fosmid in NSM and ADF in wild-type and ser-4 mutant L1 animals do not significantly differ. Each dot represents the expression level of one neuron, n= number of animals, shown in each column. Magenta bar indicates median, black box represents quartiles.
Supplementary Material
Acknowledgements:
We thank Qi Chen for generating transgenic strains, Kaveh Ashrafi for providing DNA constructs, the CGC (supported by the NIH P40 OD010440) for strains and members of the Hobert lab, Iva Greenwald, and Meital Oren-Suissa for comments on the manuscript. This work was supported by the HHMI and NIH (R37NS039996, OH, F31NS096863, EAB).
Footnotes
The authors declare no competing financial interests. Readers are welcome to comment on the online version of the paper.
References:
- 1.Oren-Suissa M, Bayer EA & Hobert O Sex-specific pruning of neuronal synapses in Caenorhabditis elegans. Nature 533, 206–211, doi: 10.1038/nature17977 (2016). [DOI] [PMC free article] [PubMed] [Google Scholar]
- 2.Barr MM, Garcia LR & Portman DS Sexual Dimorphism and Sex Differences in Caenorhabditis elegans Neuronal Development and Behavior. Genetics 208, 909–935, doi: 10.1534/genetics.117.300294 (2018). [DOI] [PMC free article] [PubMed] [Google Scholar]
- 3.White JG, Southgate E, Thomson JN & Brenner S The Structure of the Nervous System of the Nematode Caenorhabditis elegans. Philosophical Transactions of the Royal Society B: Biological Sciences 314, 1–340, doi: 10.1098/rstb.1986.0056 (1986). [DOI] [PubMed] [Google Scholar]
- 4.Jarrell TA et al. The connectome of a decision-making neural network. Science 337, 437–444, doi: 10.1126/science.1221762 (2012). [DOI] [PubMed] [Google Scholar]
- 5.Hilliard MA, Bargmann CI & Bazzicalupo PC elegans responds to chemical repellents by integrating sensory inputs from the head and the tail. Curr Biol 12, 730–734 (2002). [DOI] [PubMed] [Google Scholar]
- 6.Lipton J, Kleemann G, Ghosh R, Lints R & Emmons SW Mate searching in Caenorhabditis elegans: a genetic model for sex drive in a simple invertebrate. J Neurosci 24, 7427–7434, doi: 10.1523/JNEUROSCI.1746-04.2004 (2004). [DOI] [PMC free article] [PubMed] [Google Scholar]
- 7.Liu KS & Sternberg PW Sensory regulation of male mating behavior in Caenorhabditis elegans. Neuron 14, 79–89 (1995). [DOI] [PubMed] [Google Scholar]
- 8.Sherlekar AL et al. The C. elegans male exercises directional control during mating through cholinergic regulation of sex-shared command interneurons. PLoS One 8, e60597, doi: 10.1371/journal.pone.0060597 (2013). [DOI] [PMC free article] [PubMed] [Google Scholar]
- 9.Goldstein JL et al. Surviving starvation: essential role of the ghrelin-growth hormone axis. Cold Spring Harb Symp Quant Biol 76, 121–127, doi: 10.1101/sqb.2011.76.010447 (2011). [DOI] [PubMed] [Google Scholar]
- 10.Churgin MA, McCloskey RJ, Peters E & Fang-Yen C Antagonistic Serotonergic and Octopaminergic Neural Circuits Mediate Food-Dependent Locomotory Behavior in Caenorhabditis elegans. J Neurosci 37, 7811–7823, doi: 10.1523/JNEUROSCI.2636-16.2017 (2017). [DOI] [PMC free article] [PubMed] [Google Scholar]
- 11.Harris G et al. The monoaminergic modulation of sensory-mediated aversive responses in Caenorhabditis elegans requires glutamatergic/peptidergic cotransmission. J Neurosci 30, 7889–7899, doi: 10.1523/JNEUROSCI.0497-10.2010 (2010). [DOI] [PMC free article] [PubMed] [Google Scholar]
- 12.Jafari G, Xie Y, Kullyev A, Liang B & Sze JY Regulation of extrasynaptic 5-HT by serotonin reuptake transporter function in 5-HT-absorbing neurons underscores adaptation behavior in Caenorhabditis elegans. J Neurosci 31, 8948–8957, doi: 10.1523/JNEUROSCI.1692-11.2011 (2011). [DOI] [PMC free article] [PubMed] [Google Scholar]
- 13.Alkema MJ, Hunter-Ensor M, Ringstad N & Horvitz HR Tyramine Functions independently of octopamine in the Caenorhabditis elegans nervous system. Neuron 46, 247–260, doi: 10.1016/j.neuron.2005.02.024 (2005). [DOI] [PubMed] [Google Scholar]
- 14.Tao J, Ma YC, Yang ZS, Zou CG & Zhang KQ Octopamine connects nutrient cues to lipid metabolism upon nutrient deprivation. Sci Adv 2, e1501372, doi: 10.1126/sciadv.1501372 (2016). [DOI] [PMC free article] [PubMed] [Google Scholar]
- 15.Liang B, Moussaif M, Kuan CJ, Gargus JJ & Sze JY Serotonin targets the DAF-16/FOXO signaling pathway to modulate stress responses. Cell Metab 4, 429–440, doi: 10.1016/j.cmet.2006.11.004 (2006). [DOI] [PubMed] [Google Scholar]
- 16.Noble T, Stieglitz J & Srinivasan S An integrated serotonin and octopamine neuronal circuit directs the release of an endocrine signal to control C. elegans body fat. Cell Metab 18, 672–684, doi: 10.1016/j.cmet.2013.09.007 (2013). [DOI] [PMC free article] [PubMed] [Google Scholar]
- 17.Carre-Pierrat M et al. Characterization of the Caenorhabditis elegans G protein-coupled serotonin receptors. Invert Neurosci 6, 189–205, doi: 10.1007/s10158-006-0033-z (2006). [DOI] [PubMed] [Google Scholar]
- 18.Harris GP et al. Three distinct amine receptors operating at different levels within the locomotory circuit are each essential for the serotonergic modulation of chemosensation in Caenorhabditis elegans. J Neurosci 29, 1446–1456, doi: 10.1523/JNEUROSCI.4585-08.2009 (2009). [DOI] [PMC free article] [PubMed] [Google Scholar]
- 19.Gurel G, Gustafson MA, Pepper JS, Horvitz HR & Koelle MR Receptors and other signaling proteins required for serotonin control of locomotion in Caenorhabditis elegans. Genetics 192, 1359–1371, doi: 10.1534/genetics.112.142125 (2012). [DOI] [PMC free article] [PubMed] [Google Scholar]
- 20.Riad M et al. Somatodendritic localization of 5-HT1A and preterminal axonal localization of 5-HT1B serotonin receptors in adult rat brain. J Comp Neurol 417, 181–194 (2000). [PubMed] [Google Scholar]
- 21.Lajud N & Torner L Early life stress and hippocampal neurogenesis in the neonate: sexual dimorphism, long term consequences and possible mediators. Front Mol Neurosci 8, 3, doi: 10.3389/fnmol.2015.00003 (2015). [DOI] [PMC free article] [PubMed] [Google Scholar]
- 22.Houwing DJ, Buwalda B, van der Zee EA, de Boer SF & Olivier JDA The Serotonin Transporter and Early Life Stress: Translational Perspectives. Front Cell Neurosci 11, 117, doi: 10.3389/fncel.2017.00117 (2017). [DOI] [PMC free article] [PubMed] [Google Scholar]
- 23.van den Hove DL et al. Differential effects of prenatal stress in 5-Htt deficient mice: towards molecular mechanisms of gene x environment interactions. PLoS One 6, e22715, doi: 10.1371/journal.pone.0022715 (2011). [DOI] [PMC free article] [PubMed] [Google Scholar]
- 24.Zheng X, Chung S, Tanabe T & Sze JY Cell-type specific regulation of serotonergic identity by the C. elegans LIM-homeodomain factor LIM-4. Dev Biol 286, 618–628, doi: 10.1016/j.ydbio.2005.08.013 (2005). [DOI] [PubMed] [Google Scholar]
Methods References
- 25.Brenner S The genetics of Caenorhabditis elegans. Genetics 77, 71–94 (1974). [DOI] [PMC free article] [PubMed] [Google Scholar]
- 26.Feinberg EH et al. GFP Reconstitution Across Synaptic Partners (GRASP) defines cell contacts and synapses in living nervous systems. Neuron 57, 353–363, doi: 10.1016/j.neuron.2007.11.030 (2008). [DOI] [PubMed] [Google Scholar]
- 27.Desbois M, Cook SJ, Emmons SW & Bulow HE Directional Trans-Synaptic Labeling of Specific Neuronal Connections in Live Animals. Genetics 200, 697–705, doi: 10.1534/genetics.115.177006 (2015). [DOI] [PMC free article] [PubMed] [Google Scholar]
- 28.Ji N & van Oudenaarden A Single molecule fluorescent in situ hybridization (smFISH) of C. elegans worms and embryos. WormBook, 1–16, doi: 10.1895/wormbook.1.153.1 (2012). [DOI] [PMC free article] [PubMed] [Google Scholar]
Extended Data References
- 29.Zhang F et al. The LIM and POU homeobox genes ttx-3 and unc-86 act as terminal selectors in distinct cholinergic and serotonergic neuron types. [DOI] [PMC free article] [PubMed] [Google Scholar]
Associated Data
This section collects any data citations, data availability statements, or supplementary materials included in this article.
Supplementary Materials
Data Availability Statement
The data that support the findings of this study are available from the corresponding author upon reasonable request.


