

Abstract
Objectives
The purpose of this study was to analyze distortion product otoacoustic emission (DPOAE) level and signal-to-noise ratio (SNR) in a group of infants from birth to 4 months of age to optimize prediction of hearing status. DPOAEs from infants with normal hearing (NH) and hearing loss were used to predict the presence of conductive hearing loss (CHL), sensorineural hearing loss (SNHL), and mixed hearing loss (MHL). Wideband ambient absorbance was also measured and compared among the hearing loss types.
Design
Prospective, longitudinal study of 279 infants with verified normal hearing and hearing loss, including conductive, sensorineural and mixed types that were enrolled from a well-baby nursery (WBN) and two neonatal intensive care units (NICU) in Cincinnati, Ohio. At approximately 1 month of age, DPOAEs (1-8 kHz), wideband absorbance (0.25-8 kHz) and air- and bone-conduction diagnostic tone-burst auditory brainstem response (ABR; 0.5-4 kHz) thresholds were measured. Hearing status was verified at approximately 9 months of age with visual reinforcement audiometry (VRA; 0.5 – 4 kHz). ABR air-conduction thresholds were used to assign infants to a NH or hearing loss (HL) group, and the efficacy of DPOAE data to classify ears as NH or hearing loss was analyzed using receiver operating characteristic (ROC) curves. Two summary statistics of the ROC curve were calculated: the area under the ROC curve (AUC), and the point of symmetry (SYM) on the curve at which the sensitivity and specificity were equal. DPOAE level and SNR cut-off values were defined at each frequency as the SYM point on their respective ROC curve, and DPOAE results were combined across frequency in a multi-frequency analysis to predict the presence of hearing loss.
Results
Single-frequency test performance of DPOAEs was best at mid to high frequencies (3 – 8 kHz) with intermediate performance at 1.5 and 2 kHz and chance performance at 1 kHz. Infants with a conductive component to their hearing loss (CHL and MHL combined) displayed significantly lower ambient absorbance values than the NH group. No differences in ambient absorbance were found between the NH and SNHL groups. Multi-frequency analysis resulted in the best prediction of hearing loss for the SNHL/MHL group with poorer sensitivity values when infants with CHL were included.
Conclusions
Clinical interpretation of DPOAEs in infants can be improved by using age-appropriate normative ranges and optimized cut-off values. DPOAE interpretation is most predictive at higher f2 test frequencies in young infants (2 – 8 kHz) due to poor test performance at 1 – 1.5 kHz. Multi-frequency rules can be used to improve sensitivity while balancing specificity. Lastly, a sensitive middle-ear measure such as wideband absorbance should be included in the test battery to assess possibility of a conductive component to the hearing loss.
INTRODUCTION
Distortion product otoacoustic emissions (DPOAEs) are a common screening and diagnostic test used to assist in the identification and diagnosis of hearing impairment in young infants referred from newborn screening. Thus far, clinical test performance for diagnostic DPOAEs specific to the infant population have yet to be established. Many clinicians use normative DPOAE values obtained from a group of individuals primarily comprised of adults for pediatric interpretation (age range: 1.3-96.5 yrs.; Gorga et al. 1997). However, previous studies have reported that DPOAE responses are age dependent and that there are significant differences in DPOAE level and noise level between infants and adults (Bergman et al. 1995; Bonfils et al. 1992; Brown et al. 1994; Gorga et al. 2000a; Lafreniere et al. 1991; Lasky 1998; Lasky et al. 1992; Prieve et al. 1997b; Smurzynski et al. 1993). These differences are primarily due to developmental changes that occur in the outer and middle ear (Abdala & Keefe 2006; Hunter et al. 2015; Keefe & Abdala 2007; Keefe et al. 1993).
With the goal of identification of hearing loss before 3 months of age and intervention by 6 months of age (JCIH, 2007), optimal clinical interpretation of DPOAE responses in infants is of critical importance. As explained below, it is important to consider both the DPOAE level and signal-to-noise ratio (SNR) to assess the reliability of the response (SNR > 0), whether a high DPOAE level is due to large amounts of noise in the response or a robust signal generated within a healthy cochlea. Establishing DPOAE level and SNR cut-off values would allow more accurate and efficient diagnosis of hearing loss in the pediatric population.
DPOAE level and SNR cut-off values that accurately predict the presence of hearing loss have not yet been defined in newborns and infants. Gorga et al. (1997) recommended that based on the DPOAE amplitude (i.e., the DPOAE level in the terminology of the present paper), DPOAE responses can be placed into three categories including a normal range, abnormal range, or borderline range. The normal range includes DPOAE levels that are greater than the 90th or 95th percentile obtained from hearing loss individuals, the abnormal range includes DPOAE levels that are less than the 5th or 10th percentile obtained from individuals with normal hearing, and the borderline range includes values that fall in between the normal and abnormal range. A major issue associated with using adult normative data for pediatric DPOAE interpretation is the potential for misdiagnosis. Since DPOAE levels have been reported to be more robust in infants than adults (Bonfils et al. 1992; Gorga et al. 2000a; Gorga et al. 2000b; Lafreniere et al. 1991; Smurzynski et al. 1993) clinicians might incorrectly infer that an infant has normal DPOAE amplitude and therefore normal hearing when in fact their DPOAE amplitude is reduced and may be indicative of hearing loss. Moreover, DPOAE noise levels are larger in infants than adults, which can thereby reduce the SNR in infants.
Audiologic Guidelines for the Assessment of Hearing in Infants and Young Children (American Academy of Audiology 2012) state that DPOAE measurements in infants should include target stimulus levels of L1 = 65 dB SPL and L2 = 50 or 55 dB SPL at 6 to 8 frequencies restricted to f2 frequencies of 2 kHz and above due to high levels of noise in the low frequencies (Gorga et al. 2000b). The guidelines further specify that DPOAE responses should be considered present and normal when the SNR is > 3 to 6 dB at the majority of f2 frequencies tested (Avan & Bonfils 1993; Lonsbury-Martin & Martin 1990; Moulin et al. 1994; Smurzynski 1994), and the DPOAE level falls within age appropriate normative ranges for normal hearing infants and children reported by Prieve et al. (1997b), and Gorga et al. (2000b), and Abdala et al. (2008).
Prieve et al. (1997b) reported DPOAE input-output functions using primary levels ranging from 40-65 dB SPL with L1 > L2 by 15 dB at f2 frequencies of 1 to 6 kHz in infants (< 1 year, N=28), toddlers (N=28), children (N=105), and young adults (N=35). Gorga et al. (2000b) reported mean DPOAE level and SNRs with primary levels of 65/50 dB SPL at f2 frequencies ranging from 1 – 4 kHz from 2348 well babies without risk factors, 353 well babies with at least one risk factor, and 4478 NICU graduates shortly after birth. Abdala et al. (2008) measured DP-grams using primary tones of 65/55 dB SPL at f2 frequencies ranging from 1.5 to 8 kHz in 20 infants shortly after birth, or between 37 – 40 weeks gestational age if they were preterm, and again at 3, 4, 5, and 6 months of age. While all these normative studies used an f2/f1 ratio of 1.22 and the recommended stimulus levels (65/55 or 65/50 dB SPL), they varied in terms of the frequency range measured. Even though it is recommended that DPOAE f2 frequencies should be limited to 2 kHz and above, Gorga et al. (2000b) only measured up to 4 kHz and Prieve et al. (1997b) measured up to 6 kHz. While Abdala et al. (2008) measured up to 9 kHz, results were obtained from a small number of infants (N=20).
In addition, these infant DPOAE studies had varying approaches to incorporating information on middle-ear function, and on determining whether the hearing thresholds were within the normal hearing range. Prieve et al. (1997b) recorded 0.226 kHz tympanograms, which cannot be used for neonates to reliably differentiate normal ears and those with middle-ear fluid (Marchant et al. 1986; Paradise et al. 1976). Prieve et al. assessed normal hearing (NH) based on a sound-field visual reinforcement audiometry (VRA) test. However, due to the difficult nature of testing young children, reliable results were only obtained in 10% of children less than two years of age. Gorga et al. (2000b) reported DPOAE measurements in ears in a newborn hearing screening population for which a subset of ears were further tested on the same test date using energy reflectance measurements of middle-ear function (Keefe et al. 2000). The present study considers absorbance, which is defined as the ratio of energy absorbed by the middle ear and ear canal to the incident acoustic energy (Keefe et al. 2015; Liu et al. 2008). Combined analyses of these DPOAE and absorbance data in newborns showed that middle-ear dysfunction identified using an absorbance test partially explained the inability to record a detectable DPOAE in some ears (Keefe et al. 2003b). The combination of DPOAE and absorbance data in newborns improved the ability to predict hearing status based on a VRA exam at 8-12 months corrected age (Keefe et al. 2003a). The reliance on VRA testing many months later implies that hearing status was unknown at the time of the DPOAE data collection. The scope of Abdala et al. (2008) did not include a measure of middle-ear function, and assessed NH based on infants passing a click-evoked auditory brainstem response (ABR) screen at 35 dB nHL. Other issues associated with the aforementioned normative studies, are that some had a small sample size (Abdala et al. 2008), focused on preterm/term newborns (Abdala et al. 2008; Gorga et al. 2000b), or combined infants across birth to 1 year (Prieve et al. 1997a), a time during which many developmental changes occur in ear-canal and middle-ear function.
No previous study in infants has reported the ability to classify the type of hearing loss, if present within the first 3 months after birth, based on the DPOAE test and any other test data. It is clinically relevant to determine whether a given hearing loss in an infant is purely sensorineural, purely conductive or a mixture of sensorineural and conductive. The present study used diagnostic tone-burst ABR testing at the same 1-month age at which DPOAE and absorbance data were measured, followed by VRA testing at 9-12 months. The ABR test protocol was designed to provide both air- and bone-conduction thresholds based on Elsayed et al. (2015). This enabled an assessment of hearing status during this period of follow-up newborn hearing screening testing. The combination of air- and bone-conduction data enabled the assignment of infant test data into a NH group as well as in several hearing loss groups including conductive hearing loss (CHL), mixed hearing loss (MHL), and sensorineural hearing loss (SNHL). The major goal of the present study was to evaluate the test performance of DPOAE level and SNR in classifying ears as NH or having a hearing loss (CHL, MHL or SNHL), and in classifying ears as NH or having pure or mixed sensorineural hearing loss (SNHL or MHL). A secondary goal was to evaluate the ability of an ambient absorbance test to classify ears as NH or having a conductive component to the hearing loss (CHL or MHL). The potential advantage of using both DPOAE and absorbance tests is that a DPOAE test is sensitive to outer hair cell dysfunction leading to a SNHL or MHL, while absorbance is sensitive to middle-ear dysfunction leading to a CHL or MHL. A comparison of absorbance tests at tympanometric peak pressure and at ambient pressure was outside the scope of this study.
MATERIALS AND METHODS
Subject Enrollment and Demographics
This study was part of a longitudinal, prospective multi-year project to evaluate the use of a wideband acoustic immittance test battery in conjunction with DPOAE, ABR, and VRA testing to identify middle-ear, cochlear, and neural hearing loss in infants and children. Infants were enrolled from the well-baby nursery (WBN) and neonatal intensive care unit (NICU) after they completed the Universal Newborn Hearing Screening (UNHS) at the birth hospital. In the WBN, the UNHS was a two-stage protocol that consisted of transient evoked otoacoustic emissions (TEOAE, clicks at 80 dB SPL) and automated ABR (clicks at 35 dB nHL) if the infant did not pass the TEOAEs in either ear. In the NICU, ABR testing was combined with TEOAE or DPOAE testing as recommended by the Joint Committee on Infant Hearing for infants at higher risk of neurological problems (JCIH 2007). Screening was completed with the Natus echo-screen (Planegg, Germany) and due to proprietary technology, specific pass/refer criteria are not available. Infants participated in up to four study visits from birth to 15 months of age including a Visit 1 (birth – 4 mos.), Visit 2 (4 – 7 mos.), Visit 3 (7 – 11 mos.), and Visit 4 (11 – 15 mos.). The focus of the present study was data collected at Visit 1 along with VRA data from Visit 3 and 4 to confirm hearing status.
A total of 502 infants (975 ears) were enrolled in the study. However, several ears were excluded due to lack of DPOAE data (N=18), missing ABR data (N=17), Auditory Neuropathy Spectrum Disorder diagnosis (N= 2), or the age at test was greater than the range for Visit 1 (birth to 4.2 months of age; N=5). This resulted in 844 ears with NH and 89 with hearing loss. An additional 473 ears were excluded as they did not meet the normal hearing inclusion criteria including 115 ears that did not pass two stage UNHS, 343 ears that passed the UNHS, but had inconclusive diagnostic ABR (N=15), inconclusive VRA (N=53), elevated VRA results (N=77) or VRA visit was not completed (N=213). Four hearing impaired ears were excluded due to missing VRA data. Therefore, a total of 456 infant ears (371 normal hearing and 85 hearing loss) were included in the analysis.
Demographic information for all infants that participated in the present study at Visit 1 and were included in the analyses are displayed in Table 1. A total of 279 infants (149 male and 130 female) and 456 ears were included in this study. Approximately two-thirds of the study participants classified their race as Caucasian, one-third as African-American, and the remaining classified as other. The majority of the participants identified their ethnicity as non-Hispanic (97%). Approximately one-third of the infants had at least one risk factor for hearing loss, with NICU stay > 5 days, hyperbilirubinemia, and ototoxic medications recorded as the most common risk factors in the medical record.
TABLE 1.
Study Sample Characteristics
| Characteristic | |
|---|---|
| Gender: N (%) | |
| Male | 149 (53.4) |
| Female | 130 (46.6) |
| Race: N (%) | |
| Black or African American | 77 (27.6) |
| White or Caucasian | 173 (62.0) |
| Other | 29 (10.4) |
| Ethnicity: N (%) | |
| Hispanic/Latino | 8 (2.9) |
| Non-Hispanic/Latino | 271 (97.1) |
| Risk Factors*: N (%) | |
| Family History | 22 (7.9) |
| Stigmata | 0 (0.0) |
| Intrauterine Infection | 3 (1.1) |
| Ototoxic Drugs | 37 (13.3) |
| Hyperbilirubinemia | 45 (16.1) |
| NICU > 5 days | 59 (21.1) |
| Low Birth Weight | 22 (7.9) |
| Any risk factors present: N (%) | 93 (33.3) |
| Corrected Age at 1 Month Visit (mos.) | |
| Mean (SD) | 1.3 (0.7) |
| Range | −0.5 to 4.2 |
| Ear: N (%) | |
| Left | 230 (50.4) |
| Right | 226 (49.6) |
Percentages add up to more than 100% due to multiple risk factors for some infants.
NICU = Neonatal Intensive Care Unit; SD = Standard Deviation; N = Number; mos. = months
The diagnosis of hearing status was based on the infant’s “overall clinical diagnosis” which considered ABR thresholds and wideband tympanometry from Visit 1 along with VRA thresholds obtained at Visit 3-4 to confirm the presence/type of hearing loss. In some cases, ABR and VRA thresholds did not agree. The most common cases (18 ears) were elevated ABR thresholds at Visit 1 and abnormal wideband tympanometry (low admittance or wide width) with normal hearing at Visits 3-4, thus clinical diagnosis was classified as CHL at Visit 1. The “overall clinical diagnosis” was used for the multi-frequency analyses. The ABR and VRA test protocol below provides specific information on how hearing loss was diagnosed based on air- and bone-conduction thresholds for each on the aforementioned tests.
All infants with normal hearing passed the UNHS and had normal hearing verified with both ABR and VRA. Of the 85 ears diagnosed with hearing loss at Visit 1, 52 passed the UNHS and all ears had their hearing status verified with VRA. Included in the hearing loss group were 6 infants with craniofacial anomalies, including cleft palate, Pierre Robin, Branchio-Oto-Renal Syndrome, Down Syndrome, macrocephaly, and macrocrania.
The majority of the ears with hearing loss were diagnosed with conductive hearing loss (CHL; N = 67), with smaller numbers of sensorineural hearing loss (SNHL; N = 10) and mixed hearing loss (MHL; N = 8). The mean (and range) of the tone-burst ABR thresholds at each test frequency from ears with hearing loss were as follows: 56 dB nHL (40 to 90 dB nHL) at 0.5 kHz, 49 dB nHL (35 to 90 dB nHL) at 1 kHz, 52 dB nHL (40 to 90 dB nHL) at 2 kHz, 57 dB nHL (40 to 90 dB nHL) at 4 kHz. For infants diagnosed with CHL, the mean (and range) of the tone-burst ABR thresholds at each test frequency from ears with hearing loss were as follows: 51 dB nHL (40 to 60 dB nHL) at 0.5 kHz, 45 dB nHL (35 to 70 dB nHL) at 1 kHz, 46 dB nHL (40 to 50 dB nHL) at 2 kHz, 47 dB nHL (40 to 60 dB nHL) at 4 kHz.
Test Protocol
The study was approved by the Institutional Review Board of Cincinnati Children’s Hospital Medical Center and Good Samarian Hospital. Informed consent was obtained from the parent(s) of all infants prior to enrollment. At each visit otoscopy, DPOAE, and wideband absorbance tests were completed with diagnostic tone-burst ABR testing completed at Visit 1, and VRA testing completed at Visit 3-4. All tests were performed within a double-walled sound booth.
DPOAE testing was completed with the Vivosonic Integrity system (Version 5.2, Toronto, ON, Canada) with an ILO P40-UG probe. Recording parameters included primary tone stimulus levels of 65 dB SPL (L1) and 55 dB SPL (L2) with an f2/f1 frequency ratio of 1.22 (Abdala 1996; Gaskill & Brown 1990; Stover et al. 1996). Prior to recording DPOAEs in each ear, in-situ calibration was performed using a 1 kHz tone. Next, DPOAE level and noise floor were measured at the DPOAE frequency of 2f1-f2 in descending order at seven f2 frequencies (8, 5.5, 4, 3, 2, 1.5, and 1 kHz). The SNR was calculated by subtracting the DPOAE noise level from the DPOAE level at each f2 test frequency. This means that the calculated SNR was sometimes negative in some ears, and this convention was used in the analyzed results. As a practical matter, such SNRs might be interpreted as if the SNR was 0 dB, since a DPOAE level lower than the DPOAE noise level cannot be accurately measured.
Diagnostic ABRs were measured with the Vivosonic Integrity system (Version 5.2 Toronto, ON, Canada). Infants were tested after bottle or breast feeding, while the infant was asleep or awake but resting quietly in their caregiver’s arms or in an infant bouncer. Stimuli were presented at a rate of 37.1 per second through insert earphones (Etymotic Research ER-3A, Elk Grove Village, IL) and a standard hand-held Radioear B-71 bone vibrator (Radioear Corp, New Eagle, PA). Contralateral broadband masking noise was presented at a level of 10 dB above the test stimulus. Masking was always applied for bone-conduction testing however, for air-conduction, it was only applied when there was a 50 dB or greater asymmetry in air-conduction thresholds between ears. Reference values at 0 dB nHL in peak-to-peak equivalent SPL (ppeSPL) at 0.5, 1, 2, and 4 kHz were 25, 26, 31 and 35 dB respectively for ER-3A insert earphones and 67, 54, 49, 41 dB ppe re: 1μN RMS (microNewton Root Mean Square) for the B-71 bone vibrator per Vivosonic documentation. At a minimum, air-conduction tone-burst thresholds were measured at 1 and 4 kHz in all infants, and also at 0.5 and 2 kHz if time permitted (based on the behavioral status of the infant and parent). Likewise, bone-conduction ABR thresholds were measured at 1 and 4 kHz if possible, and then at 0.5 and 2 kHz if time permitted. For multi-frequency analyses, normal ABR air-conduction thresholds were defined as 40 dB nHL or better at 500 Hz, 30 dB nHL or better at 1 and 2 kHz, and 20 dB nHL or better at 4 kHz. ABR bone-conduction thresholds were considered normal if they were ≤ 30 dB nHL. A significant air-bone gap (air-conduction level minus the bone-conduction level at the same test frequency) was defined as air-bone gaps of ≥20 dB at 0.5 and 1 kHz and ≥10 dB at 2 and 4 kHz. The criteria used to define normal and abnormal ABR thresholds were based on values reported by Elsayed et al. (2015) and Vander Werff et al. (2009).
VRA testing was completed using an Intelligent Hearing Systems Smart VRA device with insert earphones (Etymotic Research ER-3A, Elk Grove Village, IL) and a Radioear B-71 bone vibrator (Radioear Corp, New Eagle, PA). The VRA test protocol was modeled based on Widen et al. (2000), and was completed using two examiners with catch trials to assess false-positive responses. A speech awareness threshold using recorded speech syllables (da da or ba ba) as well as air- and bone-conduction tone-burst thresholds were measured from 0.5 to 4 kHz. At a minimum, thresholds were measured at 1 and 4 kHz in all ears. Thresholds at 0.5 and 2 kHz were also measured if time permitted and the child was attentive. Bone-conduction VRA thresholds were measured at 1 and 4 kHz if possible, and then at 0.5 and 2 kHz if time permitted. For multi-frequency analyses, the VRA criteria for normal hearing was a minimum response level of 25 dB HL or better for all speech syllables and warble tones between 1 to 4 kHz, and 30 dB HL or better at 500 Hz. An air-bone gap was considered significant if it exceeded 10 dB for the speech awareness threshold and warble tones between 1 to 4 kHz, and if it exceeded 20 dB at 0.5 kHz.
Wideband tympanometry absorbance data were acquired using custom research software on a personal computer with a Titan probe and modified AT-235 tympanometry hardware (Interacoustics AT-235 and Titan probe, Middlefart, Denmark) from 0.25 to 8 kHz. A detailed description of test procedures along with individual results from infant ears are described in Keefe et al. (2015). Normal tympanometric ambient absorbance values obtained from a group of normal hearing infants reported by (Hunter et al. 2015) were used to determine normal middle ear function in the present study.
The ABR and VRA criteria used to diagnose normal hearing as well as CHL, SNHL, and MHL are as follows. Normal hearing was defined as normal air- and bone-conduction thresholds without a significant air bone gap at all test frequencies. The definition of CHL was abnormal air-conduction and normal bone-conduction combined with a significant air-bone gap at the same frequency. The definition of SNHL was an abnormal air- and bone conduction threshold at the same frequency, without a significant air-bone gap. The definition of MHL was an abnormal air and bone-conduction for the same frequency, combined with a significant air-bone gap.
All infants included in the study with normal hearing or that were diagnosed with CHL, SNHL, or MHL via ABR at Visit 1 had their hearing status verified with VRA at Visit 3-4 as participation in the present study (N = 422 ears) or through a routine clinical audiology (non-study) visit (N=34 ears) that occurred around 9 months of age or later. Of the 422 infant ears that had their hearing status verified through a study visit, ear specific VRA thresholds were obtained in 98% of infants with normal hearing and 96% of infants diagnosed with hearing loss. Reliability of the VRA test results was classified as fair (7%) and good (93%) for normal hearing infants and fair (14%) and good (86%) for hearing loss infants. Poor VRA reliability was reported for some normal hearing infants, and such infants were excluded from analyses as not meeting the normal hearing inclusion criteria (e.g., pass two stage UNHS and normal hearing verified with both ABR and VRA). In about 80% of cases with CHL diagnosed by ABR, hearing was determined to be normal upon later testing by the VRA test at Visit 3 or 4, and thus was consistent with a temporary CHL at Visit 1. Approximately 20% of cases required insertion of pressure-equalizing tubes to resolve a CHL.
Statistical Analyses
DPOAE Level and SNR
Separate one-way analysis of variance (ANOVA) tests were conducted for each DPOAE f2 test frequency (1, 1.5, 2, 3, 4, 5.5, and 8 kHz) to determine if the mean DPOAE levels and SNRs were different based on hearing status. ABR thresholds and the infants’ “overall clinical diagnosis” were used to classify infants into a NH group and HL group (CHL, SNHL, MHL combined). Data were analyzed with SigmaPlot Version 13.0 (Systat Software, San Jose, CA) with the significance level set to p < 0.05.
Ambient Absorbance
A mixed model ANOVA was conducted to examine differences in ambient absorbance across 11 half-octave frequencies (0.25, 0.35, 0.5, 0.7, 1, 1.4, 2, 3, 4, 6, and 8 kHz) between the following three groups of infants: NH, SNHL, and hearing loss with a conductive component (CHL and MHL combined). Significant group differences were further analyzed with post hoc pairwise comparisons with studentized maximum modulus adjustments. Data were analyzed with SAS statistical software, version 9.3 (SAS Institute, Cary, N.C.) with the significance level set to p < 0.05.
Receiver Operator Characteristic (ROC) Curve Analyses
Receiver operating characteristic (ROC) curves were constructed to evaluate the diagnostic utility of DPOAEs to separate ears with normal and abnormal hearing. Two levels of ROC analyses were completed; 1) ROC curves were constructed for each DPOAE f2 frequency for both DPOAE level and SNR to establish symmetry cut-off values for frequency-specific interpretation of DPOAEs (i.e. single-frequency ROC analyses). 2.) Next, several multi-frequency ROC analyses were completed to determine the optimal number of frequencies required to pass in order to classify the ear as normal hearing and to determine which DPOAE f2 test frequencies provide best test performance. For the single-frequency ROC analyses, an ABR cutoff value of 30 dB nHL was chosen to represent normal hearing based on its use in a study in predominantly adult ears by Gorga et al. (1997). This study reported that ROC test performance of DPOAEs in a predominantly adult group of test ears was best when normal hearing levels were defined as audiometric thresholds from 20 – 30 dB HL, with test performance declining as the normal hearing criteria became more lax or stringent. Therefore for single-frequency ROC analysis in the present study, normal hearing was defined as ABR air-conduction thresholds ≤ 30 dB nHL for all test frequencies. ROC curves were not completed for the DPOAE data collected at the 9 to 12 months of age due to a limited number of infants that displayed hearing loss with VRA at Visit 3 (N = 14) or Visit 4 (N = 3). This is due to the fact that the majority of infants with CHL at Visit 1 no longer had a conductive component at their 9 or 12 month visit. For the multi-frequency ROC analysis, the infant’s hearing status was based on their “overall clinical diagnosis” which considered ABR thresholds and wideband tympanometry from Visit 1 along with VRA thresholds obtained at Visit 3-4 to confirm the presence/type of hearing loss.
Single-Frequency DPOAE Signal Level and SNR ROC Analyses
ROC curves were constructed for each DPOAE f2 frequency and only included infants where both the DPOAE and corresponding ABR thresholds were available. Therefore, the total number of ears included in the ROC analysis varied by frequency. Two prediction variables, DPOAE level and SNR, were separately analyzed at each test frequency by construction of a pair of ROC curves. Each ROC curve quantified the ability of its prediction variable to classify ears as NH or HL (any of CHL, MHL or SNHL). Two summary indices of each ROC curve were calculated: the non-parametric area under the ROC curve (AUC), and the point of symmetry (SYM) on the curve at which the sensitivity and specificity were equal (Pepe 2003), or most nearly equal. The AUC was used as the overall measure of test performance for each predictor variable. Symmetry cut-off values for DPOAE level and SNR were defined as the SYM of their respective ROC curves, which fixed the operating point of the test to have both a relatively high specificity and relatively high sensitivity. ROC analyses were performed with SigmaPlot Version 13.0 (Systat Software, San Jose, CA).
Multi-Frequency DPOAE Signal Level and SNR ROC Analyses
The above ROC curve analyses are generally similar to those used in previous studies to evaluate the accuracy of DPOAE data to classify ears as normal or abnormal at a single frequency. One limitation of these analyses is that two AUCs are calculated at each DPOAE f2 frequency, whereas it is clinically relevant to evaluate each test ear as normal or abnormal. The first step in addressing this limitation, is to use both the DPOAE level and SNR symmetry cut-off values obtained in the single-frequency ROC analysis to classify each f2 test frequency as normal or abnormal. The present study defined a single DPOAE f2 test frequency as a pass if it was a pass according to both of the level and SNR cut-offs, and was defined as a non-pass DPOAE otherwise. This resulted in a pass ear having a sufficiently large DPOAE level as well as a sufficiently large SNR. The SNR cut-off value was not determined in terms of any given a priori choice of value (such as 3 or 6 dB, as described in the Introduction), and similarly for the DPOAE level cut-off. Instead, the DPOAE level and SNR symmetry cut-off values (i.e., the SYM of the ROC curves) were obtained from the single-frequency ROC curves. This approach differs from Norton et al. (2000b) who evaluated DPOAE test performance in neonates using AUCs based on SNR only. A second step to address this limitation of single-frequency ROC curves was to combine the DPOAE test results across frequency to provide a single classification of each test ear as normal or abnormal (i.e., multi-frequency analyses). Such a single classification of hearing status is clinically relevant.
Therefore, multi-frequency analyses were completed to determine the ability of the DPOAE level and SNR symmetry cut-off values combined across frequency to correctly classify ears with various types of hearing loss according to the infant’ overall clinical diagnosis. The single frequency ROC results described below showed that DPOAEs at f2 frequencies of 1 and 1.5 kHz were inaccurate at classifying ears as NH or HL. Thus, the multi-frequency analyses were restricted to f2 frequencies of 2 kHz and higher. This low-frequency restriction, i.e., excluding f2 test frequencies below 2 kHz, is similar to that used in neonates Norton et al. (2000a). Another difference is that the maximum f2 test frequency of 8 kHz in the present study was higher than the 4 kHz frequency used in the neonatal study.
A total of 4 multi-frequency analyses were completed. A “5 Frequency Analysis” included DPOAE data at five f2 frequencies (2, 3, 4, 5.5 and 8 kHz), two versions of a “4 Frequency Analysis” were evaluated that included DPOAE data at four f2 frequencies across (3, 4, 5.5 and 8 kHz) and (2, 3, 4, and 5.5 kHz), and a “3 Frequency Analysis” included DPOAE data at three f2 frequencies (2, 3 and 4 kHz). The rationale for analyzing these four conditions was that the AUCs were lower at 2 kHz than at all higher frequencies (as described in Results), so it was of interest to compare multi-frequency analyses in which the DPOAE predictors at 2 kHz were either included or excluded. In addition, most previous studies stopped at f2 frequencies of 4 kHz and therefore, we wanted to evaluate whether test performance improved by including DPOAE data at 5.5 and 8 kHz. These multi-frequency analyses were completed for two dichotomous groups of ears: NH or HL (CHL, SNHL and MHL subgroups), and NH or a sensorineural component of HL (SNHL and MHL). The inputs to the multi-frequency analyses included the pass/refer status based on both the DPOAE level and SNR, which were calculated using the cut-off at the SYM of their respective ROC curve at each frequency.
Previous research studies have combined DPOAE results across multiple f2 frequencies by defining a DPOAE pass based on passing at a certain number of f2 frequencies or better. This approach was evaluated in the present study. For example, in the “5 Frequency Analysis”, the sensitivity and specificity were evaluated at each condition requiring a pass on both DPOAE level and SNR at 1, 2, 3, 4, or all 5 frequencies. A novel aspect of the present study was to embed this type of multi-frequency analysis in a second level of ROC curve analysis. Consider the “4 Frequency Analysis” (the analysis of the 3 and 5 Frequency Analysis proceeded along similar lines). A new ROC curve was constructed by classifying a test ear as DPOAE pass (i.e., NH) if the ear had a DPOAE pass at 0 or more, 1 or more, 2 or more, 3 or more, or all 4 test frequencies. The 0-or-more pass condition classified all ears as passing the DPOAE (specificity of 1, sensitivity of 0), and a fifth end point was added to the ROC curve after the all-4 pass condition that represented that no ears passed the DPOAE (specificity of 0, sensitivity of 1). The non-parametric AUC was calculated using Excel, and the optimum predictor was identified as the multi-frequency test that was closest to the SYM value of the ROC curve. This optimized the final DPOAE test performance using a criterion with relatively high specificity and high sensitivity. In summary, DPOAE test performance was evaluated for two dichotomous groups of ears: NH or HL (CHL, SNHL and MHL subgroups), and NH or a sensorineural component of HL (SNHL and MHL). As described below, the number of pure SNHL ears (N = 10) was insufficient to allow an evaluation of test performance for classifying ears as NH or SNHL.
RESULTS
Although this was part of a longitudinal study, only infant data collected at Visit 1 (ambient absorbance, DPOAEs, ABR) are discussed further below with VRA data collected at Visit 3 and 4 used to confirm the presence of hearing loss. The companion paper (Hunter et al., submitted) describes longitudinal results on DPOAEs in infants with normal hearing from birth to 15 months of age.
DPOAE Level and SNR
Figure 1 displays the individual DPOAE level and SNR values from ears with hearing loss (CHL, SNHL, MHL) plotted over normative data obtained from 1 month old infants with normal hearing that was presented in the companion paper (Hunter et al., submitted). The light grey shaded area represents the 10th to 90th percentiles, the dark grey shaded area represents the 20th to 80th percentiles and the black line represents the median or 50th percentile from NH infants. Data points were jittered by frequency for easier visualization. It is important to note that although the 5th to 95th percentiles are commonly used to define normal ranges, in infants, the 5th percentile is mostly below the noise floor. Therefore, we evaluated more stringent criteria for SNR and DPOAE level.
Figure 1.

Individual DPOAE level and SNR values for infants with conductive, sensorineural and mixed hearing loss plotted over the 1 month normative data from companion paper (Hunter et al., submitted). The light shaded area represents the 10th to the 90th percentile and the dark shaded area represents the 20th to 80th percentile. Several data points that were well outside of the 90th percentile are identified with participant numbers and will be discussed in the text.
From 1 – 2 kHz, DPOAE level and SNR values from infants with hearing loss substantially overlapped the NH distribution. At 3 kHz and above, most of the DPOAE level and SNR values from infants with hearing loss fell below the 50th percentile with the majority of the data points at or below the 10 – 20th percentile from the NH distribution. In addition, the range of DPOAE level and SNR values from individuals with different types of hearing loss (CHL, SNHL, MHL) were similar. Some extreme values are marked in Figure 1 and are discussed below (See Case Studies).
Figure 2 displays the mean DPOAE level (top panel) and SNR (bottom panel) for infants with NH, CHL, and SNHL/MHL combined. Brackets represent the 95% confidence intervals of the mean and were jittered around the frequency axis for visualization purposes. Infants with NH had the largest mean DPOAE level and SNR at all frequencies with the exception of 1 kHz, at which the confidence intervals substantially overlapped between NH, CHL and SNHL/MHL groups. The DPOAE level and SNR confidence intervals from infants with CHL compared to those with SNHL/MHL, overlapped at all f2 test frequencies with the exception of DPOAE SNR at 5.5 kHz. The confidence intervals for infants with CHL were separated from infants with NH from 2 to 8 kHz for DPOAE level, and from 1.5 to 8 kHz for DPOAE SNR. For infants with SNHL/MHL, the confidence intervals were clearly separated from infants with NH from 1.5 to 2 kHz and 4 to 8 kHz for DPOAE level, and from 1.5 to 8 kHz for DPOAE SNR. In general, the greatest overlap in confidence intervals between infants with normal and abnormal hearing occurred in the lower frequencies, with more separation as f2 frequency increased.
Figure 2.

Mean DPOAE level and SNR values plotted as a function of f2 frequency for infants with NH, CHL, and SNHL/MHL. Brackets represent the 95% confidence intervals and were offset for visualization purposes.
One-way ANOVAs were conducted to determine if there were statistically significant mean differences in DPOAE level and SNR between infants with normal hearing and hearing loss. Due to the small number of infants with hearing loss and the fact that the distributions from infants with CHL, SNHL, and MHL were overlapping, data from all infants with hearing loss were combined to form a single HL group (CHL, SNHL, MHL combined). DPOAE level and SNR, with the exception of SNR data at 1 and 1.5 kHz, were not normally distributed, as assessed by Shapiro-Wilk’s test (p <0.05), and therefore, a Kruskal-Wallis One Way Analysis of Variance on Ranks was performed. Results indicated statistically significant differences in the mean DPOAE level and SNR between the NH and HL group (p < 0.001) at all DPOAE f2 test frequencies from 1.5 to 8 kHz.
Ambient Absorbance
Figure 3 displays the mean ambient absorbance for NH, CHL, SNHL and MHL groups as a function of test frequency. Brackets represent the 95% confidence intervals, which are slightly offset horizontally for visualization purposes. The NH and SNHL groups had the highest mean absorbance across all frequencies from 0.25 to 8 kHz. The MHL group had the lowest mean ambient absorbance values at all frequencies with the exception of 3 to 4 kHz which displayed a minimal difference in mean ambient absorbance values compared to the CHL group.
Figure 3.

Mean ambient absorbance values for the NH, CHL, SNHL, and MHL groups are displayed as a function of frequency (0.25 to 8 kHz). Brackets represent the 95% confidence intervals of the mean and were offset for visualization purposes.
A mixed model ANOVA was conducted to examine differences in mean ambient absorbance among the following three groups of infants: NH, SNHL, and hearing loss with a conductive component (CHL and MHL combined). Results displayed a significant main effect of group for ambient absorbance test frequencies from 1 to 8 kHz. Post hoc pairwise comparisons (see Table 2) revealed a significant difference in mean ambient absorbance values between the NH and CHL/MHL groups at all frequencies from 1 to 8 kHz (p < 0.001) with larger mean absorbance in NH ears, but no difference between NH and SNHL ears at any frequency (p > 0.05). A significant difference was also found between the SNHL and CHL/MHL group at 8 kHz. There were no significant differences in the mean ambient absorbance between any of the groups at frequencies below 1 kHz.
TABLE 2.
Ambient Absorbance Post Hoc Pairwise Comparison P-Values
| Frequency | NH vs SNHL | NH vs CHL/MHL | SNHL vs CHL/MHL |
|---|---|---|---|
| 0.25 kHz | 0.7612 | 0.6499 | 0.5224 |
| 0.35 kHz | 0.6546 | 0.5775 | 0.3957 |
| 0.5 kHz | 0.4554 | 0.7518 | 0.2929 |
| 0.7 kHz | 0.8186 | 0.2579 | 0.4258 |
| 1 kHz | 0.9978 | 0.0151* | 0.5295 |
| 1.4 kHz | 0.9912 | <.0001** | 0.1673 |
| 2 kHz | 0.6809 | <.0001** | 0.3165 |
| 3 kHz | 0.868 | <.0001** | 0.3471 |
| 4 kHz | 0.7408 | <.0001** | 0.7977 |
| 6 kHz | 0.9848 | <.0001** | 0.1435 |
| 8 kHz | 0.9449 | <.0001** | 0.0235* |
Significance levels found in the analysis:
p < 0.05,
p <0.0001
NH = Normal Hearing; CHL = Conductive Hearing Loss; SNHL = Sensorineural Hearing Loss; MHL = Mixed Hearing Loss
Single-Frequency Receiver Operator Characteristic (ROC) Curves
ROC curves were constructed for each DPOAE f2 frequency to evaluate the extent to which ears with NH and HL (CHL, SNHL, MHL combined) could be distinguished based on DPOAE level and SNR value. The corresponding AUC values and symmetry cut-off values for DPOAE level and SNR are displayed in Table 3. The overall test performance was best at 8 kHz and progressively worsened as the test frequency decreased. The highest AUC values were found for frequencies between 3 – 8 kHz. Performance at 1 kHz for both DPOAE level and SNR was around chance, and intermediate performance was seen at 1.5 and 2 kHz. At all frequencies, test performance was better, or at least the same, for DPOAE SNR compared to DPOAE level. DPOAE levels and SNR values greater than or equal to the cut-off values in Table 3 would be considered consistent with normal hearing or a slight/mild hearing loss and those below these values would indicate abnormal function. In particular, the cut-offs for SNR varied with frequency between 2 and 8 kHz over a range from 4.9 to 12.7 dB. Thus, the definitions of pass and non-pass based on the SYM of the ROC curve differed across frequency, and indicated that using a fixed criterion level of SNR (e.g., 3 or 6 dB) was not adequate.
TABLE 3.
ROC Analysis: AUC and Symmetry Cut-off Values
| AUC Value
|
Symmetry Cut-off Point
|
|||
|---|---|---|---|---|
| Frequency | SNR | DPOAE Level | SNR (dB) | DPOAE Level (dB SPL) |
| 1 kHz | 0.54 | 0.48 | 2.4 | 9.9 |
| 1.5 kHz | 0.83 | 0.77 | 2.4 | 10.7 |
| 2 kHz | 0.84 | 0.82 | 8.6 | 6.3 |
| 3 kHz | 0.88 | 0.84 | 4.9 | 4.4 |
| 4 kHz | 0.92 | 0.88 | 12.7 | 5.9 |
| 5.5 kHz | 0.89 | 0.89 | 10.6 | 2.5 |
| 8 kHz | 0.94 | 0.91 | 7.6 | −9.1 |
AUC = Area Under the ROC Curve; DPOAE = Distortion Product Otoacoustic Emission; SPL = Sound Pressure Level; SNR = Signal-to-Noise Ratio
Multi-Frequency DPOAE Level and SNR Analysis
As described in the Methods section, the multi-frequency analyses combined DPOAE data across the frequency range into a single predictor of hearing status for each test ear. Due to poorer performance at 1 and 1.5 kHz based on AUC values (see Table 3), these frequencies were not included in the multi-frequency analyses. These analyses determined: 1) the ability of the cut-off values based on the SYM of the ROC curve for each of the DPOAE level and SNR variables to correctly classify ears with various types of hearing loss, and 2) whether DPOAE data at 2 kHz are effective for clinical interpretation due to intermediate performance based on AUC (see Table 3), compared to data at higher frequencies. Results from the multi-frequency analyses were compared to the infant’s overall clinical diagnosis, and the corresponding sensitivity and specificity were calculated for NH ears compared to ears in the following two groupings of hearing loss: 1) CHL, SNHL, MHL combined as in the HL group defined above, and 2) SNHL/MHL combined.
Table 4 displays the sensitivity, specificity and AUC values for the multi-frequency analyses. These include a “5 Frequency Analysis (2-8 kHz)”, two “4 Frequency Analyses (2-5.5 kHz) and (3-8 kHz)”, and a “3 Frequency Analysis (2-4 kHz)”, as functions of the number of test frequencies at which a DPOAE pass was required. The sensitivity and specificity in each analysis were based on the symmetry cut-off values reported in Table 3 for DPOAE level and SNR. In general, as the number of frequencies required for a passing result increased, the overall sensitivity increased and the specificity decreased. In addition, sensitivity increased when ears with a CHL were excluded as in the combined SNHL and MHL group. For example, for the “5 Frequency Analysis” of DPOAE test data, the AUC was 0.82 to classify ears as NH or HL (including all CHL, SNHL and MHL ears), and the AUC increased to 0.96 to classify ears as having a sensorineural component to the hearing loss (i.e., the combined SNHL and MHL group). The AUC results for both “4 Frequency Analyses” and the “3 Frequency Analysis” of DPOAE test data displayed a similar improvement in test performance by excluding the ears with a pure CHL from the hearing loss group.
TABLE 4.
Multi-Frequency Analysis
| HL Group (CHL, SNHL, MHL)
|
SNHL/MHL Group
|
|||||||
|---|---|---|---|---|---|---|---|---|
| # of Frequencies* | Sensitivity (%) | Specificity (%) | AUC Value | # of Frequencies* | Sensitivity (%) | Specificity (%) | AUC Value | |
| 3 Frequency (2, 3, 4 kHz) | 0.78 | 0.93 | ||||||
| 1 of 3 | 59% | 90% | 1 of 3 | 83% | 90% | |||
| 2 of 3 | 75% | 75% | 2 of 3 | 100% | 75% | |||
| 3 of 3 | 81% | 53% | 3 of 3 | 100% | 53% | |||
|
| ||||||||
| 4 Frequency (2, 3, 4, 5.5 kHz) | 0.81 | 0.95 | ||||||
| 1 of 4 | 52% | 93% | 1 of 4 | 78% | 93% | |||
| 2 of 4 | 73% | 84% | 2 of 4 | 100% | 84% | |||
| 3 of 4 | 76% | 69% | 3 of 4 | 100% | 69% | |||
| 4 of 4 | 88% | 49% | 4 of 4 | 100% | 49% | |||
|
| ||||||||
| 4 Frequency (3, 4, 5.5, 8 kHz) | 0.81 | 0.95 | ||||||
| 1 of 4 | 47% | 94% | 1 of 4 | 67% | 94% | |||
| 2 of 4 | 67% | 87% | 2 of 4 | 100% | 87% | |||
| 3 of 4 | 76% | 76% | 3 of 4 | 100% | 76% | |||
| 4 of 4 | 85% | 55% | 4 of 4 | 100% | 55% | |||
|
| ||||||||
| 5 Frequency (2, 3, 4, 5.5, 8 kHz) | 0.82 | 0.96 | ||||||
| 1 of 5 | 45% | 95% | 1 of 5 | 67% | 95% | |||
| 2 of 5 | 66% | 90% | 2 of 5 | 100% | 90% | |||
| 3 of 5 | 73% | 82% | 3 of 5 | 100% | 82% | |||
| 4 of 5 | 80% | 65% | 4 of 5 | 100% | 65% | |||
| 5 of 5 | 88% | 46% | 5 of 5 | 100% | 46% | |||
HL Group = (CHL, SNHL, MHL); CHL = Conductive Hearing Loss; SNHL = Sensorineural Hearing Loss; MHL = Mixed Hearing Loss; # = Number.
Frequencies passed both DPOAE signal level and SNR; Each row in bold text indicates best test performance based on balance between sensitivity and specificity.
As a clinical tool, it is necessary to select a particular multi-frequency test and criteria to use for interpretation. Due to the high cost of missing an infant with hearing loss compared to the cost of completing an unnecessary additional test (in the case of an infant with NH being misdiagnosed with HL by DPOAEs), the optimal test was chosen as one that had high sensitivity (ideally close to 100%) and adequate specificity (ideally 80 % or higher). It is recommended that either a “5 Frequency” or “4 Frequency (3-8 kHz)” criteria with the majority of test frequencies passing both DPOAE level and SNR be used for interpretation to optimize both sensitivity and specificity.
For the “5 Frequency Analysis”, the optimum multi-frequency DPOAE test for the combined HL group (CHL, SNHL, MHL) was a pass at 3 of 5 of the f2 test frequencies, for which the sensitivity was 73% and the specificity was 82%. The optimum multi-frequency test for the hearing loss group (SNHL, MHL) with CHL ears excluded was that the single-frequency DPOAE tests were a pass at 3 of 5 of the f2 test frequencies, for which the sensitivity was 100% and the specificity was 82%. Thus, the sensitivity for the 3 of 5 pass condition was excellent for classifying ears with mild or greater sensorineural or mixed loss, but was lower when ears with a pure conductive hearing loss were included.
For the “4 Frequency Analysis (3-8 kHz)”, the optimum multi-frequency DPOAE test for the HL group (CHL, SNHL, MHL) was that the single-frequency DPOAE tests were a pass at 3 of 4 of the f2 test frequencies, for which the sensitivity and specificity were both 76%. The optimum multi-frequency test for the hearing loss group (SNHL, MHL) with CHL ears excluded was that the single-frequency DPOAE tests were a pass at 3 of 4 of the f2 test frequencies, for which the sensitivity was 100% and the specificity was 76%. Previous studies in predominantly adult ears have also shown that audiometric status is better predicted when multiple DPOAE test frequencies are considered (Dorn et al. 1999; Gorga et al. 2005; Gorga et al. 1999). However, these studies used multivariate analyses with logistic regressions. The multi-frequency analyses in the present study include SYM values from single-frequency analyses that can be entered into the DPOAE acquisition software. In testing a new subject, the clinician would only need to ensure that both DPOAE level and SNR are a pass at 3 of 5, or 3 of 4, test frequencies in order to classify the DPOAE results as consistent with overall normal OHC function within the test frequency region. If the DPOAE level and SNR do not meet the 3 of 5 or 3 of 4 recommendation, the clinician could infer that DPOAE results are consistent with at least a mild hearing loss in that ear at a minimum of one frequency region.
Normal and Abnormal Distributions of DPOAE Level and SNR in Infants
Figure 4 displays DPOAE level and SNR percentiles obtained from normal hearing and hearing loss infant ears (CHL, SNHL, MHL combined) as a function of f2 frequency at Visit 1. The solid line limiting the upper portion of the gray shaded region represents the 90th percentile obtained from the hearing loss infants and the solid line limiting the lower portion of the gray shaded region represents the 10th percentile obtained from normal hearing infants. The gray shaded region represents the area of overlap between the aforementioned percentiles. The 90th and 10th percentiles were selected because the noise distribution for infants is wider and the 5th percentile would result in negative SNRs in the low frequencies. However, alternative percentiles could be selected if desired for clinical application. The dotted line represents the DPOAE level and SNR symmetry cut-off values from Table 3, which correspond to the respective SYM each of their ROC curves at each frequency. DPOAE level and SNRs that are above the symmetry cut-off values (dotted line) are indicative of normal outer hair cell function and those plotted below are consistent with abnormal function. In addition, overall DPOAE level can be further categorized as normal (N) as values that are greater than 90th percentile from hearing loss infants, absent or abnormal (A) if they fall below the 10th percentile from infants with normal hearing, or low (L) if they fall within the gray shaded area of overlap between the normal and impaired distributions.
Figure 4.

DPOAE level (left plot) and SNR (right plot) percentiles are displayed for infants with normal hearing and hearing loss (CHL, SNHL, MHL combined). The upper solid black line represents the 90th percentile from hearing loss infants and the lower solid black line represents the 10th percentile from normal hearing infants. The gray shaded region represents the area of overlap between the distributions of the 90th percentile from hearing loss infants and the 10th percentile obtained from normal-hearing infants at approximately 1 month of age. The black dotted line represents the DPOAE level and SNR symmetry cut-off values from Table 3. DPOAE level and SNRs that are above the symmetry cut-off values (dotted line) are consistent with normal outer hair cell function and those plotted below are consistent with abnormal function. In addition, overall DPOAE level can be further categorized as normal (N), low (L), or absent or abnormal (A). The percentiles displayed in this figure are reported in the companion paper (Hunter et al., submitted) and Supplemental Digital Content 1
Gorga et al. (1997) reported both the 90th and 95th normal hearing percentiles and the 5th to 10th hearing loss percentiles in their DPOAE study with predominantly adult ears. However, they had a much larger sample size (N = 1267 ears), which resulted in more ears contributing to the 5th and 95th percentiles. In the present study, a higher percentage of infants lacked detectable DPOAEs, so that the 5th percentile was in the range of 0 dB SNR for several frequencies. DPOAE level and SNR percentiles (1st, 5th, 10th, 20th, Median, 80th, 90th, 95th, 99th) for ears with normal hearing are provided in the companion paper (Hunter et al., submitted), and percentiles for ears with hearing loss are provided as Supplemental Digital Content 1. Supplemental Digital Content 2 provides a form that can be used for the clinical interpretation of DPOAEs in infants from birth to 4 months of age.
DISCUSSION
DPOAE Signal and SNR from Infants with Hearing Loss
The present study demonstrated a general trend that infants with hearing loss displayed reduced DPOAE levels and smaller SNRs compared to infants with normal hearing. However, there was not a complete separation in DPOAE level and SNR values between the two groups, i.e., the hearing loss and normal hearing distributions overlapped (Figs. 1 and 2). This overlap was more pronounced in the low to mid frequencies (1 – 2 kHz) with greater separation obtained at higher test frequencies (3 – 8 kHz). For example, at 8 kHz, there was a clear separation in mean DPOAE level between infants with NH and CHL and a clear separation in SNR between the NH group and either of the CHL and SNHL/MHL groups. However, for DPOAEs at 1 kHz, the mean levels were 8.9, 8.7, and 11.6 dB SPL, and the mean SNRs were 2.2, 0.9, and 3.3 dB for the NH, CHL, and SNHL/MHL groups, respectively.
Ambient Absorbance
By comparing DPOAE and ambient absorbance data in infants with NH, SNHL, and CHL/MHL, the results indicate that the presence of a conductive component to any hearing loss might be predicted using an absorbance test, once the ear was predicted to have some kind of hearing loss based on the DPOAE test. Therefore, when measuring DPOAEs, it is recommended that wideband absorbance be included in the test battery to determine if there is a conductive component to the hearing loss. Because wideband absorbance contains information about middle-ear transmission in the same frequency region as the DPOAE test, it is highly relevant to interpretation of results. Information about the status of the middle ear combined with DPOAE responses would guide clinicians during subsequent audiological testing and help maximize the information obtained during the appointment. For example, if DPOAEs are abnormal and absorbance is low, during ABR testing the clinician may lower the intensity in smaller step sizes or move to bone conduction testing sooner depending on infant state.
Single-Frequency Receiver Operator Characteristic (ROC) Curves
Since there was an overlap in the normal and impaired distributions at all f2 frequencies, it is not possible to select a DPOAE level and SNR cut-off value for which no diagnostic errors would occur. DPOAE fine structure may be partially responsible for the overlap in distributions and the variable correlations between DPOAE level and audiometric thresholds (Heitmann et al. 1996; Talmadge et al. 1999). Consistent with adult data, DPOAE test performance in infant ears, as assessed by the AUC value (see Table 3), was highly frequency-dependent. DPOAEs were more accurate in the mid to high f2 frequencies (≥ 3 kHz) with poorer identification at lower f2 test frequencies (≤ 2 kHz). Poorer test performance at 1 and 1.5 kHz was associated with reduced SNRs, see Figure 1, bottom panel (Brown et al. 2000).
Gorga et al. (1997) reported AUC values that ranged from 0.78 to 0.95 for DPOAE level and 0.83 to 0.94 for DPOAE SNR. Their study excluded ears with an air-bone audiometric gap of 10 dB or more. With the exception of 8 kHz, Gorga et al. (1997) reported AUC values that ranged from 0.03 to 0.3 higher than the present study. The largest difference was observed at 1 kHz where Gorga et al. reported AUC values of 0.78 and 0.83 for DPOAE level and SNR respectively compared to the present results of 0.48 and 0.54. At 8 kHz, Gorga et al. reported a decrease in test performance with AUCs of 0.83 and 0.84 for DPOAE level and SNR respectively. In contrast, the present study reported the best test performance at 8 kHz with AUC values of 0.91 and 0.94 for DPOAE level and SNR. A major factor in this difference in test performance was age: the youngest subject tested in Gorga et al. (1997) was 1.3 years old, while the oldest subject in the present study was 4.1 months of age. Thus, there was no overlap between age groups in these two studies. Other possible factors are that conductive-loss ears were excluded from the Gorga et al. study but were included in the present study, and noise levels were higher in infants than adults, especially at 1 kHz. Acoustic standing wave effects are significant in adult ear canals above 2 kHz, whereas they are small in infant ear canals at all frequencies up to 8 kHz. Thus, the test performance difference at 8 kHz between the adult and infant studies may be due to stimulus level differences between adult and infant ears, which would depend on the details of calibration.
DPOAE test performance was very similar for DPOAE level and SNR, although SNR resulted in slightly higher AUC values. Gorga et al. (1997) reported that the AUCs based on SNR data were higher for all test frequencies from 0.75 to 8 kHz with the exception of 1.5 and 4 kHz. The present results were similar, with higher AUCs based on SNR data at all test frequencies from 1 to 8 kHz with the exception of 2 and 5.5 kHz. Poorer performance for DPOAE level was likely due to the influence of ears with small SNRs, which were associated with a DPOAE level dominated by noise. However, any performance advantage for using only SNR was small. This is not surprising because DPOAE level and SNR are not independent. Irrespective of those differences, the present study combined DPOAE data on level and SNR in order to classify each ear into NH or hearing-loss groups. This means that there is no need to choose only one of these test variables.
Multi-frequency DPOAE Level and SNR Analyses
Multi-frequency analysis rules are recommended to allow clinical interpretation of DPOAE responses, instead of single-frequency interpretation. The present results support the use of a multi-frequency criteria, requiring 3 out of 5 frequencies from 2 to 8 kHz or 3 out of 4 frequencies between 3 to 8 kHz to pass both the DPOAE level and SNR using the symmetry cut-off values (see Table 3). Excluding 2 kHz from the multi-frequency analysis provides a 6 % increase in specificity with minimal change in sensitivity. Multi-frequency analysis could be combined with reflectance test data to classify ears as having a conductive component to the hearing loss (CHL or MHL). For example, if both the DPOAE level and SNR are a pass at 3 of 5, or 3 of 4 test frequencies, the clinician could report that DPOAEs are consistent with overall normal OHC function within the test frequency region. However, if the DPOAE level and SNR do not meet the 3 of 5 or 3 of 4 recommendation, the clinician could infer that DPOAE results are consistent with at least a mild hearing loss in that ear at a minimum of one frequency region. Furthermore, if absorbance results are normal, the infant would be considered to be at a high risk for a more permanent hearing loss.
DPOAEs in Infants Compared to DPOAEs in Adults
Clinically, the 90th percentile from hearing loss and 5th percentile from normal hearing individuals are most commonly used for DPOAE level interpretation (Cunningham 2011; Gorga et al. 1997). To determine how infant DPOAE levels would be classified compared to the adult norms from Gorga et al. (1997), individual DPOAE levels from infants diagnosed with hearing loss plotted over the normal, abnormal, and borderline ranges from Gorga et al. (1997) in Figure 5. The borderline range is indicated by the gray shaded area and refers to the area of uncertainty for which the clinician is unable to assign status of normal or loss to the DPOAE response. DPOAE levels plotted above the gray shaded area are in the normal range (> 90th percentile from hearing loss individuals), and DPOAE levels plotted below the gray shaded area are in the abnormal range (< 5th percentile from NH individuals).
Figure 5.

DPOAE levels from infants diagnosed with hearing are plotted as a function of f2 frequency over the normal, abnormal, and borderline ranges from Gorga et al. (1997). The border line range is indicated by the dark gray shaded area. DPOAE levels plotted above the gray shaded area are in the normal range (> 90th percentile from hearing loss individuals), and DPOAE levels plotted below the gray shaded area are in the abnormal range (< 5th percentile from NH individuals).
The borderline range is indicated by the gray shaded area and refers to the area of uncertainty for which the clinician is unable to assign status of normal or abnormal to the DPOAE response.
When using Gorga et al. (1997) norms for infant DPOAE level interpretation, a significant number of DPOAE data points from hearing loss ears would be classified as normal. The percentage of ears misclassified varied as a function of frequency, with the majority of ears misclassified at 4 kHz (65%) and 8 kHz (43%). However, when using Gorga et al. (1997) SNR norms, only 4 to 5 percent of ears were misclassified at 2, 3, and 5.5 kHz and no ears were misclassified at 4 and 8 kHz. This is due to the higher DPOAE noise levels in infants compared to adults that is not offset by an equivalent increase in mean DPOAE levels (Hunter et al, submitted). This results in smaller SNRs in infants compared to adults. Our results further confirm that interpretation of infant DPOAEs needs to be conducted with age appropriate norms, particularly for level.
Case Studies
In Figure 1, several infants with hearing loss had DPOAE levels and SNRs that were at or above the 90th percentile of the NH group. These three infants were identified in the figure by numerical values (i.e., 1, 2 and 3) next to their DPOAE level and SNR data points and are discussed below as Case study 1, 2 and 3 respectively.
Case Study 1
Infant # 1 had several risk factors for hearing loss including hyperbilirubinemia, ototoxic medications, low birth weight (<1500 grams) and NICU stay (> 5 days). The infant was diagnosed with a MHL via ABR with air-conduction thresholds of 60 dB nHL at 1 kHz and 40 dB nHL at 4 kHz. ABR bone-conduction thresholds were not able to be obtained, however, ambient absorbance results displayed in Figure 6A show normal to high absorbance from 0.25 to 0.7 and low/abnormal absorbance from 1-8 kHz. Figure 6B displays DPOAE level and SNR values from infant #1 plotted over 1 month normative data (90th percentile from hearing loss infants to 10th percentile from normal hearing infants) and symmetry cut-off values. Despite the diagnosis of a MHL, infant #1 displayed high DPOAE levels at most DPOAE f2 test frequencies with responses well above the symmetry cut-off values however, DPOAE SNR levels at 4 of 5 test frequencies from 2-8 kHz were below the symmetry cut-off values. When DPOAE level and SNR symmetry cut-off criteria were used to determine overall DPOAE status, infant #1 passed the DPOAE level at all test frequencies but failed SNR at all frequencies from 3 to 8 kHz. Therefore, in the multi-frequency analysis using both DPOAE level and SNR criteria, DPOAE responses for infant #1 were correctly identified as abnormal. The MHL was confirmed with VRA air-conduction thresholds that ranged from 55 to 75 dB HL with a 30 dB air-bone gap at 1 kHz. The higher noise levels could be due to excessive fussiness during DPOAE measurement. If noise was the issue during testing, the clinician could indicate that the high DPOAE level and thus low SNR were likely due excessive noise and that repeated DPOAE testing would be recommended. This case illustrates why evaluation of SNR is first needed to determine if the DPOAE levels can be properly interpreted.
Figure 6.
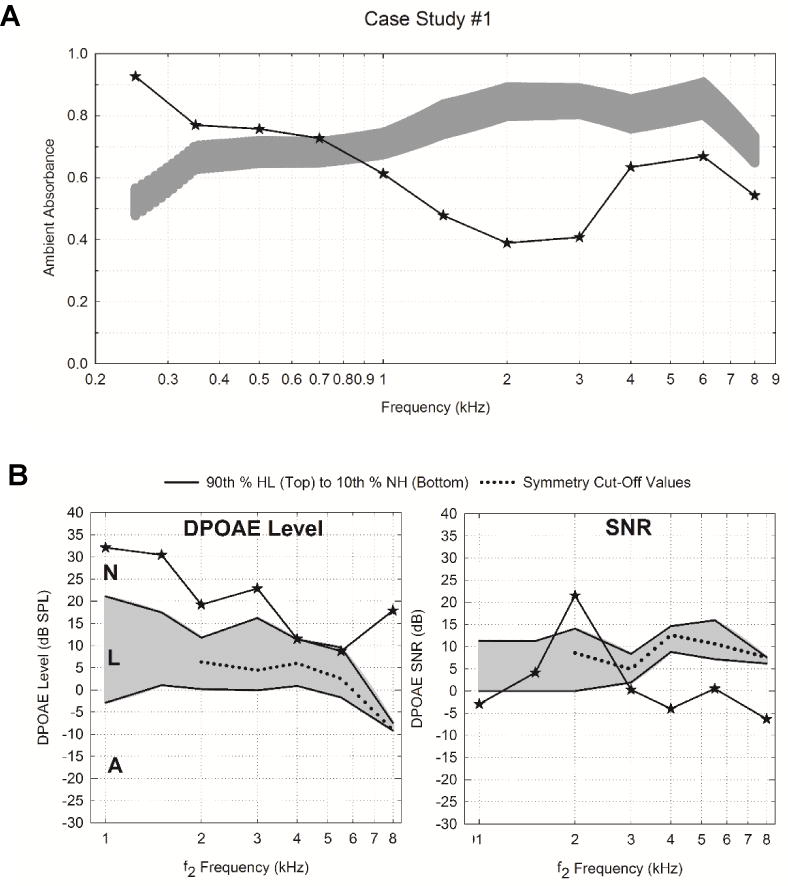
Audiologic test results for Infant #1 including ambient absorbance and DPOAE level and SNR responses. Panel A displays ambient absorbance as a function of frequency (0.25 to 8 kHz). The light gray shaded region represents normative range based on the model mean estimated 95 percent confidence intervals obtained from normal infants (Hunter et al., 2015). Panel B displays DPOAE level and SNR values obtained at the same study visit. The gray shaded region represents the area of overlap between the distributions of the 90th percentile from hearing loss infants and the 10th percentile obtained from normal-hearing infants at approximately 1 month of age. DPOAE level and SNRs that are above the symmetry cut-off values (dotted line) are consistent with normal outer hair cell function and those plotted below are consistent with abnormal function. In addition, overall DPOAE level can be further categorized as normal (N), low (L), or absent or abnormal (A).
Case Study 2
Infant #2 had no risk factors for hearing loss and was diagnosed with a MHL via ABR with air-conduction thresholds of 70 dB nHL at 1 and 4 kHz with a 30 dB air-bone gap at 1 kHz. Ambient absorbance was extremely low from 0.25 to 8 kHz (Figure 7A). DPOAE responses displayed in Figure 7B show a very high DPOAE level (48.0 dB SPL) and SNR (40.5 dB) at 3 kHz which could be an example of a system malfunction, whether due to probe distortion or some other artifact. It is unlikely due to spontaneous OAEs, as ABR thresholds were 70 dB nHL at 1 and 4 kHz. When DPOAE level and SNR symmetry cut-off criteria were used to determine overall DPOAE status, infant #2 only passed DPOAE level at 3 and 4 kHz and passed DPOAE SNR at 3 and 5.5 kHz. In the multi-frequency analysis, infant #2 only passed both DPOAE level and SNR criteria at 3 kHz, therefore, DPOAE responses did not meet the 3 of 5 criteria and were correctly identified as consistent with abnormal OHC function. If abnormally high DPOAE responses are observed during testing, it is recommended that DPOAE testing be repeated to confirm results.
Figure 7.

Audiologic test results for Infant #2 including ambient absorbance (Panel A) and DPOAE level and SNR responses (Panel B). See Figure 6 for a detailed description of shaded regions, symmetry cut-off values, and abbreviations.
Case Study 3
Infant #3 had no risk factors for hearing loss. ABR air-conduction thresholds were 60 dB nHL at 0.5, 1, 2 and 4 kHz with a 10 dB ABG at 4 kHz. Mixed hearing loss was confirmed with VRA in a clinical audiological evaluation around 9 to 12 months of age. Ambient absorbance was low from 0.25 to 1 and within normal limits from 1-8 kHz (Figure 8A). DPOAE responses displayed in Figure 8B show a DPOAE level and SNR at 5.5 kHz of 10.2 dB SPL and 27.2 dB respectively, which were well above the symmetry cut-off values of 2.5 dB and 10.6 dB, respectively. In addition, the DPOAE level at 4 kHz was 5.94 dB, which barely exceeded the symmetry cut-off point of 5.9 dB. Using multi-frequency rules, infant #3 passed both DPOAE level and SNR at 4.0 and 5.5 kHz, but did not pass at all other frequencies (2, 3, and 8 kHz). This case study highlights the importance of requiring the majority of test frequencies (3 out of 4, or 3 out of 5 frequencies) to pass both DPOAE level and SNR. If a criterion of 2 out of 4 frequencies was implemented, this infant with a 60 dB nHL MHL would be incorrectly classified as normal.
Figure 8.

Audiologic test results for Infant #3 including ambient absorbance (Panel A) and DPOAE level and SNR responses (Panel B). See Figure 6 for a detailed description of shaded regions, symmetry cut-off values, and abbreviations.
The aforementioned cases highlight the importance of using both DPOAE level and SNR, and using multi-frequency rules when interpreting DPOAE responses for an overall judgement of DPOAE responses. The present study is in agreement with recommendations that SNR levels be evaluated first to determine if the response is interpretable, then to interpret DPOAE level to evaluate the presence/absence of the response. Had only level been used, these infants may have been incorrectly classified as normal at some frequencies.
Limitations and Future Directions
There are several limitations in the current study. Although infants that did not pass their newborn hearing screening at the birth hospital were preferentially enrolled, the majority of infants included in the study had normal hearing. Therefore, the prediction of hearing loss analyses was based on a relatively small number of infants with hearing loss, with the majority having a CHL. Replication in studies that include more infants with various types (CHL, SNHL, and MHL) and degrees of hearing loss would be desirable. Increasing the sample size would also allow for a cost analysis (false positive and false negative) to be completed. The present study analyzed only the wideband absorbance test at ambient pressure in the ear canal. A future direction would be to compare the ambient absorbance test with a wideband tympanometric absorbance test at varying air pressures in the ear canal, which may provide additional information of diagnostic relevance. Lastly, although more precise ABR threshold testing is desirable, it would significantly increase the overall test time.
CONCLUSION
Hearing impairment is one of the most common disabilities reported in infants. Early identification of hearing loss combined with immediate age-appropriate intervention is essential for optimal speech and language development. DPOAEs are a commonly used diagnostic tool to evaluate cochlear function, however, in order to maximize test performance, age appropriate normative data are essential. This is the first study to report DPOAE level and SNR symmetry cut-off values that can be used to evaluate the presence of hearing loss from birth to 4 months of age. Inasmuch as the AUC values from 1 – 1.5 kHz were poorer, the 2 – 8 kHz range is recommended for the most accurate prediction of hearing loss and DPOAE test performance is improved by including higher f2 test frequencies. A multi-frequency criterion of 3 out of 4 frequencies for the “4 Frequency Analysis (3, 4, 5.5, and 8 kHz)” or 3 out of 5 frequencies for the “5 Frequency Analysis (2, 3, 4, 5.5, and 8 kHz)” passing both SNR and DPOAE level at or above the symmetry cut-off values is recommended for clinical interpretation of DPOAEs in infants. DPOAEs may be used to help determine the presence of mild and greater degrees of hearing loss, however, absorbance measures would be helpful to verify type of hearing loss. In addition, threshold tests such as the ABR or a behavioral audiogram is necessary to confirm the degree, type and configuration of hearing loss to guide rehabilitation plans.
Supplementary Material
Supplemental Digital Content 1. Table that displays the DPOAE level and SNR percentiles (5th, 10th, 20th, Median, 80th, 90th, 95th) for infants with hearing loss at 1 month of age.Pdf.
Supplemental Digital Content 2. Clinical interpretation of DPOAEs in infants from birth to 4 months of age.pdf.
Acknowledgments
Portions of this study were presented as poster presentations at the American Academy of Audiology (2014) and American Auditory Society (2016). D.H.K. is involved in commercializing devices to assess middle-ear function. The efforts of Alaaelddin Elsayed, MD, AuD, Leigh Shaid, AuD, several research coordinators, and the families who participated is gratefully acknowledged. We are appreciative of the anonymous reviewers that substantially improved the manuscript.
Conflicts of Interest and Source of Funding:
This research was supported by the National Institute of Deafness and other Communication Disorders of the National Institutes of Health under Award Number R01 DC010202 and an ARRA supplement (DC010202-01S1). Co-author Keefe is involved in commercializing devices to assess middle-ear function in infants. The content is solely the responsibility of the authors and does not necessarily represent the official views of the National Institute of Health. The content of this article does not represent the views of the Department of Veterans Affairs or of the United States Government.
Abbreviations
- ANOVA
Analysis of Variance
- ABR
Auditory Brainstem Response
- AUC
Area Under the ROC Curve
- CHL
Conductive Hearing Loss
- DPOAE
Distortion Product Otoacoustic Emission
- HL
Hearing Loss
- MHL
Mixed Hearing Loss
- NICU
Neonatal Intensive Care Unit
- NH
Normal Hearing
- OHC
Outer Hair Cell
- SYM
Point of Symmetry
- ROC
Receiver Operator Characteristic
- SNHL
Sensorineural Hearing Loss
- SNR
Signal-to-Noise Ratio
- SPL
Sound Pressure Level
- TEOAE
Transient Evoked Otoacoustic Emission
- VRA
Visual Reinforcement Audiometry
- WBN
Well-Baby Nursery
Footnotes
Author contributions
C.M.B. performed experiments, analyzed data, and co-wrote the paper. L.L.H. designed and performed experiments, co-wrote the paper, and provided interpretive analysis and critical revision to the paper. D.H.K. and M.P.F. designed experiments, and provided interpretative analysis and critical revision to paper. D.K.B helped designed and perform experiments and provided interpretative analysis and critical revision to paper. A.M. assisted in enrollment and data analysis as part of her AuD capstone. D.F.F. designed experiments, and provided interpretative analysis and critical revision to paper. L.L. provided statistical analysis and critical revision to the paper. All authors discussed the results and implications and commented on the manuscript at all stages. Portions of this study were presented as poster presentations at the American Academy of Audiology (2014) and American Auditory Society (2016).
References
- Abdala C. Distortion product otoacoustic emission (2f1-f2) amplitude as a function of f2/f1 frequency ratio and primary tone level separation in human adults and neonates. J Acoustic Soc Am. 1996;100:3726–3740. doi: 10.1121/1.417234. [DOI] [PubMed] [Google Scholar]
- Abdala C, Keefe DH. Effects of middle-ear immaturity on distortion product otoacoustic emission suppression tuning in infant ears. J Acoust Soc Am. 2006;120:3832–3842. doi: 10.1121/1.2359237. [DOI] [PubMed] [Google Scholar]
- Abdala C, Oba SI, Ramanathan R. Changes in the DP-gram during the preterm and early postnatal period. Ear Hear. 2008;29:512–523. doi: 10.1097/AUD.0b013e31816c40bb. [DOI] [PMC free article] [PubMed] [Google Scholar]
- American Academy of Audiology. Audiologic Guidelines for the Assessment of Hearing in Infants and Young Children. 2012 from http://www.audiology.org/publications-resources/document-library/pediatric-diagnostics.
- Avan P, Bonfils P. Frequency specificity of human distortion product otoacoustic emissions. Audiology. 1993;32:12–26. doi: 10.3109/00206099309072924. [DOI] [PubMed] [Google Scholar]
- Bergman BM, Gorga MP, Neely ST, et al. Preliminary descriptions of transient-evoked and distortion-product otoacoustic emissions from graduates of an intensive care nursery. J Am Acad Audiol. 1995;6:150–162. [PubMed] [Google Scholar]
- Bonfils P, Avan P, Francois M, et al. Distortion-product otoacoustic emissions in neonates: normative data. Acta Otolaryngol. 1992;112:739–744. doi: 10.3109/00016489209137468. [DOI] [PubMed] [Google Scholar]
- Brown AM, Sheppard SL, Russell PT. Acoustic distortion products (ADP) from the ears of term infants and young adults using low stimulus levels. Br J Audiol. 1994;28:273–280. doi: 10.3109/03005369409086577. [DOI] [PubMed] [Google Scholar]
- Brown DK, Tobolski CJ, Shaw GR, et al. Towards Determining Distortion Product Otoacoustic Emission Protocols for Newborn Hearing Screening. Journal of Speech-Language Pathology and Audiology. 2000;24:68–73. [Google Scholar]
- Cunningham RF. Otoacoustic Emissions: Beyond Newborn Hearing Screening. 2011:2016. from http://www.audiologyonline.com/articles/otoacoustic-emissions-beyond-newborn-hearing-838.
- Dorn PA, Piskorski P, Gorga MP, et al. Predicting audiometric status from distortion product otoacoustic emissions using multivariate analyses. Ear Hear. 1999;20:149–163. doi: 10.1097/00003446-199904000-00006. [DOI] [PubMed] [Google Scholar]
- Elsayed AM, Hunter LL, Keefe DH, et al. Air and Bone Conduction Click and Tone-Burst Auditory Brainstem Thresholds Using Kalman Adaptive Processing in Nonsedated Normal-Hearing Infants. Ear Hear. 2015;36:471–481. doi: 10.1097/AUD.0000000000000155. [DOI] [PMC free article] [PubMed] [Google Scholar]
- Gaskill SA, Brown AM. The behavior of the acoustic distortion product, 2f1-f2, from the human ear and its relation to auditory sensitivity. J Acoust Soc Am. 1990;88:821–839. doi: 10.1121/1.399732. [DOI] [PubMed] [Google Scholar]
- Gorga MP, Dierking DM, Johnson TA, et al. A validation and potential clinical application of multivariate analyses of distortion-product otoacoustic emission data. Ear Hear. 2005;26:593–607. doi: 10.1097/01.aud.0000188108.08713.6c. [DOI] [PMC free article] [PubMed] [Google Scholar]
- Gorga MP, Neely ST, Dorn PA. Distortion product otoacoustic emission test performance for a priori criteria and for multifrequency audiometric standards. Ear Hear. 1999;20:345–362. doi: 10.1097/00003446-199908000-00007. [DOI] [PubMed] [Google Scholar]
- Gorga MP, Neely ST, Ohlrich B, et al. From laboratory to clinic: a large scale study of distortion product otoacoustic emissions in ears with normal hearing and ears with hearing loss. Ear Hear. 1997;18:440–455. doi: 10.1097/00003446-199712000-00003. [DOI] [PubMed] [Google Scholar]
- Gorga MP, Nelson K, Davis T, et al. Distortion product otoacoustic emission test performance when both 2f1-f2 and 2f2-f1 are used to predict auditory status. J Acoust Soc Am. 2000a;107:2128–2135. doi: 10.1121/1.428494. [DOI] [PubMed] [Google Scholar]
- Gorga MP, Norton SJ, Sininger YS, et al. Identification of neonatal hearing impairment: distortion product otoacoustic emissions during the perinatal period. Ear Hear. 2000b;21:400–424. doi: 10.1097/00003446-200010000-00007. [DOI] [PubMed] [Google Scholar]
- Heitmann J, Waldmann B, Plinkert PK. Limitations in the use of distortion product otoacoustic emissions in objective audiometry as the result of fine structure. Eur Arch Otorhinolaryngol. 1996;253:167–171. doi: 10.1007/BF00615115. [DOI] [PubMed] [Google Scholar]
- Hunter LL, Keefe DH, Feeney MP, et al. Longitudinal development of wideband reflectance tympanometry in normal and at-risk infants. Hear Res. 2015;340:3–14. doi: 10.1016/j.heares.2015.12.014. [DOI] [PMC free article] [PubMed] [Google Scholar]
- JCIH. Year 2007 position statement: principles and guidelines for early hearing detection and intervention programs. Pediatrics. 2007;120:898–921. doi: 10.1542/peds.2007-2333. [DOI] [PubMed] [Google Scholar]
- Keefe DH, Abdala C. Theory of forward and reverse middle-ear transmission applied to otoacoustic emissions in infant and adult ears. J Acoust Soc Am. 2007;121:978–993. doi: 10.1121/1.2427128. [DOI] [PMC free article] [PubMed] [Google Scholar]
- Keefe DH, Bulen JC, Arehart KH, et al. Ear-canal impedance and reflection coefficient in human infants and adults. J Acoust Soc Am. 1993;94:2617–2638. doi: 10.1121/1.407347. [DOI] [PubMed] [Google Scholar]
- Keefe DH, Folsom RC, Gorga MP, et al. Identification of neonatal hearing impairment: ear-canal measurements of acoustic admittance and reflectance in neonates. Ear Hear. 2000;21:443–461. doi: 10.1097/00003446-200010000-00009. [DOI] [PubMed] [Google Scholar]
- Keefe DH, Gorga MP, Neely ST, et al. Ear-canal acoustic admittance and reflectance measurements in human neonates. II. Predictions of middle-ear in dysfunction and sensorineural hearing loss. J Acoust Soc Am. 2003a;113:407–422. doi: 10.1121/1.1523388. [DOI] [PubMed] [Google Scholar]
- Keefe DH, Hunter LL, Feeney MP, et al. Procedures for ambient-pressure and tympanometric tests of aural acoustic reflectance and admittance in human infants and adults. J Acoust Soc Am. 2015;138:3625–3653. doi: 10.1121/1.4936946. [DOI] [PMC free article] [PubMed] [Google Scholar]
- Keefe DH, Zhao F, Neely ST, et al. Ear-canal acoustic admittance and reflectance effects in human neonates. I. Predictions of otoacoustic emission and auditory brainstem responses. J Acoust Soc Am. 2003b;113:389–406. doi: 10.1121/1.1523387. [DOI] [PubMed] [Google Scholar]
- Lafreniere D, Jung MD, Smurzynski J, et al. Distortion-product and click-evoked otoacoustic emissions in healthy newborns. Arch Otolaryngol Head Neck Surg. 1991;117:1382–1389. doi: 10.1001/archotol.1991.01870240074012. [DOI] [PubMed] [Google Scholar]
- Lasky RE. Distortion product otoacoustic emissions in human newborns and adults. I. Frequency effects. J Acoust Soc Am. 1998;103:981–991. doi: 10.1121/1.421215. [DOI] [PubMed] [Google Scholar]
- Lasky RE, Perlman J, Hecox K. Distortion-product otoacoustic emissions in human newborns and adults. Ear Hear. 1992;13:430–441. doi: 10.1097/00003446-199212000-00009. [DOI] [PubMed] [Google Scholar]
- Liu YW, Sanford CA, Ellison JC, et al. Wideband absorbance tympanometry using pressure sweeps: System development and results on adults with normal hearing. Journal of the Acoustical Society of America. 2008;124:3708–3719. doi: 10.1121/1.3001712. [DOI] [PMC free article] [PubMed] [Google Scholar]
- Lonsbury-Martin BL, Martin GK. The clinical utility of distortion-product otoacoustic emissions. Ear Hear. 1990;11:144–154. doi: 10.1097/00003446-199004000-00009. [DOI] [PubMed] [Google Scholar]
- Marchant CD, McMillan PM, Shurin PA, et al. Objective diagnosis of otitis media in early infancy by tympanometry and ipsilateral acoustic reflex thresholds. J Pediatr. 1986;109:590–595. doi: 10.1016/s0022-3476(86)80218-9. [DOI] [PubMed] [Google Scholar]
- Moulin A, Bera JC, Collet L. Distortion product otoacoustic emissions and sensorineural hearing loss. Audiology. 1994;33:305–326. doi: 10.3109/00206099409071890. [DOI] [PubMed] [Google Scholar]
- Norton SJ, Gorga MP, Widen JE, et al. Identification of neonatal hearing impairment: summary and recommendations. Ear Hear. 2000a;21:529–535. doi: 10.1097/00003446-200010000-00014. [DOI] [PubMed] [Google Scholar]
- Norton SJ, Gorga MP, Widen JE, et al. Identification of neonatal hearing impairment: evaluation of transient evoked otoacoustic emission, distortion product otoacoustic emission, and auditory brain stem response test performance. Ear Hear. 2000b;21:508–528. doi: 10.1097/00003446-200010000-00013. [DOI] [PubMed] [Google Scholar]
- Paradise JL, Smith CG, Bluestone CD. Tympanometric detection of middle ear effusion in infants and young children. Pediatrics. 1976;58:198–210. [PubMed] [Google Scholar]
- Pepe MS. The statistical evaluation of medical tests for classification and prediction. Oxford New York: Oxford University Press; 2003. [Google Scholar]
- Prieve BA, Fitzgerald TS, Schulte LE. Basic characteristics of click-evoked otoacoustic emissions in infants and children. J Acoust Soc Am. 1997a;102:2860–2870. doi: 10.1121/1.420341. [DOI] [PubMed] [Google Scholar]
- Prieve BA, Fitzgerald TS, Schulte LE, et al. Basic characteristics of distortion product otoacoustic emissions in infants and children. J Acoust Soc Am. 1997b;102:2871–2879. doi: 10.1121/1.420342. [DOI] [PubMed] [Google Scholar]
- Smurzynski J. Longitudinal measurements of distortion-product and click-evoked otoacoustic emissions of preterm infants: preliminary results. Ear Hear. 1994;15:210–223. doi: 10.1097/00003446-199406000-00002. [DOI] [PubMed] [Google Scholar]
- Smurzynski J, Jung MD, Lafreniere D, et al. Distortion-product and click-evoked otoacoustic emissions of preterm and full-term infants. Ear and hearing. 1993;14:258–274. doi: 10.1097/00003446-199308000-00005. [DOI] [PubMed] [Google Scholar]
- Stover L, Gorga MP, Neely ST, et al. Toward optimizing the clinical utility of distortion product otoacoustic emission measurements. J Acoust Soc Am. 1996;100:956–967. doi: 10.1121/1.416207. [DOI] [PubMed] [Google Scholar]
- Talmadge CL, Long GR, Tubis A, et al. Experimental confirmation of the two-source interference model for the fine structure of distortion product otoacoustic emissions. J Acoust Soc Am. 1999;105:275–292. doi: 10.1121/1.424584. [DOI] [PubMed] [Google Scholar]
- Vander Werff KR, Prieve BA, Georgantas LM. Infant air and bone conduction tone burst auditory brain stem responses for classification of hearing loss and the relationship to behavioral thresholds. Ear Hear. 2009;30:350–368. doi: 10.1097/AUD.0b013e31819f3145. [DOI] [PubMed] [Google Scholar]
- Widen JE, Folsom RC, Cone-Wesson B, et al. Identification of neonatal hearing impairment: hearing status at 8 to 12 months corrected age using a visual reinforcement audiometry protocol. Ear Hear. 2000;21:471–487. doi: 10.1097/00003446-200010000-00011. [DOI] [PubMed] [Google Scholar]
Associated Data
This section collects any data citations, data availability statements, or supplementary materials included in this article.
Supplementary Materials
Supplemental Digital Content 1. Table that displays the DPOAE level and SNR percentiles (5th, 10th, 20th, Median, 80th, 90th, 95th) for infants with hearing loss at 1 month of age.Pdf.
Supplemental Digital Content 2. Clinical interpretation of DPOAEs in infants from birth to 4 months of age.pdf.