Abstract
Tuberous sclerosis complex (TSC), a heritable neurodevelopmental disorder, is caused by mutations in the TSC1 or TSC2 genes. To date, there has been little work to elucidate regional TSC1 and TSC2 gene expression within the human brain, how it changes with age, and how it may influence disease. Using a publicly available microarray dataset, we found that TSC1 and TSC2 gene expression was highest within the adult neo-cerebellum and that this pattern of increased cerebellar expression was maintained throughout postnatal development. During mid-gestational fetal development, however, TSC1 and TSC2 expression was highest in the cortical plate. Using a bioinformatics approach to explore protein and genetic interactions, we confirmed extensive connections between TSC1/TSC2 and the other genes that comprise the mammalian target of rapamycin (mTOR) pathway, and show that the mTOR pathway genes with the highest connectivity are also selectively expressed within the cerebellum. Finally, compared to age-matched controls, we found increased cerebellar volumes in pediatric TSC patients without current exposure to antiepileptic drugs. Considered together, these findings suggest that the cerebellum may play a central role in TSC pathogenesis and may contribute to the cognitive impairment, including the high incidence of autism spectrum disorder, observed in the TSC population.
Introduction
Tuberous sclerosis complex (TSC), a heritable neurodevelopmental disorder, is caused by mutations in the TSC1 or TSC2 genes, which encode the proteins hamartin and tuberin1. Together, these proteins form a complex that inhibits the growth-regulating mammalian target of rapamycin (mTOR) pathway2. Although the genes and molecular pathways associated with hamartin and tuberin are well known, comparatively less is known about regional patterns of TSC1 and TSC2 gene expression within the human brain.
Accumulating evidence suggests that patterns of regional gene expression guide human neurodevelopment3. Just as regional TSC1 and TSC2 gene expression patterns contribute to the development of tumors and hamartomas elsewhere in the body, we hypothesized that regional TSC1/TSC2 expression in the brain may influence neuroanatomic and cognitive changes associated with tuberous sclerosis. To explore this hypothesis, in this paper we examine patterns of TSC1 and TSC2 expression within the normal human brain and compare them to changes in regional brain morphology in patients with TSC.
Results
TSC1 and TSC2 expression is selectively increased within the cerebellum and neocortex
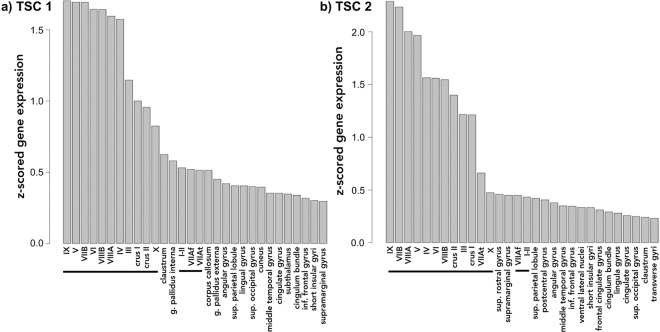
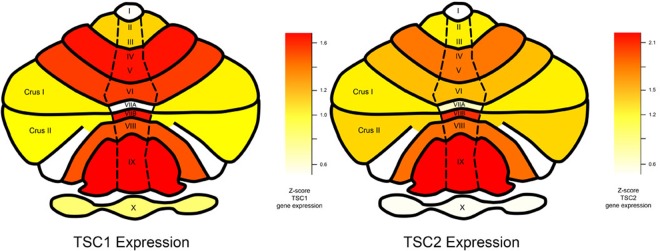
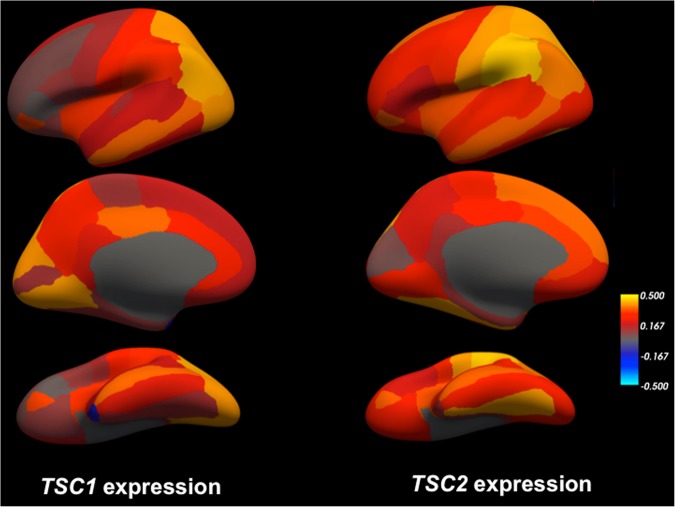
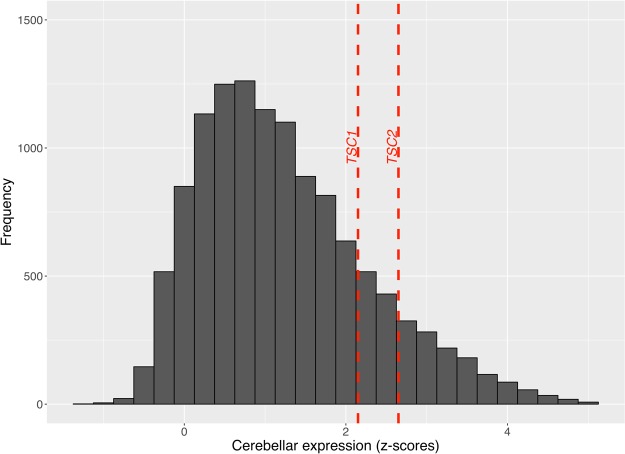
Using a publicly available microarray dataset from the Allen Brain Sciences Institute (www.brain-map.org), we investigated regional gene expression of TSC1 and TSC2 with the goal of leveraging patterns of gene expression to better understand the TSC phenotype (see Methods). Across all brain regions, we found significantly elevated expression within all cerebellar lobules and crus I and II compared to other brain regions (TSC1 t-test p value = 1.16 × 10⁻¹⁵ and TSC2 t-test p value = 2.38 × 10⁻²⁰) (Figs 1 and 2). Compared to subcortical regions (such as the hippocampus), we also found relatively elevated expression within certain cortical areas: the supramarginal gyrus, angular gyrus and superior parietal lobule (TSC1 t-test p value = 3.30 × 10⁻¹² and TSC2 t-test p value = 1.61 × 10⁻¹¹) (Figs 1 and 3). Finally, TSC1 and TSC2 expression within all cerebellar lobules and crus was significantly elevated, even when compared to those supratentorial areas with relatively high expression (TSC1 t-test p value = 2.80 × 10⁻⁸ and TSC2 t-test p value = 1.70 × 10⁻¹²). To evaluate whether elevated cerebellar expression is specific to TSC1 and TSC2, we computed z-scores of expression levels across brain areas for each of the 12,000 + genes within the Allen Brain Atlas database and then examined the distribution of relative cerebellar expression across all genes (Fig. 4). The rightward shift of this distribution reveals that expression of many genes is relatively increased in the cerebellum compared to other brain regions; however, the location of TSC1 and TSC2 within the positive tail of the distribution confirms their greater regional specificity.
Figure 1.
Bar plots illustrating the thirty brain regions demonstrating highest mean regional transcript levels for TSC1 (a) and TSC2 (b) using data from the Allen Brain Science Institute (www.brain-map.org)29. Values represent z-scores averaged across the individual probes and across the 6 postmortem subjects. The horizontal black line highlights cerebellar regions.
Figure 2.
Average regional cerebellar gene expression of TSC1 (left) and TSC2 (right) from all 6 Allen Brain Science Institute postmortem brains (www.brain-map.org)29 mapped onto a pictorial heat-map representation of the cerebellar lobules and crus. As shown in the color scale, red indicates relatively higher average expression (z-scores) and yellow indicates relatively lower average expression.
Figure 3.
Average regional gene expression of TSC1 (left) and TSC2 (right) from all 6 Allen Brain Science Institute postmortem brains (www.brain-map.org)29 mapped into a three-dimensional reconstruction (‘inflated’ view) of the gray/white matter boundary of the cerebral cortex (fsaverage subject from FreeSurfer). Top panel illustrates the lateral view, middle panels illustrate the medial view, and bottom panels illustrate the ventral view of the left cerebral hemisphere. As shown in the color scale, yellow indicates relatively higher expression (z-scores) and blue indicates relatively lower expression.
Figure 4.
Histogram showing the relative (z-scored) cerebellar expression of all 12000 + genes from the Allen Brain Science Institute database (www.brain-map.org)29, depicted by frequency (y-axis) of each z-score of relative cerebellar expression (x-axis). The dashed vertical lines depict z-scores of relative cerebellar expression for TSC1 and TSC2 compared to all other genes. The rightward shift of this distribution reveals that expression of many genes is relatively increased in the cerebellum compared to other brain regions; however, the location of TSC1 and TSC2 within the positive tail of the distribution confirms their greater regional specificity.
We assessed the reproducibility of our cerebellar TSC1 and TSC2 findings using two additional independent gene expression datasets from post-mortem brains: the Genotype-Tissue Expression (GTEx) project4 (n = 125 disease-free adult brains) and UK Brain Expression Consortium (UKBEC)5 (n = 134 disease-free adult brains). Within both the GTEx and UKBEC datasets, across all evaluated regions, we again found the highest TSC1 and TSC2 expression within the cerebellum (Supplemental Figs 1 and 2). Thus, three independent gene expression datasets confirm that that TSC1 and TSC2 gene expression is selectively elevated within the cerebellum.
Assessing regional TSC1 and TSC2 expression during post-natal development
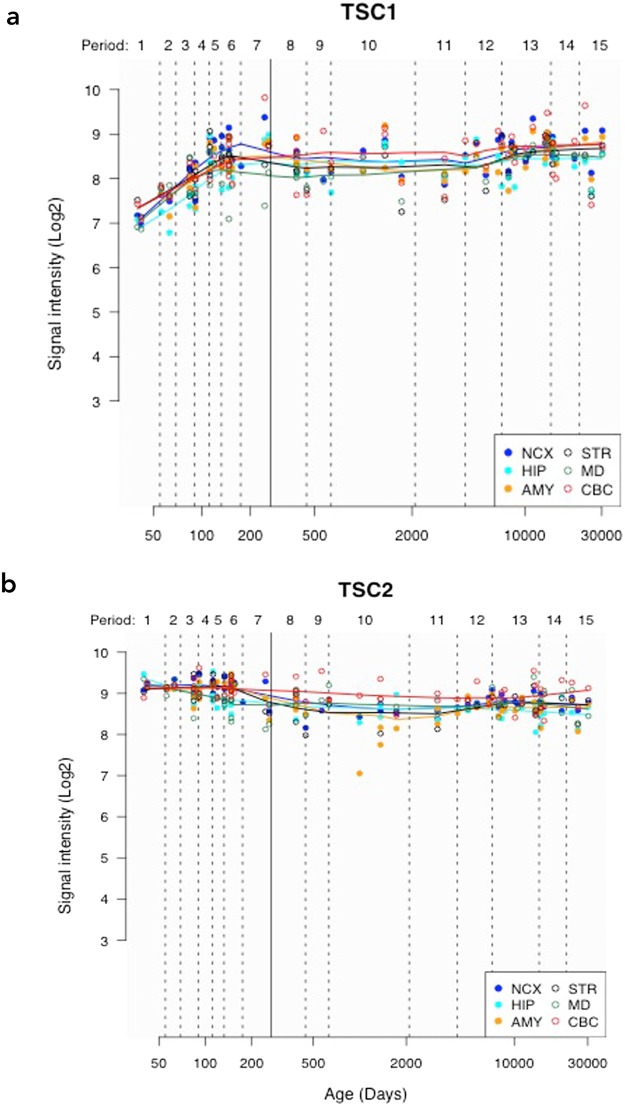
We additionally investigated TSC1 and TSC2 gene expression utilizing a microarray expression data set focused on the developing brain (Kang HJ et al., Nature 2011) (see Methods). Across all evaluated regions, we found the highest TSC1 and TSC2 expression within the cerebellar cortex (CBC) (Fig. 5). Compared to the medial dorsal thalamus, which showed the lowest expression, across all time points, we found significantly elevated expression within the CBC for TSC1 (paired t-test p-value = 0.002) and TSC2 (paired t-test p-value = 2.7 × 10⁻⁵). Using a repeated measure ANOVA, within the CBC, we found marginal evidence for differential TSC1 expression over time (12 PCW to 83 years) (F = 4.03, p = 0.05), but no evidence for differential TSC2 expression (F = 0.03, p = 0.58) over time.
Figure 5.
Line plots showing TSC1 (a) and TSC2 (b) gene expression over time, using data from the Human Brain Transcriptome (http://hbatlas.org/). NCX = neocortex, MD = medial dorsal thalamus, CBC = cerebellar cortex, HIP = hippocampus, STR = striatum and AMY = amygdala. ‘Y-axis shows relative gene expression as Log2 signal intensity assessed from hybridization of cDNA generated from extracted RNA to Affymetrix Human Exon microarrays as detailed in Kang et al., Nature 2011. ‘Period’ refers to periods of human development and adulthood defined in that original paper and chosen to emphasize the timing and progression of major neurodevelopmental events in the Cerebral Cortex.’ X-axis shows post-conception age in days; the solid vertical line indicates the transition between pre-natal and post-natal periods.
Selectively elevated TSC1 and TSC2 expression within the fetal cortical plate and subplate
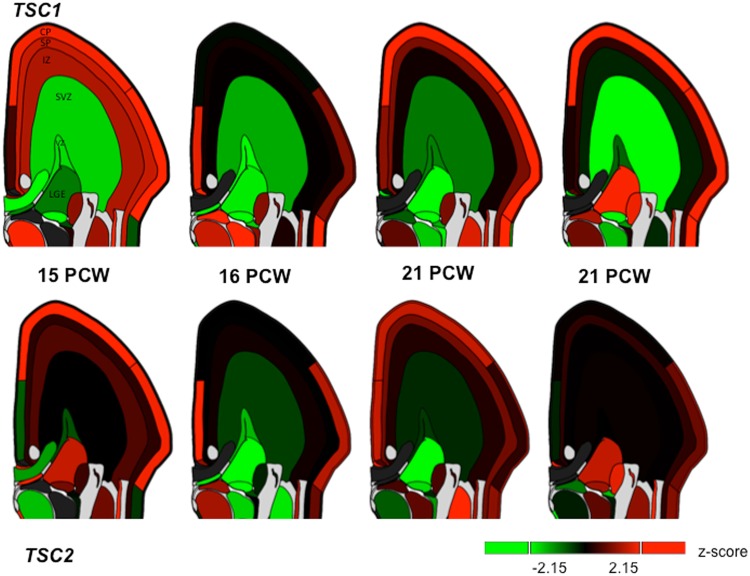
The pathogenic variants and consequent alterations in molecular pathways that result in TSC are set into motion during fetal development; we therefore next examined TSC1 and TSC2 expression in utero using data from the Allen Brain Sciences Institute. Assessing mean TSC1 and TSC2 expression across the 4 mid-gestational fetal brains and across all fetal mitotic and post-mitotic zones, we found the highest expression within the cortical plate (CP) and lowest expression within the subventricular zone (SZ) (Fig. 6). In comparison to the SZ, the CP demonstrated significantly elevated expression (TSC1 t-test p-value = 2.0 × 10⁻³⁰ and TSC2 t-test p-value = 0.002). The subplate (SP), another post-mitotic zone showing high expression, also demonstrated significantly higher expression compared to SZ (TSC1 t-test p-value = 1.3 × 10⁻⁸ and TSC2 t-test p-value = 0.003). Compared to SP, expression within CP was significantly elevated for TSC1 (t-test p-value = 3.2 × 10⁻⁶) but not for TSC2 (t-test p-value = 0.82). Thus, TSC1 and, to a lesser extent, TSC2 gene expression is highest within the cortical plate in the developing fetal brain.
Figure 6.
Regional TSC1 and TSC2 RNA expression within four fetal brains at 15, 16 and 21 weeks post-conception (PCW) from the Allen Brain Sciences Institute database (http://www.brainspan.org/lcm/)31. VZ = ventricular zone, SZ = subventricular zone, IZ = intermediate zone, SP = subplate, and CP = cortical plate.
Protein-protein and co-expression networks for TSC1 and TSC2
To evaluate potential genetic interactions, co-expression, co-localization and protein domain similarity for TSC1 and TSC2, we used GeneMANIA (www.genemania.org), a bioinformatics method for functional prediction of gene networks based on genes and gene sets6. In addition to visualizing the composite gene network, we also assessed the weights of individual network components7.
We found that TSC1 and TSC2 showed strong physical interactions, predicted interaction, and co-expression with several genes and proteins (Fig. 7). As expected, across all analyses, we found the strongest network weights (>0.60) between TSC1, TSC2 and other members of the P13K/AKT/mTOR pathway, namely mTOR, c12orf5/TIGAR, RPTOR, MLST8, AKT1S1, RHEB, RPS6KB1, DEPTOR, EIF4EBP1 and RICTOR (See supplemental materials for details about these individual genes and their protein products). We subsequently evaluated the regional expression patterns of several of these mTOR pathway genes using the GTEx database4. We found that multiple mTOR pathway genes from the TSC1 and TSC2 gene network, including RICTOR, MLST8, RPS6KB1 and mTOR itself, also demonstrate selectively elevated cerebellar expression (Supplemental Fig. 3a–d), suggesting molecular enrichment for the mTOR pathway as a whole within the cerebellum.
Figure 7.
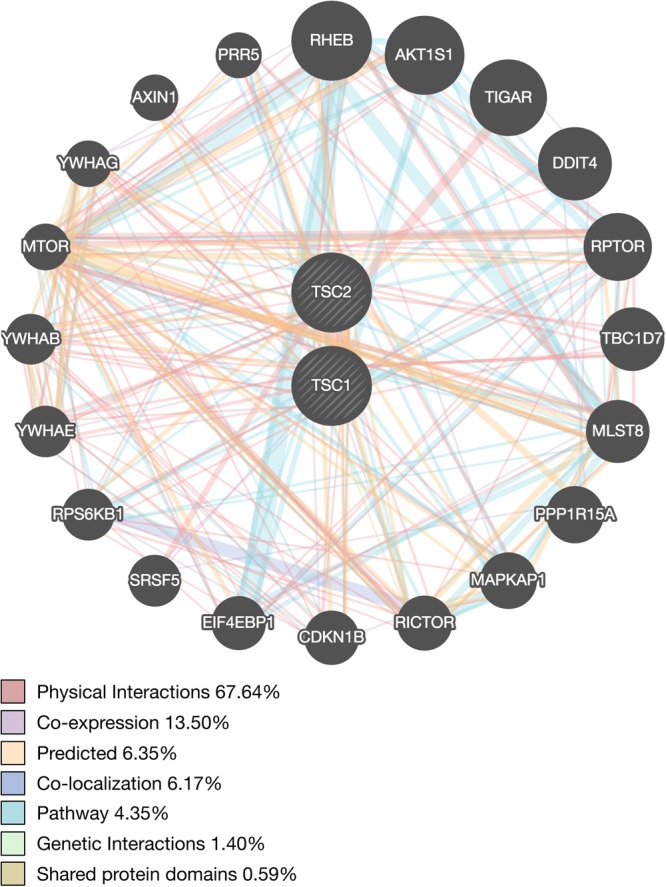
Network interaction graph illustrating physical interactions (pink), co-expression (purple), predicted (orange), pathway (aqua), co-localization (blue), genetic interactions (green) and shared protein domains (khaki) for TSC1 and TSC2 assessed using GeneMANIA (www.genemania.org).
In vivo morphometric analysis of cerebellar volume in pediatric patients with TSC
To evaluate potential in vivo cerebellar abnormalities in pediatric patients with TSC we performed morphometric analysis of cerebellar lobule volumes in a group of 28 patients with TSC from our institution (see Methods).
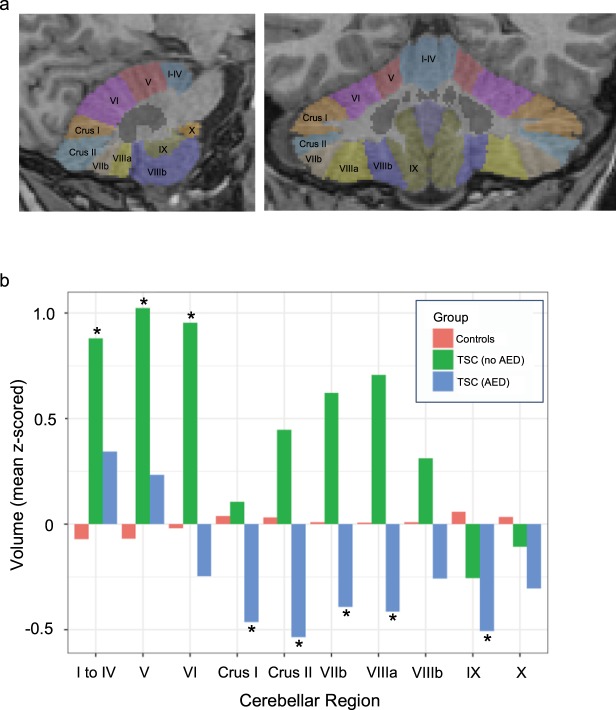
Epilepsy is common amongst TSC patients and anti-epileptic drug (AED) exposure is known to correlate with cerebellar atrophy, either as a direct effect or as an indirect consequence of seizure severity8,9. For this reason, we separated our TSC population into two groups according to history of active anti-epileptic drug use at the time of MRI scanning, assessed through review of medical records. Others have previously reported cerebellar cortical volume loss in patients with TSC10. In our TSC population, the 18 TSC patients with exposure to AEDs had decreased cerebellar volumes compared to normal age-matched controls (Fig. 8b, blue bars), with most areas reaching significance at nominal p-value < 0.05 (derived from a linear regression model that controlled for age and gender, see Supplemental Table 1a). Interestingly, however, the 10 TSC patients without exposure to AEDs had significantly increased cerebellar volumes compared to controls in multiple cerebellar lobules and showed a consistent trend towards increased volumes across almost all regions (Fig. 8b, green bars; Supplemental Table 1b).
Figure 8.
(a) Sagittal (left) and Coronal (right) images of a representative subject’s brain showing individual cerebellar lobules segmented using the SUIT (‘spatially unbiased infra-tentorial template‘) software package33. (b) Bar graphs show mean volumes of each cerebellar region for each of 3 groups: Controls (red) (n = 200), TSC patients not taking anti-epileptic drugs (AEDs) green (n = 10), and TSC patients taking AEDs (blue) (n = 18). Volumes of each cerebellar region were z-scored across all subjects/groups before computing group averages. Asterisks (*) highlight regions/groups where TSC volumes differ significantly from those of the control group at a nominal p-value < 0.05 derived from a linear regression model of group effects that controls for age and gender (see Supplemental Table 1a,b for individual model results).
Discussion
In this study, we found that TSC1 and TSC2, the genes responsible for TSC, are expressed in the brain in a regionally specific pattern that changes throughout development. In utero, TSC1, and to a lesser extent, TSC2 expression is highest in the cortical plate, the developmental zone which, during mid-fetal development, has enriched expression of gene networks implicated in autism spectrum disorders (ASD)11. During post-natal development, when symptoms of TSC tend to initially manifest, TSC1 and TSC2 gene expression is highest in the cerebellum, suggesting that the cerebellum may play an important role in TSC pathogenesis. Using gene expression network analysis, we confirm that TSC1 and TSC2 are strongly co-expressed with other genes of the P13K/AKT/mTOR pathway. Moreover, in adults we find that these other mTOR pathway genes also demonstrate elevated cerebellar expression, suggesting molecular enrichment for mTOR within the cerebellum.
Correlating the observed TSC1 and TSC2 gene expression data with structural changes, we found, as others have reported10, a decrease in size of cerebellar lobules in TSC patients compared to age matched controls. However, this effect was only present in TSC patients with current exposure to AEDs. In the absence of AED exposure, patients with TSC demonstrated larger cerebellar volumes relative to controls. These results highlight the potential confounding influence of seizure burden/AED exposure in studying the TSC population. Earlier reports of cerebellar volume loss in TSC10 seemed at odds with the overgrowth seen elsewhere in the body in response to mutations of the TSC complex which is an inhibitory component of the pro-growth mTOR pathway. Our results could explain this discrepancy, ultimately, however, larger longitudinal studies will be needed to better understand how regional gene expression in TSC impacts brain structure and morphology throughout development.
Prior studies have investigated the presence of cerebellar pathology in TSC and its implications for the TSC phenotype. While approximately 80% of patients with TSC have cortical tubers12, only 24–33% of patients have tubers in the cerebellum13,14. Interestingly, the presence of cerebellar tubers does not correlate with “typical” cerebellar motor symptoms, as might be expected14, but rather, with neurocognitive symptoms15,16. This finding fits with growing clinical evidence that cerebellar abnormalities can have a profound impact on cognitive development17, and basic research showing that the posterior lobe of the cerebellum (lobules VI, VII, VIII, IX, crus I, and crus II, collectively constituting the neo-cerebellum) is integral to cognitive and limbic regulation18. In normal adults, we found selective elevation of TSC1 and TSC2 gene expression within these same neocerebellar lobules, suggesting that regional disruption of TSC1/TSC2, and the mTOR pathway more generally, may contribute to the cognitive abnormalities seen in TSC.
Approximately 50% of patients with TSC fulfill criteria for autism spectrum disorder (ASD), making TSC one of the most common monogenic causes of ASD19. The pathogenesis of ASD in the TSC population is not well understood, however, in recent years, accumulating evidence points to the important role the cerebellum plays not only in cognition, but also in the clinical development of autism spectrum disorder (ASD). Prior neuropathological studies have suggested a loss of cerebellar Purkinje cells in individuals with ASD20–22. Additionally, prior imaging studies have shown abnormal cerebellar morphology and function in patients with ASD, particularly within the neo-cerebellum23–26. Premature infants with isolated cerebellar hemorrhage have a higher incidence of ASD compared to other premature controls27. Finally, mutant mice with selective deletion of TSC1 from the cerebellum develop an autistic phenotype characterized by lack of interest in socializing, repetitive behaviors and restrictive interests19. These studies support our hypothesis that abnormal cerebellar development, due to a variety of causes, including abnormal regional expression of TSC1, TSC2 and related gene networks, may contribute to cognitive disorders such as ASD.
In mid-gestational fetal brains, we found elevated TSC1 and, to a lesser extent, TSC2 expression in the cortical plate. Recent studies have implicated the mid-gestational cortical plate as a key point of convergence of multiple co-expression networks of probable ASD genes11. In the adult cortex we found regionally selective expression of TSC1 and TSC2 in the association cortex of the parietal lobe, a major area of input into the neo-cerebellum28. Together these cerebellar and cortical findings suggest that a cortico-cerebellar network linking association cortex to the neo-cerebellum may contribute to the pathogenesis of cognitive disorders in TSC.
Our study has limitations. The gene expression data in our paper is derived from normal adult and fetal brain tissue and not from TSC patients. Furthermore, the pediatric gene expression data do not include a finer neuroanatomic parcellation of the cerebellum, so we could not evaluate the pattern of TSC1 and TSC2 expression in specific cerebellar lobules throughout development. Validating these patterns of regional gene expression in data from TSC patients and evaluating developmental patterns of TSC1 and TSC2 expression in different cerebellar lobules and the cortical plate will be an important goal for future work. Finally, as we have seen, because seizures are a common clinical manifestation of TSC and anti-epileptic medications are associated with cerebellar atrophy, it is challenging to separate the multiple factors that contribute to cerebellar structural changes in TSC patients.
In conclusion, we found that gene expression of TSC1 and TSC2 is regionally specific and developmentally dynamic, being selectively elevated in the cortical plate during fetal mid-gestation and in the cerebellum postnatally, from childhood to adulthood. We conjecture that abnormal TSC1 and TSC2 expression in these specific brain regions during critical developmental periods may affect key molecular pathways, result in measurable morphologic changes, and contribute to the cognitive impairment observed in a subset of the TSC population. Finally, we suggest that TSC is a promising model disorder in which to study the role of regional gene expression in brain development and disease.
Methods
All methods are HIPAA-compliant and approved by the University of California, San Francisco Institutional Review Board (IRB). All investigations were performed in accordance with IRB guidelines.
Allen BSI Adult Gene Expression Data
We investigated regional gene expression of TSC1 and TSC2 with the goal of leveraging patterns of gene expression to understand the TSC phenotype. Using a publicly available microarray dataset from the Allen Brain Sciences Institute (www.brain-map.org), we first evaluated whether TSC1 and TSC2 exhibit a regionally specific pattern of gene expression across the human brain. Briefly, these transcriptome data are derived from 6 adult brains and across 862 brain regions. Approximately 500 anatomically discrete samples were collected from cortex, subcortex, cerebellum, and brainstem of each of the 6 brains and profiled for genome-wide gene expression using a custom Agilent 8 × 60 K cDNA array chip. For additional details regarding the dissection methods, quality control, and normalization measures on this dataset, please see29and http://human.brain-map.org/. For each TSC gene, we downloaded expression values for each available probe, calculated using z-score normalization. For TSC1, we used probes A_24_P329635, CUST_1305_PI416573500, and CUST_1347_PI416379584. For TSC2, we used probes A_23_P66110, CUST_16140_PI416261804, and CUST_662_PI416408490.
TSC1 and TSC2 expression across the developmental age spectrum
We used a spatial and temporal microarray expression data set focusing on the prenatal brain to investigate TSC1 and TSC2 gene expression throughout development30. These exon-level expression data originate from 1,340 tissue samples from both hemispheres, across 16 brain regions that span 32 consecutive periods of neurodevelopment and adulthood from 6 post-conception weeks (PCW) to 85 years (for additional details see http://hbatlas.org/). For TSC1 and TSC2, we downloaded expression values, calculated using z-score normalization from the Gene Expression Omnibus (GEO) database (GSE25219).
TSC1 and TSC2 expression in utero
We examined TSC1 and TSC2 expression in utero using data from the Allen Brain Sciences Institute. These exon-level expression data originate from four intact mid-gestational brains (two from 15–16 PCW and two from 21 PCW) and 9 layers (fetal mitotic and post-mitotic zones) as described previously (for additional details see Miller JA 2014 Nature31 and http://www.brainspan.org/lcm/). We downloaded expression values, calculated using z-score normalization from http://www.brainspan.org/lcm/ and evaluated the pattern of expression across the 9 fetal mitotic and post-mitotic zones, which included subpial granular layer (SG), marginal zone (MZ), outer and inner cortical plate (CP), subplate (SP), intermediate zone (IZ or inner SP), outer and inner subventricular zone (SZ), and ventricular zone (VZ).
In vivo morphometric analysis of cerebellar volume in pediatric patients with TSC
With institutional review board approval, we performed a retrospective search of our institution’s clinical radiology database for MRI scans of patients diagnosed with TSC who were less than 18 years of age at the time of imaging. Informed consent was not required, as the study was retrospective in nature. We only included patients whose scans included 3D T1-weighted sequences (1 mm isotropic resolution) imaged on 3 Tesla General Electric MRI scanners. We further excluded post-operative patients and scans with excessive motion or other artifacts. We identified 28 TSC patients who met these criteria whose diagnosis was confirmed either through fulfillment of clinical diagnostic criteria for TSC or through positive genetic testing for known TSC1 and TSC2 mutations. We compared these TSC patients to 200 normal age- and sex-matched controls from the Pediatric Imaging Neurocognition Genetics (PING) database32. We performed volumetric probabilistic segmentation of the cerebellar lobules from each subject’s 3D T1-weighted scan using the SUIT (‘spatially unbiased infra-tentorial template‘) software package33 (see Fig. 8a for a representative example).
Electronic supplementary material
Acknowledgements
Dr. Leo P. Sugrue was supported by the American Roentgen Ray Society (ARRS)-American Society of Neuroradiology (ASNR) Scholar Award. Dr. Rahul S. Desikan was supported by the Radiological Society of North America, ASNR Foundation AD Imaging Award, National Alzheimer’s Coordinating Center (NACC) Junior Investigator (JI) Award. Dr. Matthew J. Barkovich is supported by the National Institutes of Health (NIBIB) T32 Training Grant, T32EB001631. Dr. Celeste Karch is supported by a National Institutes of Health K grant, AG046374. Dr. Bruce Fischl is supported in part by the National Institute for Biomedical Imaging and Bioengineering (P41EB015896, 1R01EB023281, R01EB006758, R21EB018907, R01EB019956), the National Institute on Aging (5R01AG008122, R01AG016495), the National Institute of Diabetes and Digestive and Kidney Diseases (1-R21-DK-108277-01), the National Institute for Neurological Disorders and Stroke (R01NS0525851, R21NS072652, R01NS070963, R01NS083534, 5U01NS086625), and resources provided by Shared Instrumentation Grants 1S10RR023401, 1S10RR019307, and 1S10RR023043. Additional support was provided by the NIH Blueprint for Neuroscience Research (5U01-MH093765), part of the multi-institutional Human Connectome Project. In addition, BF has a financial interest in CorticoMetrics, a company whose medical pursuits focus on brain imaging and measurement technologies. BF’s interests were reviewed and are managed by Massachusetts General Hospital and Partners HealthCare in accordance with their conflict of interest policies. Pediatric Imaging, Neurocognition, and Genetics Study (PING) The PING Study was a cross-sectional study of brain and cognitive development in the United States funded by the National Institute on Drug Abuse. The PING Study consortium consisted of 10 research sites where brain imaging, behavioral, and genetic assessments were conducted. More than 1,700 participants from 3 to 20 years of age were enrolled. A more complete description of the study is available at PING Data Repository. Data used in the preparation of this article were obtained from the Pediatric Imaging, Neurocognition, and Genetics (PING) Study (PING Data Repository), and are shared through the NIMH Data Archive (NDA). PING was a multisite, cross-sectional study that recruited more than 1,700 participants aged 3 to 20 years. The study was supported by award number RC2DA029475 from the National Institute on Drug Abuse with additional support for data sharing provided by the Eunice Kennedy Shriver National Institute of Child Health & Human Development under award number R01HD061414. A list of participating sites and study investigators can be found at https://ping-dataportal.ucsd.edu/sharing/Authors10222012.pdf. PING investigators designed and implemented the study and/or provided data but did not necessarily participate in analysis or writing of this report. This publication is solely the responsibility of the authors and does not necessarily represent the views of the National Institutes of Health or PING investigators.
Author Contributions
Y.L. and M.J.B.: Drafting manuscript, data analysis. C.M.K., R.M.N., C.F., I.J.B., C.T. and D.C.: Data analysis. C.P.H., W.P.D., C.M.G., O.A.G., N.O., J.S.Y., L.W.B., B.M., A.K., N.S., B.F., O.A.A., T.J. and A.D.: Drafting manuscript. C.P.H., W.P.D., C.M.G., O.A.G., N.O., J.S.Y., L.W.B., B.M., A.K., N.S., B.F., O.A.A., T.J. and A.D.: Drafting manuscript. A.J.B.: Study Design, Drafting Manuscript. R.S.D. and L.P.S.: Study Design, Drafting Manuscript, Data Analysis.
Data Availability
The datasets analyzed in this study are publicly available on the websites provided in the Results and Methods section of this manuscript.
Competing Interests
The authors declare no competing interests.
Footnotes
Publisher's note: Springer Nature remains neutral with regard to jurisdictional claims in published maps and institutional affiliations.
Contributor Information
Yi Li, Email: yi.li@ucsf.edu.
Leo P. Sugrue, Email: leo.sugrue@ucsf.edu
Electronic supplementary material
Supplementary information accompanies this paper at 10.1038/s41598-018-31075-4.
References
- 1.Sampson JR, Harris PC. The molecular genetics of tuberous sclerosis. Hum. Mol. Genet. 1994;3:1477–1480. doi: 10.1093/hmg/3.suppl_1.1477. [DOI] [PubMed] [Google Scholar]
- 2.Laplante M, Sabatini DM. mTOR signaling in growth control and disease. Cell. 2012;149:274–293. doi: 10.1016/j.cell.2012.03.017. [DOI] [PMC free article] [PubMed] [Google Scholar]
- 3.Silbereis JC, Pochareddy S, Zhu Y, Li M, Sestan N. The Cellular and Molecular Landscapes of the Developing Human Central Nervous System. Neuron. 2016;89:268. doi: 10.1016/j.neuron.2015.12.008. [DOI] [PMC free article] [PubMed] [Google Scholar]
- 4.Consortium, Gte The Genotype-Tissue Expression (GTEx) project. Nat. Genet. 2013;45:580–5. doi: 10.1038/ng.2653. [DOI] [PMC free article] [PubMed] [Google Scholar]
- 5.Ramasamy A, et al. Genetic variability in the regulation of gene expression in ten regions of the human brain. Nat Neurosci. 2014;17:1418–1428. doi: 10.1038/nn.3801. [DOI] [PMC free article] [PubMed] [Google Scholar]
- 6.Warde-Farley, D. et al. The GeneMANIA prediction server: Biological network integration for gene prioritization and predicting gene function. Nucleic Acids Res. 38 (2010). [DOI] [PMC free article] [PubMed]
- 7.Mostafavi S, Ray D, Warde-Farley D, Grouios C, Morris Q. GeneMANIA: a real-time multiple association network integration algorithm for predicting gene function. Genome Biol. 2008;9(Suppl 1):S4. doi: 10.1186/gb-2008-9-s1-s4. [DOI] [PMC free article] [PubMed] [Google Scholar]
- 8.Marcián V, et al. Morphological changes of cerebellar substructures in temporal lobe epilepsy: A complex phenomenon, not mere atrophy. Seizure. 2018;54:51–57. doi: 10.1016/j.seizure.2017.12.004. [DOI] [PubMed] [Google Scholar]
- 9.Hagemann G, et al. Cerebellar volumes in newly diagnosed and chronic epilepsy. J. Neurol. 2002;249:1651–1658. doi: 10.1007/s00415-002-0843-9. [DOI] [PubMed] [Google Scholar]
- 10.Weisenfeld NI, et al. A magnetic resonance imaging study of Cerebellar volume in tuberous sclerosis complex. Pediatr. Neurol. 2013;48:105–110. doi: 10.1016/j.pediatrneurol.2012.10.011. [DOI] [PMC free article] [PubMed] [Google Scholar]
- 11.Willsey AJ, et al. Coexpression networks implicate human midfetal deep cortical projection neurons in the pathogenesis of autism. Cell. 2013;155:997–1007. doi: 10.1016/j.cell.2013.10.020. [DOI] [PMC free article] [PubMed] [Google Scholar]
- 12.Mizuguchi M, Takashima S. Neuropathology of tuberous sclerosis. in. Brain and Development. 2001;23:508–515. doi: 10.1016/S0387-7604(01)00304-7. [DOI] [PubMed] [Google Scholar]
- 13.Vaughn J, et al. MRI characterization and longitudinal study of focal cerebellar lesions in a young tuberous sclerosis cohort. Am. J. Neuroradiol. 2013;34:655–659. doi: 10.3174/ajnr.A3260. [DOI] [PMC free article] [PubMed] [Google Scholar]
- 14.Ertan G, Arulrajah S, Tekes A, Jordan L, Huisman TAGM. Cerebellar abnormality in children and young adults with tuberous sclerosis complex: MR and diffusion weighted imaging findings. J. Neuroradiol. 2010;37:231–238. doi: 10.1016/j.neurad.2009.12.006. [DOI] [PubMed] [Google Scholar]
- 15.Weber AM, Egelhoff JC, McKellop JM, Franz DN. Autism and the cerebellum: Evidence from tuberous sclerosis. J. Autism Dev. Disord. 2000;30:511–517. doi: 10.1023/A:1005679108529. [DOI] [PubMed] [Google Scholar]
- 16.Eluvathingal TJ, et al. Cerebellar lesions in tuberous sclerosis complex: neurobehavioral and neuroimaging correlates. J. Child Neurol. 2006;21:846–51. doi: 10.1177/08830738060210100301. [DOI] [PubMed] [Google Scholar]
- 17.Schmahmann, J. D. Handbook of the Cerebellum and Cerebellar Disorders 10.1007/978-94-007-1333-8 (2013).
- 18.Bodranghien F, et al. Consensus Paper: Revisiting the Symptoms and Signs of Cerebellar Syndrome. Cerebellum. 2016;15:369–391. doi: 10.1007/s12311-015-0687-3. [DOI] [PMC free article] [PubMed] [Google Scholar]
- 19.Sundberg M, Sahin M. Cerebellar Development and Autism Spectrum Disorder in Tuberous Sclerosis Complex. J. Child Neurol. 2015;30:1954–1962. doi: 10.1177/0883073815600870. [DOI] [PMC free article] [PubMed] [Google Scholar]
- 20.Bauman ML, Kemper TL. Neuroanatomic observations of the brain in autism: A review and future directions. International Journal of Developmental Neuroscience. 2005;23:183–187. doi: 10.1016/j.ijdevneu.2004.09.006. [DOI] [PubMed] [Google Scholar]
- 21.Fatemi SH, et al. Consensus paper: Pathological role of the cerebellum in Autism. Cerebellum. 2012;11:777–807. doi: 10.1007/s12311-012-0355-9. [DOI] [PMC free article] [PubMed] [Google Scholar]
- 22.Whitney ER, Kemper TL, Bauman ML, Rosene DL, Blatt GJ. Cerebellar Purkinje cells are reduced in a subpopulation of autistic brains: A stereological experiment using calbindin-D28k. Cerebellum. 2008;7:406–416. doi: 10.1007/s12311-008-0043-y. [DOI] [PubMed] [Google Scholar]
- 23.Courchesne E, Yeung-Courchesne R, Press GA, Hesselink JR, Jernigan TL. Hypoplasia of cerebellar vermal lobules VI and VII in autism. N Engl J Med. 1988;318:1349–1354. doi: 10.1056/NEJM198805263182102. [DOI] [PubMed] [Google Scholar]
- 24.Amaral DG, Schumann CM, Nordahl CW. Neuroanatomy of autism. Trends in Neurosciences. 2008;31:137–145. doi: 10.1016/j.tins.2007.12.005. [DOI] [PubMed] [Google Scholar]
- 25.Akshoomoff N, et al. Outcome Classification of Preschool Children With Autism Spectrum Disorders Using MRI Brain Measures. J. Am. Acad. Child Adolesc. Psychiatry. 2004;43:349–357. doi: 10.1097/00004583-200403000-00018. [DOI] [PubMed] [Google Scholar]
- 26.Allen G, Courchesne E. Differential effects of developmental cerebellar abnormality on cognitive and motor functions in the cerebellum: An fMRI study of autism. Am. J. Psychiatry. 2003;160:262–273. doi: 10.1176/appi.ajp.160.2.262. [DOI] [PubMed] [Google Scholar]
- 27.Limperopoulos C, et al. Does cerebellar injury in premature infants contribute to the high prevalence of long-term cognitive, learning, and behavioral disability in survivors? Pediatrics. 2007;120:584–93. doi: 10.1542/peds.2007-1041. [DOI] [PubMed] [Google Scholar]
- 28.Ghez, C. & Fahn, S. In Principles of Neural Science (eds Kandel, E. & Schwartz, J.) 502–522 (Elsevier).
- 29.Hawrylycz M, et al. Canonical genetic signatures of the adult human brain. Nat. Neurosci. 2015;18:1832–1844. doi: 10.1038/nn.4171. [DOI] [PMC free article] [PubMed] [Google Scholar]
- 30.Kang HJ, et al. Spatio-temporal transcriptome of the human brain. Nature. 2011;478:483–489. doi: 10.1038/nature10523. [DOI] [PMC free article] [PubMed] [Google Scholar]
- 31.Miller JA, et al. Transcriptional landscape of the prenatal human brain. Nature. 2014;508:199–206. doi: 10.1038/nature13185. [DOI] [PMC free article] [PubMed] [Google Scholar]
- 32.Jernigan TL, et al. The Pediatric Imaging, Neurocognition, and Genetics (PING) Data Repository. Neuroimage. 2016;124:1149–1154. doi: 10.1016/j.neuroimage.2015.04.057. [DOI] [PMC free article] [PubMed] [Google Scholar]
- 33.Diedrichsen J. A spatially unbiased atlas template of the human cerebellum. Neuroimage. 2006;33:127–138. doi: 10.1016/j.neuroimage.2006.05.056. [DOI] [PubMed] [Google Scholar]
Associated Data
This section collects any data citations, data availability statements, or supplementary materials included in this article.
Supplementary Materials
Data Availability Statement
The datasets analyzed in this study are publicly available on the websites provided in the Results and Methods section of this manuscript.


