Phil. Trans. R. Soc. A 376, 20170174. (Published online 14 May 2018). (doi:10.1098/rsta.2017.0174)
The original paper, as published, requires correction to the figures. Figure 5(c) and 8 were presented incorrectly, and the resolution of all figures has been modified.
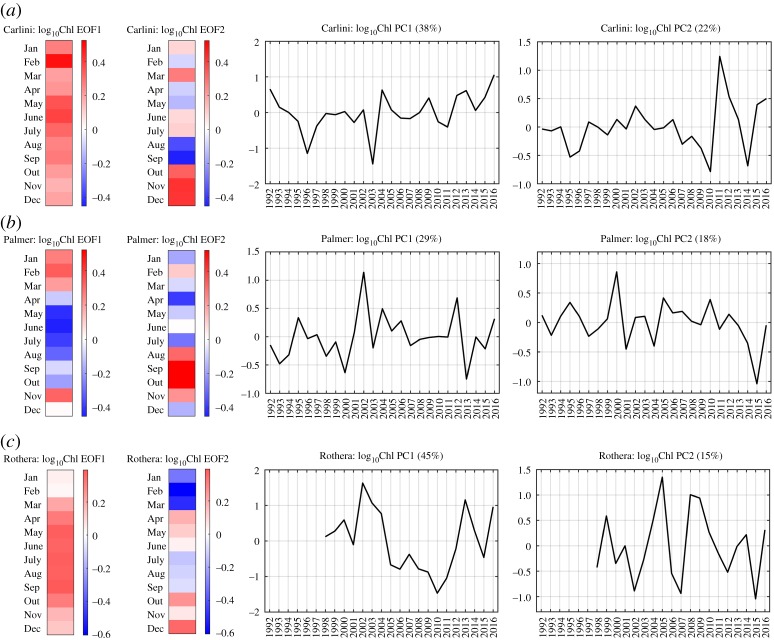
Figure 5.
Empirical Orthogonal Function (EOF) and Principal Component (PC) time series of the Chl datasets at individual stations. The set of EOF and PC patterns from the first case of the EOF analysis is presented for (a) Carlini Station (PC), (b) Palmer Station and (c) Rothera Station. The red colours represent positive log10Chl anomalies and the blue colours represent negative log10Chl anomalies in the EOF plots. The percentage explained by each mode is represented in the corresponding PC time series. Note that no data are available from 1992 to 1997 at Rothera Station.
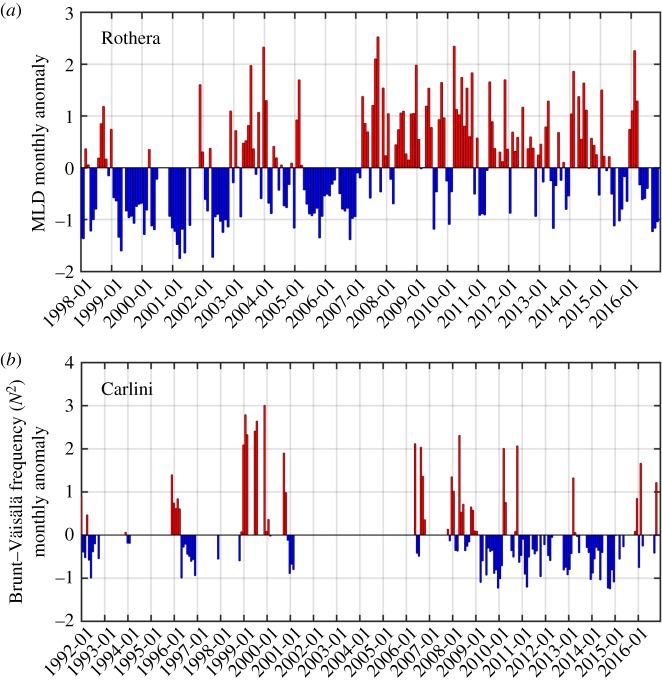
Figure 8.
Water-column stability parameters at Rothera Station and Carlini Station (PC). (a) Monthly (standardized) MLD anomalies at Rothera Station and (b) the monthly (standardized) Brunt–Väisälä frequency (N2) at Carlini Station (PC).
Figure 5c: the zero lines in the time series plots were removed.
Figure 8 should only have two subplots (a,b) not (a)–(d) as in the published version.
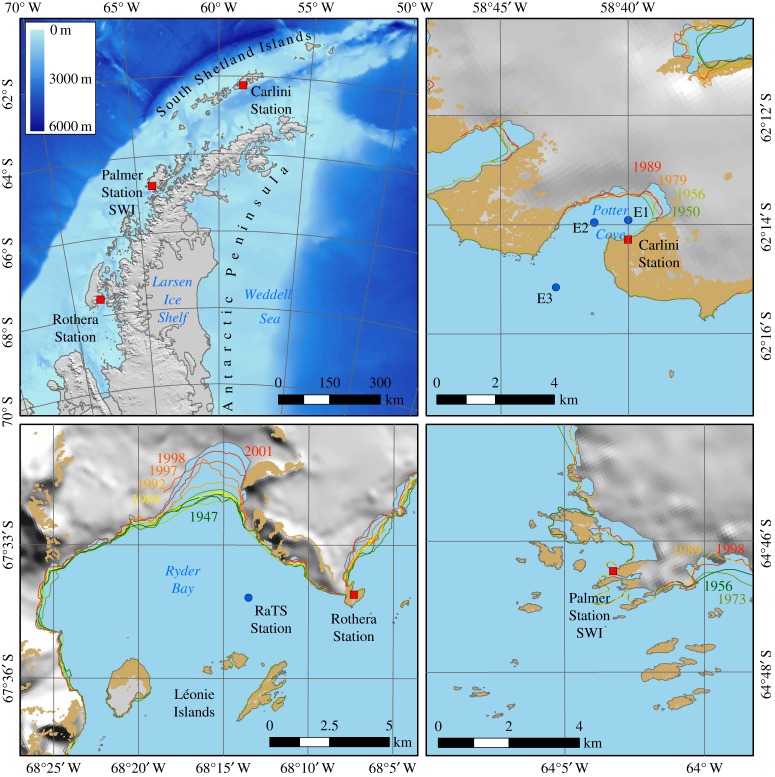
Figure 1.
Map of sampling area: the positions of Carlini Station at Potter Cove (PC), Palmer Station seawater intake (SWI) (or Palmer Station) and Rothera Station along the coastal West Antarctic Peninsula (WAP).
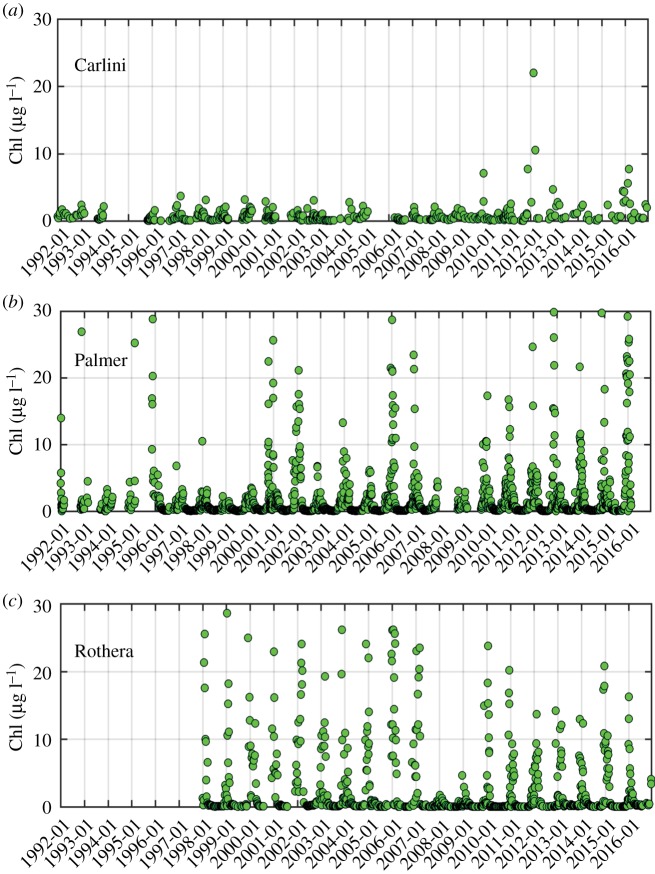
Figure 2.
Daily volumetric chlorophyll-a (Chl) time series at Carlini Station (PC), Palmer Station and Rothera Station for the studied period. Note that no data are available from 1992 to 1997 at Rothera Station.
Figure 3.
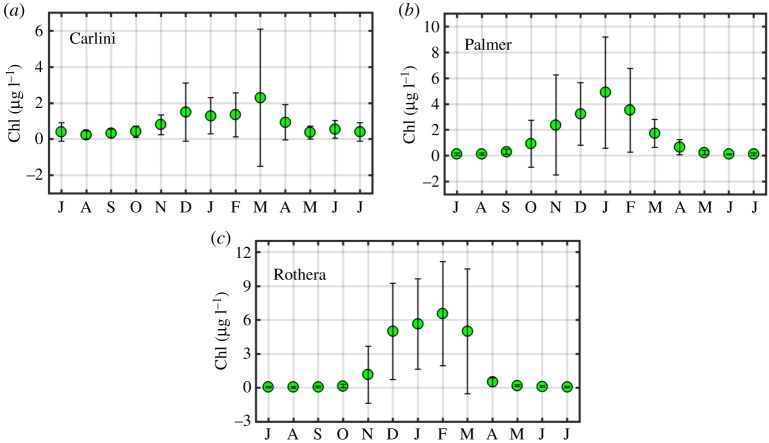
The climatology of Chl at Carlini Station (PC), Palmer Station and Rothera Station for the studied period. Error bars indicate standard deviations. Monthly means for the past 25-year period (1992–2016) were calculated for Carlini Station (PC) and Palmer Station, while monthly means for the past 19-year period (1998–2016) were calculated for Rothera Station. The value in July is presented twice to make monthly Chl values be presented consecutively. (Online version in colour.)
Figure 4.
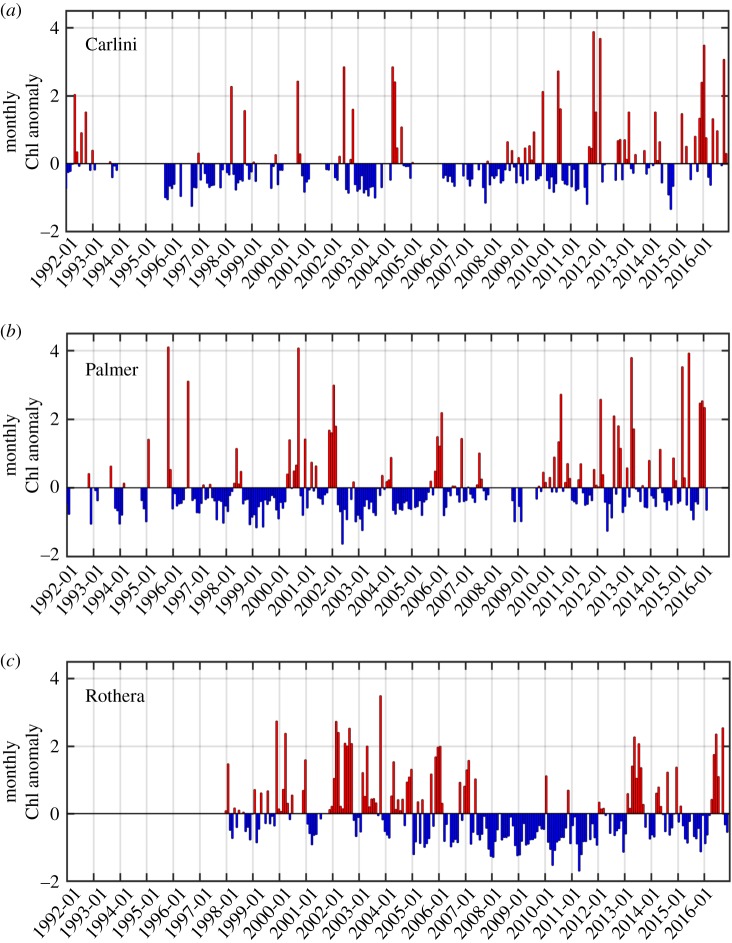
Monthly Chl anomalies at Carlini Station (PC), Palmer Station and Rothera Station for the studied period. Monthly anomalies were calculated as standardized anomalies. Note that no data are available from 1992 to 1997 at Rothera Station.
Figure 6.
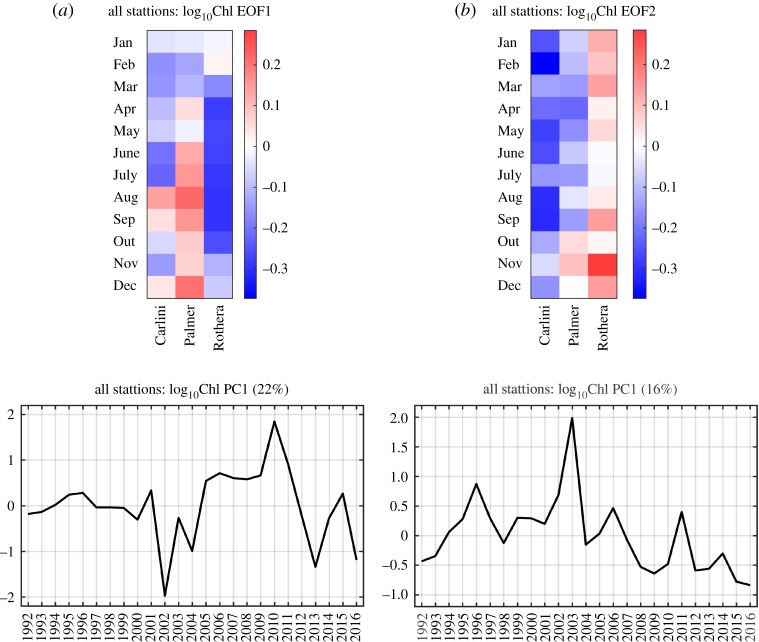
EOF and PC time series of the Chl datasets for all three stations. The set of EOF and PC patterns from the second case of the EOF analysis is presented for the first mode (mode 1, a) and the second mode (mode 2, b). The red colours represent positive log10Chl anomalies and the blue colours represent negative log10Chl anomalies in the EOF plots. The percentage explained by each mode is represented in the corresponding PC time series.
Figure 7.
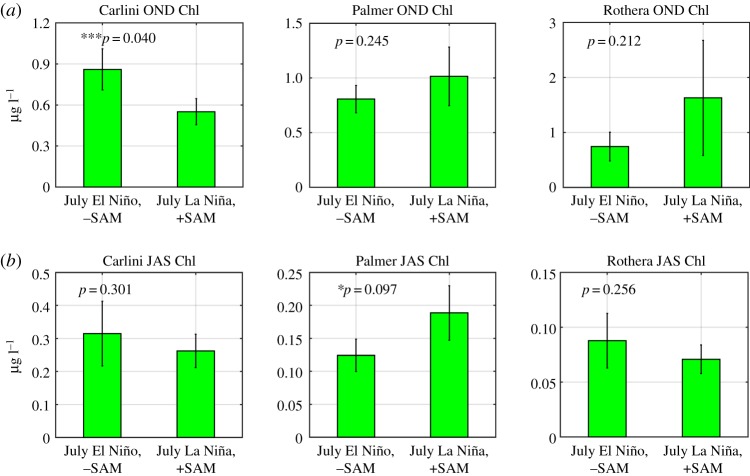
EOF-reconstructed Chl composites during different climate variability regimes. Chl values are reconstructed using the first 5, 6 and 5 dominant modes for Carlini Station (PC), Palmer Station and Rothera Station, respectively. (a) Spring (October–November–December or OND) Chl composites and (b) winter (July–August–September or JAS) Chl composites when preceded by El Niño/−SAM and La Niña/+SAM conditions in July. Owing to small sample sizes (n = 9 and 15 for El Niño/−SAM and La Niña/+SAM) in the analyses, a relaxed criterion was used for the level of significance at p < 0.10. (Online version in colour.)


