Abstract
Dipeptidyl peptidase‐4 (DPP‐4 or clusters of differentiation [CD]26) is a multifunctional molecule with established roles in metabolism. Pharmacologic inhibition of DPP‐4 is widely used to improve glycemic control through regulation of the incretin effect. Colaterally, CD26/DPP‐4 inhibition appears to be beneficial in many inflammatory conditions, namely in delaying progression of liver pathology. Nevertheless, the exact implications of CD26/DPP‐4 enzymatic activity in liver dysfunction remain unclear. In this work, we investigated the involvement of CD26/DPP‐4 in experimental mouse models of induced hepatocyte damage that severely impact Kupffer cell (KC) populations. Liver dysfunction was evaluated in CD26 knockout (KO) and B6 wild‐type mice during acute liver damage induced by acetaminophen, chronic liver damage induced by carbon tetrachloride, and KC‐depleting treatment with clodronate‐loaded liposomes. We found that necrosis resolution after hepatotoxic injury was delayed in CD26KO mice and in B6 mice treated with the CD26/DPP‐4 inhibitor sitagliptin, suggesting that DPP‐4 enzymatic activity plays a role in recovering from acute liver damage. Interestingly, the severe KC population reduction in acute and chronic liver injury was concomitant with increased CD26/DPP‐4 serum levels. Remarkably, both chronic liver damage and noninflammatory depletion of KCs by clodronate liposomes were marked by oscillation in CD26/DPP‐4 serum activity that mirrored the kinetics of liver KC depletion/recovery. Conclusion:CD26/DPP‐4 enzymatic activity contributes to necrosis resolution during recovery from acute liver injury. Serum CD26/DPP‐4 is elevated when severe perturbations are imposed on KC populations, regardless of patent liver damage. We propose that serum CD26/DPP‐4 is a potential systemic surrogate marker of severe impairments in the KC population imposed by clinical and subclinical liver conditions.
Abbreviations
- APAP
N‐acetyl‐p‐aminophenol
- CD
clusters of differentiation
- CD26/DPP‐4
dipeptidyl peptidase‐4
- HCD
hypercaloric diet
- IL
interleukin
- KC
Kupffer cell
- KO
knockout
- LPS
lipopolysaccharide
- NPC
nonparenchymal cell
- PBS
phosphate‐buffered saline
- TNF‐α
tumor necrosis factor‐α
Introduction
Clusters of differentiation (CD)26, also known as dipeptidyl peptidase‐4 (DPP‐4), occurs as a transmembrane glycoprotein of 110 kDa in many cell types or in soluble form in most body fluids. It has been shown to cleave two N‐terminal amino acids in small polypeptides, usually with proline or alanine in the second position.(1, 2) Inactivation of incretin gastrointestinal hormones glucagon‐like polypeptide 1 and glucose‐dependent insulinotropic polypeptide is currently the most clinically relevant function attributed to this enzyme.(3) Glucagon‐like polypeptide 1 and glucose‐dependent insulinotropic polypeptide cleaved by CD26/DPP‐4 are rapidly targeted for degradation, and pharmacologic inhibition of DPP‐4 activity is a prime strategy in the treatment of type 2 diabetes as it prolongs the incretin effect. Nevertheless, CD26/DPP‐4 is multifunctional, acting on many substrates, including chemokines, and binding to various other molecules, such as adenosine deaminase.(4, 5, 6) Accordingly, multiple nonglycemic effects of CD26/DPP‐4 inhibition therapy have been reported.(7) Interestingly, a beneficial impact in attenuation of inflammation and an increased susceptibility to infections have been noted.(5) Additionally, circulating DPP‐4 concentrations are increased in various inflammatory diseases, highlighting the relevance of CD26/DPP‐4 in immune activation.(8)
The proteolytic activity of DDP‐4 is executed by the extracellular portion of the molecule and is retained in the soluble form.(8, 9) The mechanisms regulating CD26/DPP‐4 secretion and release from the cell membrane include a metalloprotease activity that mediates the shedding of CD26/DPP‐4 from human vascular smooth muscle cells and adipocytes.(10) A recent study using mouse genetic models has shown that bone marrow‐derived cells and vascular endothelial cells are major contributors to serum CD26/DPP‐4 levels.(11) Another study proposed the liver as an important source of circulating CD26/DPP‐4 and pointed to a weight‐dependent regulation of hepatic Dpp4 expression.(12)
CD26/DPP‐4 is highly expressed in the liver, namely in the hepatocyte canalicular membrane facing the bile canaliculus, in biliary epithelial cells, and in endothelial cells.(13) Expression in liver macrophages was reported on lysosomes and at a lower level in the plasma membrane.(13) Kupffer cells (KCs) are critical players in maintaining liver homeostasis and responsiveness to liver insults,(14) triggering both local responses and recruiting hematopoietic cells that participate in liver inflammatory and tissue repair responses.(15)
Protection from liver steatosis and slower progression of nonalcoholic fatty liver disease was reported with CD26/DPP‐4 inhibitor therapy.(16) However, two recent randomized, placebo‐controlled, clinical trials have failed to observe an effect of CD26/DPP‐4 enzymatic inhibition on hepatic steatosis,(17, 18) and its impact in the development of liver pathology remains unsettled. This is particularly relevant in light of liver pathology as a common comorbidity in type 2 diabetic patients, increasing the risk of progression toward liver fibrosis and limiting the therapeutic options available for glycemic control.(19) Studies have suggested a potential beneficial role for DPP‐4 inhibition in rodent models of liver fibrosis, but the pathogenic mechanisms proposed diverge.(20, 21) Furthermore, the role of CD26/DPP‐4 in inflammatory and tissue recovery phases of disease when macrophage populations are most dynamically changed has thus far been overlooked.
In this study, we analyzed mouse models with various degrees of hepatic disturbances to determine whether alterations in liver macrophage populations correlated with CD26/DPP‐4 expression and enzymatic activity. Our findings suggest that CD26/DPP‐4 activity participates in the liver recovery response to acute hepatotoxic injury and is an indicator of severe shifts in liver macrophage populations.
Materials and Methods
Mice and Experimental Models
All procedures involving laboratory mice were in accordance with national (Portaria 1005/92) and European (European Directive 86/609/CEE) regulations on animal experimentation and were approved by the Instituto Gulbenkian de Ciência Ethics Committee and the Direcção‐Geral de Veterinária (the official national entity for regulation of laboratory animal usage). C57BL/6‐DPP‐4tm1Nwa/Orl (CD26 knockout [KO]) mice were purchased from the European Mouse Mutant Archive (Infrafrontier Gmbh, Munich, Germany). C57BL/6 mice and CD26KO mice were bred and housed under a 12‐hour light/dark cycle in specific pathogen‐free housing facilities at the Instituto Gulbenkian de Ciência. In the Instituto Gulbenkian de Ciência mouse facility, the recommendations of the Federation of European Laboratory Animal Science Associations are followed for health screening of the animals, which includes four screenings per year (one specific and opportunistic pathogen‐free annual panel and three specific and opportunistic pathogen‐free quarter panels). Every animal room has one sentinel cage per rack; these are exposed to materials soiled by resident animals, such as bedding, water, and chewed food. In each health screening, samples from the sentinel animals plus random animals from the same rack are collected and analyzed by an outsourcing laboratory. These samples include blood, feces, and pelt swabs and are screened for serology, bacteria, virus, and parasites. Mice are fed with standard chow (Diet:RM3‐A‐P; Special Diets Services, Essex, United Kingdom (https://www.sdsdiets.com/pdfs/RM3-A-P.pdf), and water is purified by reverse osmosis filtering with ultraviolet treatment.
To induce acute liver injury, 10‐week‐old C57BL/6 and CD26KO male mice were fasted for 15 hours prior to intraperitoneal injection with 300 mg/kg of acetaminophen (N‐acetyl‐p‐aminophenol [APAP]) (Sigma, St. Louis, MO) in phosphate‐buffered saline (PBS) or PBS only (control group). Liver and blood were collected 24 hours and 72 hours after injection. To inhibit CD26 activity, 100 mg/kg of sitagliptin (Santa Cruz Biotechnology, Dallas, TX) dissolved in water or water only was administered by daily gavage starting 3 days prior to APAP injection and continuing until 24 hours before organ collection at 24 hours or 72 hours. In the chronic liver injury model, 7‐8‐week‐old C57BL/6 male mice received PBS or 20% volume/volume CCl4 (Sigma) in olive oil, administered at 0.4 mL/kg twice a week for 4 weeks by intraperitoneal injections. After this period, a final injection was given and liver and blood were collected 24 hours, 72 hours, or 144 hours postinjection. For the hypercaloric regimen experiments, C57BL/6 female mice 5‐6 weeks of age were maintained on regular chow (chow‐RM3‐A‐P; Special Diets Services) or on a hypercaloric diet (HCD; catalog #TD.88137; Harlan, Indianapolis, IN) with 42% kcal fat (61.8% from saturated fatty acids) and 42.7% kcal carbohydrates (63% from sugar) for 6 weeks, with free access to food and water. Mice were weighed weekly, food and water intake were monitored, and blood and liver were collected after the experimental period. For KC‐depletion experiments, 10‐20‐week‐old C57BL/6 male mice received a 200‐μL injection of liposomes containing either PBS (used as the control group) or 5 g/mL of clodronate (depletion group) in the orbital plexus. Liposome preparations were purchased from ClodronateLiposomes.org (Haarlem, the Netherlands) and used according to the manufacturer's specifications. Liver and blood were collected 2, 7, 14, or 30 days after injection. A minimum of two independent experiments was performed, and each experimental group ranged from three to nine mice, as specified in figure legends.
Isolation of Cells
Nonparenchymal cells (NPCs) were isolated from liver lobes by perfusion with collagenase H (Sigma) and density centrifugation as described.(22) To enrich for KCs, NPCs were placed on top of four layers of a Percoll (GE Healthcare, Little Chalfon, United Kingdom) gradient of 80%, 60%, 40%, and 20% Percoll and centrifuged for 20 minutes at 400g. The interface between the 60% and 40% Percoll layer containing the KCs was collected. To sort purify KCs, the enriched fraction was resuspended in PBS with 2% fetal calf serum (Life Technologies, Carlsbad, CA). Cells were sorted according to morphology and autofluorescence in the fluoroscein channel on the high‐speed cell sorting MoFlo (Dako‐Cytomation, Berkeley, CA) after it was determined that the autofluorescent population corresponded to F4/80+ cells. Purity was controlled by staining with antibodies against Mac1 (clone M1/70) and F4/80 (clone BM8) (both from BioLegend, San Diego, CA) and was higher than 90%.
Cell Culture and in Vitro Stimulation
Sort‐purified KCs from pools of eight C57BL/6 and eight CD26KO sex and age‐matched mice were cultured in complete medium (Roswell Park Memorial Institute medium supplemented with 2% fetal calf serum, 10 mM 4‐(2‐hydroxyethyl)‐1‐piperazine ethanesulfonic acid, 1 mM sodium pyruvate, 50 μM 2‐mercaptoethanol, 100 U penicillin, and 100 mg/mL streptomycin; Life Technologies) in triplicate (80,000/well) in 96‐well plates; after overnight incubation, these cultures were stimulated with 1 μg/mL purified lipopolysaccharide (LPS; Invitrogen, San Diego, CA). Supernatants were collected after 24 hours of stimulation for analysis of CD26/DPP‐4 enzymatic activity and production of tumor necrosis factor alpha (TNF‐α) and interleukin‐6 (IL‐6). TNF‐α and IL‐6 concentrations were determined with mouse TNF‐α enzyme‐linked immunosorbent assay Ready‐SET‐Go kit (eBiosciences, San Diego, CA) and mouse IL‐6 enzyme‐linked immunosorbent assay Ready‐SET‐Go kit (eBiosciences), according to the manufacturers' specifications. For analysis of enzymatic inhibition, cells were plated in triplicate (80,000 cells/well) in 96‐well plates and were stimulated for 24 hours with LPS 1 μg/mL alone, sitagliptin at 10 μM, or sitagliptin at 100 μM alone or in combination with LPS. To examine in vitro induction of cell death, sorted cells were cultured for 24 hours with clodronate‐containing liposomes (5 g/mL) diluted 1/10 or 1/100 in culture medium. Viability was determined by 3‐(4,5‐dimethylthiazol‐2‐yl)‐2,5‐diphenyltetrazolium bromide (MTT) assay (Invitrogen). In brief, after 24 hours culture with or without clodronate‐containing liposomes, the supernatant was collected and cells were cultured for 1 hour with 0.5 mg/mL of MTT in PBS. The supernatant was removed, and dimethyl sulfoxide was added to cells to dissolve the formazan formed in viable cells. Absorbance was measured at 560 nm.
CD26/DPP‐4 Enzymatic Activity
Supernatant from macrophage cultures or serum from total blood was measured for CD26/DPP‐4 activity using a fluorometric assay with 200 μM of the substrate H‐Gly‐Pro‐AMC HBr (#I‐1225; Bachem, Bubendorf, Switzerland). Measurements at excitation/emission 360/460 nm were taken every 5 minutes over the course of 1 hour, and the rate of change of fluorescence was used as a measure of cleaved substrate by CD26/DPP‐4.
Flow Cytometry
Single‐cell suspensions from peripheral blood or liver NPCs were stained according to standard procedures. Nonspecific binding to FcγIII, FcγII, and FcγI receptors was prevented by incubating the cells with unlabeled anti‐mouse‐Fc‐block/CD16/32 (clone 2.4G2; BD, Franklin Lakes, NJ). Liver KCs were identified using allophycocyanin‐labeled anti‐mouse F4/80 antibody (clone BM8) and fluoroscein or brilliant violet 785‐labeled anti‐mouse‐CD11b/Mac‐1 (clone M1/70) (both from BioLegend). Phycoerythrin‐ and fluoroscein‐labeled anti‐mouse CD26 antibody (clone H194‐112; BioLegend), efluor450‐labeled anti‐mouse Ly6c (clone HK1.4; eBiosciences), and allophycocyanin‐ or phycoerythrin‐labeled anti‐mouse CD45 (clone 30‐F11; BioLegend) were further used to characterize mouse liver macrophages and blood monocytes. Traceable latex beads (Polysciences, Warrington, PA) were added for counting cells. Stained cell suspensions were analyzed by flow cytometry (LSR Fortessa X20 [BD] or CyAn ADP [Beckman Coulter]), and the data acquired with DIVA software (BD). Analysis was performed with FlowJo software (TreeStar, Ashland, OR).
Histology
Livers were fixed in 10% formalin and embedded in paraffin. Nonconsecutive 3‐µm sections were stained with hematoxylin‐eosin or Mason's trichrome and examined under a light microscope (Leica DM LB2; Leica Microsystems, Wetzlar, Germany). Necrosis and fibrosis were blindly evaluated by a trained pathologist. Necrosis was scored using the following criteria: grade 0, normal histology; grade 1, characterized by single‐cell necrosis to centrilobular necrosis limited to the area immediately around the centrilobular vein; grade 2, characterized by centrilobular necrosis with frequent central to central bridging necrosis; grade 3, characterized by centrilobular necrosis affecting the hepatocytes in the centrilobular zone and multifocally extending to the midzonal hepatocytes, with central to central bridging; congestion and hemorrhage are common; grade 4, characterized by confluent necrosis involving several entire adjacent lobules and widespread areas of congestion and hemorrhage in the centrilobular and midzonal areas of the liver.
Triglyceride Quantification
Neutral lipids were extracted from 50 mg of liver by homogenization in a 2:1 mixture of chloroform:methanol and overnight incubation. After 15 minutes centrifugation at 800g, the supernatant containing the lipid fraction was transferred to a clean glass vial and one fifth of 0.9% NaCl was added. For triglyceride quantification, the glycerol phosphate oxidase–peroxidase enzymatic colorimetric assay (Triglycerides GPO‐POD kit; Spinreact, Girona, Spain) was used, following the manufacturer's specifications.
Statistical Analysis
GraphPad Prism6 software (GraphPad Software, La Jolla, CA) was used for statistical analysis. According to the nature of the data, one‐way analysis of variance with Tukey's correction or unpaired Student t tests were applied, as specified in each figure legend. P values are reported for two‐tailed tests with a 95% confidence interval, and differences with P <0.05 were considered significant.
Results
CD26KO Mice Show Delayed Tissue Recovery Following Acute Liver Injury
To ascertain the impact of liver inflammation on liver macrophage populations and CD26/DPP‐4 expression/activity, we used a mouse model of acute liver injury induced by APAP (Fig. 1A), which causes severe hepatic necrosis and innate immune activation with marked leukocyte infiltration into the liver.(23) A single injection with 300 mg/kg of APAP caused extensive hepatotoxicity at 24 hours as evidenced by serum markers of liver damage (aspartate aminotransferase and alanine aminotransferase) in both C57BL/6 and CD26KO mice (Supporting Fig. S1A,B). At 24 hours, both strains showed extensive centrilobular necrosis that, at 72 hours, was markedly recove >red in C57BL/6 mice but was still severe in 40% of CD26KO mice (Fig. 1B,C). Likewise, significant recruitment of hematopoietic‐derived leukocytes (CD45+) was noticeable at 24 hours in both strains, while at 72 hours, it only remained significantly increased in CD26KO mice (Fig. 1D; Supporting Fig. S2). On the other hand, reduction in KC populations was observed at 24 hours postinjection and was sustained at 72 hours in both C57BL/6 and CD26KO mice (Fig. 1E; Supporting Figs. S3 and S4).
Figure 1.
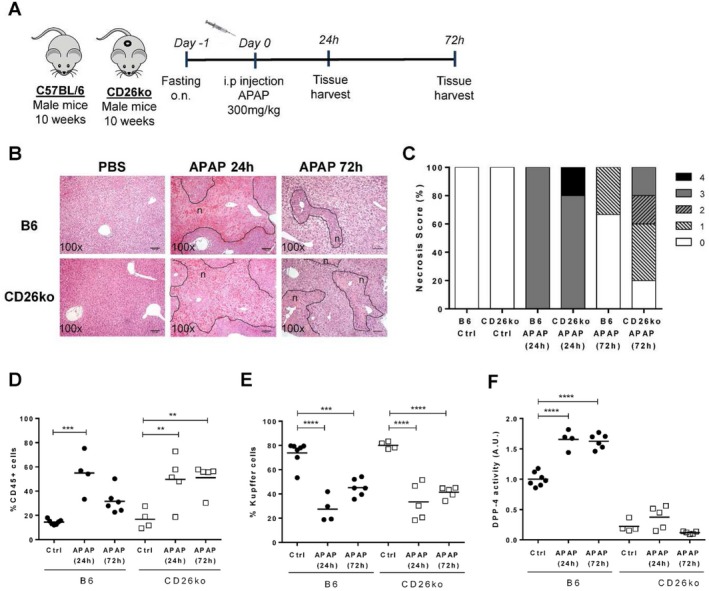
Resolution of necrosis after induction of acute liver injury is delayed in CD26KO mice compared to C57BL/6 controls. (A) Acute liver injury was induced in 10‐week‐old C57BL/6 (B6) and CD26KO male mice by a single intraperitoneal injection of 300 mg/kg APAP, and livers were analyzed at 24 hours and 72 hours postinjection. (B) Necrotic lesions (n; delineated by a dotted line) were examined in liver histologic sections and (C) scored from 0 to 4 according to location and extension. (D,E) The proportion of recruited CD45+ hematopoietic cells and Kupffer cells (F480highMac1+Ly6c‐CD45+ cells) determined by flow cytometry is represented. (F) DPP‐4 activity in serum of B6 control (PBS‐treated) and APAP‐treated mice is depicted in arbitrary units, representing the rate of substrate decay during the enzymatic assay normalized to the average value of the controls. Scale bar,100 μm. Horizontal bars indicate mean values. *P <0.05, **P <0.01, and ***P <0.001 in one‐way analysis of variance using Tukey's correction. Plots depict cumulative data from three independent experiments, n = 4‐6 mice/group. Abbreviations: A.U., arbitrary unit; Ctrl, control; i.p., intraperitoneal; o.n., overnight;
Interestingly, APAP caused a significant increase in serum CD26/DPP‐4 activity observed at 24 hours and 72 hours in C57BL/6 mice (Fig. 1F; Fig. 2A). We superimposed the profiles of serum CD26/DPP‐4 activity with the variation of KCs, liver‐recruited hematopoietic cells (CD45+), and Ly6c+ peripheral blood monocyte populations (Fig. 2). While the proportion of KCs showed inverse dynamics relative to serum enzymatic levels, decreasing as enzymatic activity increased, the proportion of recruited hematopoietic cells observed both in the liver and in circulation increased at 24 hours but showed a faster reduction at 72 hours when compared to the enzymatic activity (Fig. 2B‐D). When measuring CD26/DPP‐4 surface expression in KCs and liver‐recruited hematopoietic cells (CD45+), we found a significant down‐regulation of CD26/DPP‐4 surface expression at 24 hours but not at 72 hours (Fig. 2E,F). The same tendency was observed in Ly6c+ circulating monocytes, although the level of CD26/DPP‐4 expression on these cells was remarkably lower compared to the liver populations (Fig. 2G). Thus, in this context, the loss of CD26/DPP‐4 expression is not cell‐type specific. These results suggest that fluctuations in recruited hematopoietic cells may be related to the rise in serum CD26/DPP‐4 activity during the inflammatory period but not with its persistence at 72 hours after injury. However, it did not escape our attention that both the decrease in the KC population and the elevation of CD26/DPP‐4 serum activity levels were sustained during the recovery phase (72 hours). Given that CD26KO mice showed an impaired recovery response, these observations suggest that the contribution of CD26/DPP‐4 to tissue recovery response is related to the increased secretion of the CD26/DPP‐4 soluble form.
Figure 2.
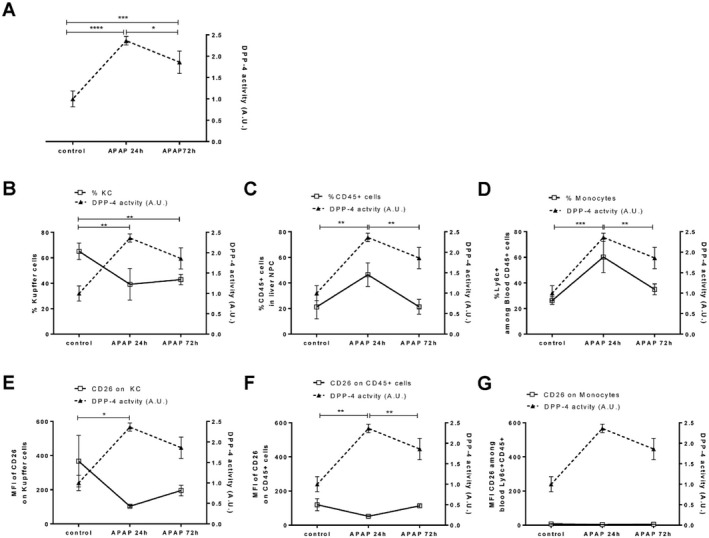
Serum CD26/DPP‐4 activity, hematopoietic cell populations, and surface expression of CD26/DPP‐4 during acute liver injury. (A) DPP‐4 activity in the serum of C57BL/6 control (PBS‐treated) and APAP‐treated mice analyzed at 24 hours and 72 hours (depicted in arbitrary units, representing the rate of substrate decay during the enzymatic assay normalized to the average value of the controls; right axis, filled triangles linked by dashed line) was superimposed on (B) the proportion of Kupffer cells (F480highMac1+Ly6c‐CD45+ cells), (C) the proportion of CD45+ cells in the liver, and (D) the proportion of blood monocytes (Ly6c+ among CD45+ cells) as well as (E) the median fluorescent intensity of CD26/DPP‐4 on Kupffer cells, (F) on liver CD45+ cells, and (G) on blood monocytes (left axis, empty squares linked by straight line). Mean values and SDs are represented; *P <0.05, **P <0.01, ***P <0.001, and ****P <0.0001 in one‐way analysis of variance using Tukey's correction. Plots represent one of three independent experiments, n = 3‐4 mice/group. Abbreviations: A.U., arbitrary units; MFI, mean fluorescent intensity.
Inhibition of CD26/DPP‐4 Enzymatic Activity Leads to Delayed Recovery from Necrosis Following Acute Liver Injury
To determine the role of DPP‐4 enzymatic activity in the recovery of APAP‐induced liver injury, we made use of sitagliptin, a clinically approved DPP‐4 inhibitor (Fig. 3A). At 24 hours after APAP injection, we observed extensive necrosis and hematopoietic cell recruitment (Supporting Figs. S2 and S5) accompanied by elevation of serum markers of liver damage (aspartate aminotransferase and alanine aminotransferase) (Supporting Fig. S1C,D), irrespective of sitagliptin treatment. However, at 72 hours after APAP injection, the sitagliptin‐treated C57BL/6 mice presented a higher proportion of hematopoietic‐recruited cells in the liver and a more severe necrosis score when compared to untreated mice (Fig. 3B‐D; Supporting Fig. S2). The reduction in KCs was similar in treated and nontreated mice submitted to APAP (Fig. 3E; Supporting Fig. S4). Thus, pharmacologic inhibition of CD26/DPP‐4 enzymatic activity during acute liver injury was able to reproduce the delayed recovery from necrosis observed in APAP‐treated CD26KO mice. These results reinforce the notion that CD26/DPP‐4 enzymatic activity contributes to the resolution of hepatocyte necrosis during recovery.
Figure 3.
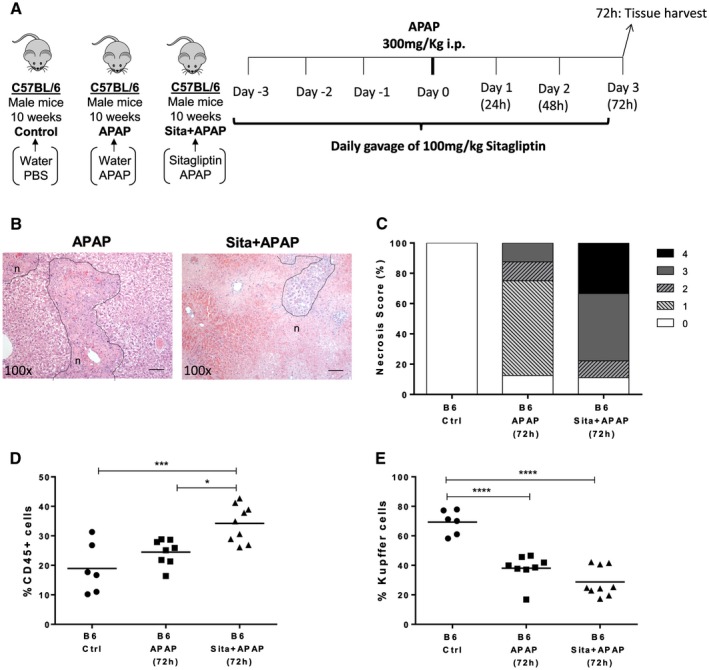
Pharmacologic inhibition of CD26/DPP‐4 enzymatic activity during acute liver injury leads to delayed resolution of necrosis. (A) Sitagliptin (100 mg/kg; Sita+APAP group) or water (APAP group) was administered by daily gavage to 10‐week‐old C57BL/6 (B6) mice before and after APAP intraperitoneal injection. Control B6 mice received water gavage and PBS injections. Livers were analyzed 72 hours after APAP injection and compared with controls. (B) Necrotic lesions (n; delineated by dotted line) were examined in liver histologic sections and (C) scored from 0 to 4 according to location and extension. The proportion of recruited (D) hematopoietic CD45+ cells and (E) KCs (F480highMac1+Ly6c‐CD45+ cells) was determined by flow cytometry. Scale bar, 100 μm. Horizontal bars indicate mean values; *P <0.05, **P <0.01, and ***P <0.001 in one‐way analysis of variance using Tukey's correction. Plots depict cumulative data from two independent experiments, n = 6‐9 per group. Abbreviations: A.U., arbitrary unit; Ctrl, control; i.p., intraperitoneal; Sita, sitagliptin.
CD26/DPP‐4 Enzymatic Activity Increases During Chronic Liver Damage Correlating with Shifts in the KC Population
To assess whether CD26/DPP‐4 serum activity was also implicated in chronic liver damage, we used a mouse model of repeated exposure to CCl4. In this model, CCl4 is administered twice a week for 4 weeks to induce chronic hepatotoxicity. Development and regression of tissue damage and mild fibrosis were evaluated at 24 hours, 72 hours, and 144 hours after treatment (Fig. 4A). As expected,(24) necrosis and fiber deposition as well as up‐regulation of inflammation‐related genes were marked features of pathology at 24 hours after treatment (Fig. 4B; data not shown). At 72 hours, necrosis and fibrosis started to regress and by 144 hours were nearly resolved (Fig. 4B). Dramatic changes in the phenotype of liver macrophage populations accompanied this process. In particular, we observed a remarkable decrease in the KC population at 24 hours during the inflammatory/fibrotic period when the proportion of Ly6c+ recruited cells is higher and its recovery at 72 hours when fibrosis retrogression occurs (Fig. 4D,E).
Figure 4.
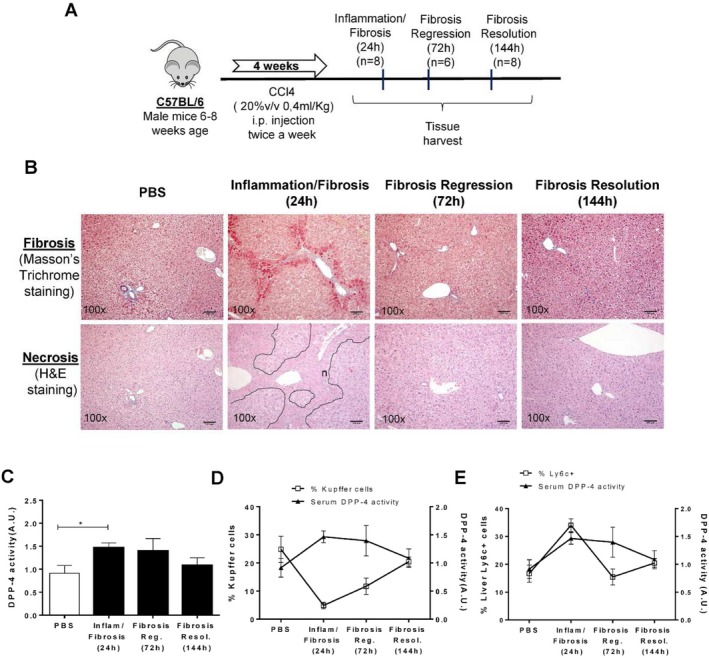
Alterations in Kupffer cell populations and changes in serum CD26/DPP‐4 activity after chronic liver injury. (A,B) Chronic liver injury was induced by CCl4 in C57BL/6, leading to evident inflammation and fibrosis at 24 hours and fibrosis regression and fibrosis resolution by 72 hours and 144 hours, respectively. (C) Serum CD26/DPP‐4 enzymatic activity was determined at 24 hours, 72 hours, and 144 hours after treatment and superimposed on (D) the proportion of KCs and (E) the proportion of liver Ly6c+ cells at the same time points. Arbitrary units represent the rate of substrate decay during the enzymatic assay normalized to the average value of the controls. Necrotic lesions are identified by "n" and delineated by a dotted line. Scale bar, 100 µm. Mean values are depicted, and error bars indicate SD. *P <0.05 in unpaired t test. Plots depict cumulative data from a minimum of three independent experiments, n = 6‐8 mice per group. Abbreviations: A.U., arbitrary units; H&E, hematoxylin and eosin; inflam, inflammation; i.p., intraperitoneal; Reg, regression; Resol, resolution; v, volume.
Interestingly, serum CD26/DPP‐4 enzymatic activity significantly increased when the KC population was lowest but decreased when macrophages with the KC phenotype re‐emerged (Fig. 4C,D). As in the acute liver injury model, the rise in Ly6c+ recruited cells at 24 hours paralleled the increase in CD26/DPP‐4 enzymatic activity, but this correlation was lost at later time points (Fig. 4D,E). These data revealed that the kinetics of serum CD26/DPP‐4 activity may be a surrogate systemic marker for the dynamic shifts observed in KC populations in the context of acute and chronic liver damage.
Liver Macrophage Populations and Serum CD26/DPP‐4 Enzymatic Activity are Unchanged in Initial Dysmetabolic Stages
We further analyzed a mouse model of the initial stages of nonalcoholic fatty liver disease induced by short‐time exposure to an HCD, representing mild hepatocyte dysfunction (Fig. 5). We observed that the levels of triglycerides in the serum and liver as well as body weight gain were significantly increased in C57BL/6 mice after 6 weeks of the HCD (Fig. 5A‐C); however, no change in overall CD26/DPP‐4 enzymatic levels was detected in serum (Fig. 5D). Notably, this short HCD regimen was not associated with significant alterations of KC populations or recruitment of bone marrow‐derived inflammatory cells (Fig. 5E‐H). Interestingly, a decrease in the intensity of CD26/DPP‐4 expression on KCs was observed to occur with the HCD (Fig. 5I,J).
Figure 5.
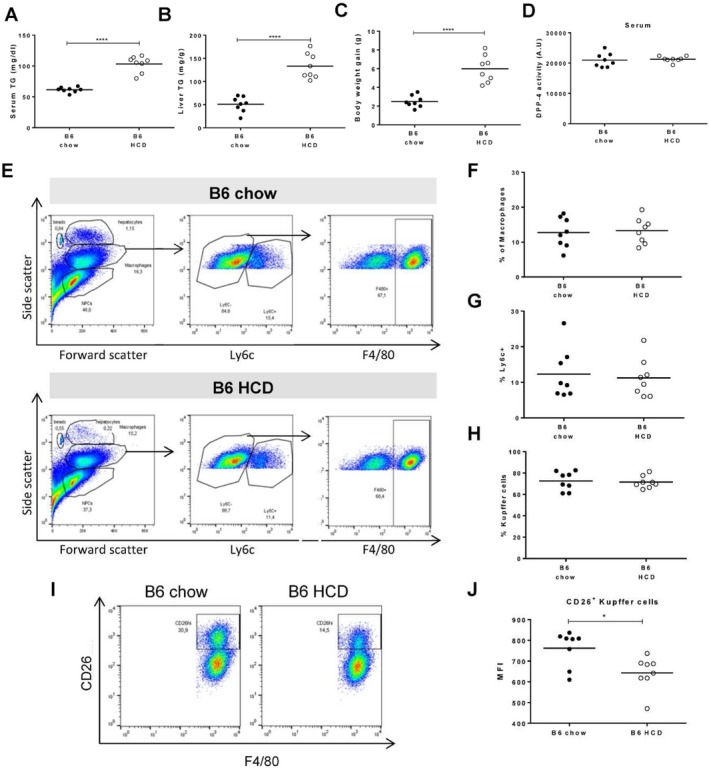
A hypercaloric diet induces CD26/DPP‐4 down‐modulation in Kupffer cells but does not alter serum CD26/DPP‐4 enzymatic activity. Triglycerides were quantified in the (A) serum and (B) liver of C57BL/6 (B6) mice exposed to 6 weeks of standard chow or an HCD. (C) Body weight gain and (D) serum CD26/DPP‐4 enzymatic activity (depicted in arbitrary units, representing the rate of substrate decay during the enzymatic assay) were quantified. (E) Flow cytometry plots illustrate the gating strategy for analysis of recruited bone marrow‐derived cells (Ly6c+) and Kupffer cells (F4/80+ cells among Ly6c–). (F) The proportion of cells within macrophage morphological gate, (G) proportion of Ly6c+ cells within this gate, and (H) proportion of Kupffer cells are represented for B6 on standard chow or HCD. (I) Flow cytometry plots identifying a CD26 high population among Kupffer cells in B6 mice fed with standard chow or HCD. (J) Median expression of CD26 in CD26+ Kupffer cells. Plots depict cumulative data from two independent experiments, n = 7‐8 mice/group; *P <0.05, ****P <0.0001 in unpaired t tests. Abbreviation: TG, triglyceride.
Depletion of KCs Leads to Marked Increase in Serum Levels of CD26/DPP‐4 Enzymatic Activity
We further tested the hypothesis that KC depletion in the absence of hepatocyte damage and marked inflammatory reaction leads to increased levels of serum CD26/DPP‐4 enzymatic activity. Intravenous injection of liposomes containing clodronate is widely used as a noninflammatory method to deplete phagocytic macrophages, being particularly efficient at targeting the KC compartment(25) (Supporting Fig. S6). We analyzed livers harvested at 2, 7, 14, and 30 days postinjection (Fig. 6A). KC depletion did not appear to induce significant changes in the Ly6c+ macrophage cell population, indicating that no major bone marrow monocyte recruitment was occurring (Fig. 6B‐D). As expected, the KC population was undetectable at day 2 postinjection and gradually recovered from day 7 to day 30 (Fig. 6E). Remarkably, serum CD26/DPP‐4 enzymatic activity increased significantly with KC depletion and re‐establishment of CD26/DPP‐4 basal levels followed the kinetics of KC replenishment (Fig. 6E,F). These results strongly suggest that, irrespective of patent parenchymal damage or significant recruitment of circulating hematopoietic cells, induction of dramatic perturbations in KC populations correlates with inverse alterations of serum CD26/DPP‐4 activity.
Figure 6.
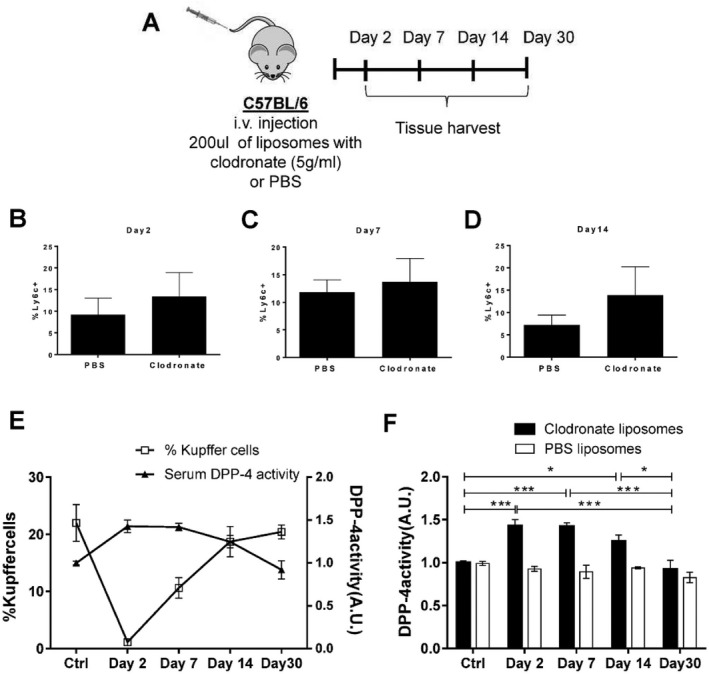
Depletion of Kupffer cells with clodronate liposomes induces an increase in serum CD26/DPP‐4 enzymatic levels. (A) Groups of three C57BL/6 males were injected with liposomes containing clodronate (5 g/mL) or PBS and analyzed at 2, 7, 14, and 30 days postinjection. The proportion of LY6C+ monocyte/macrophage cells in the liver at (B) day 2, (C) day 7, and (D) day 14 is represented. (E,F) The proportion of Kupffer cells is superimposed on the levels of serum CD26/DPP‐4 activity measured in treated mice and compared to untreated control mice at the same time points. Arbitrary units represent the rate of substrate decay during the enzymatic assay normalized to the average value of the controls. Scale bar, 100 μm. Mean values and error bars indicating SD are represented. *P <0.05, **P <0.01, and ***P <0.001 in one‐way analysis of variance using Tukey's multiple comparison test. Data are representative of two independent experiments, n = 3‐4 mice/group. Abbreviations: A.U., arbitrary units; i.v., intravenous.
CD26/DPP‐4 is not Required for KC Activation but is Secreted Following Proinflammatory Stimulation
To study the contribution of CD26/DPP‐4 to KC activation, we exposed sort‐purified KCs from C57BL/6 and CD26KO mice to LPS for 24 hours (Fig. 7). Secretion of TNF‐α and IL‐6 proinflammatory cytokines was similar in B6 and CD26KO KCs exposed to LPS (Fig. 7A,B). Likewise, treatment with sitagliptin, a specific DPP‐4 inhibitor that completely abrogated the CD26/DPP‐4 activity, did not impair induction of TNF‐α and IL‐6 secretion by KCs in response to LPS (Fig. 7C‐E). This suggests that CD26/DPP‐4 is not required for KC proinflammatory activation. Nevertheless, CD26/DPP‐4 enzymatic activity increased in the supernatant of LPS‐stimulated cultures (Fig. 7C). Furthermore, we observed that CD26/DPP‐4 activity in KC supernatants was decreased when KCs undergo cell death following exposure to liposomes containing clodronate (Fig. 7F,G). These results indicate that an increase in CD26/DPP‐4 release is an active response of KCs undergoing activation that could be involved in local liver repairing responses.
Figure 7.
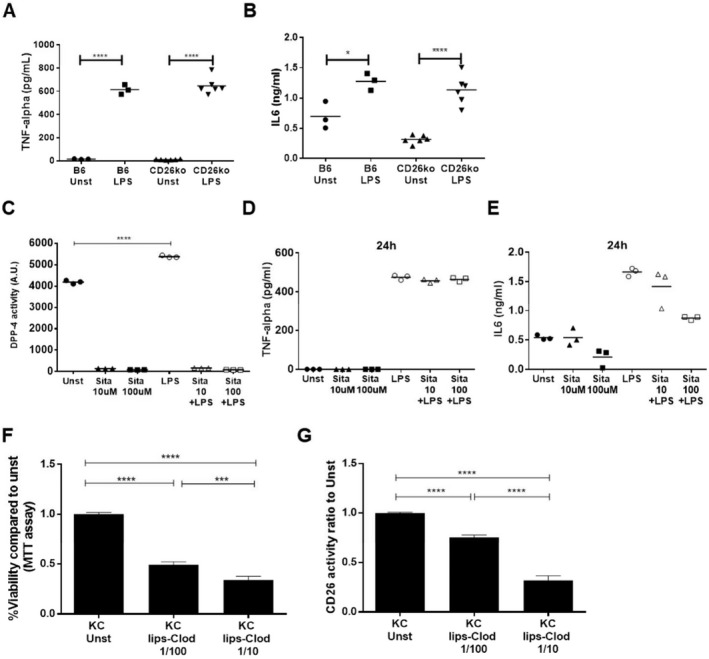
Genetic ablation or pharmacologic inhibition of CD26/DPP‐4 enzymatic activity does not prevent Kupffer cell activation in vitro. (A) TNF‐α secretion and (B) IL‐6 were measured by enzyme‐linked immunosorbent assay in the supernatant of sort‐purified Kupffer cells isolated from C57BL/6 (B6) and CD26KO mice, either unstimulated or stimulated in vitro with 1 μg/mL LPS. (C) CD26/DPP‐4 enzymatic activity, (D) TNF‐α, and (E) IL‐6 secretion by Kupffer cells from B6 mice were also measured in the presence or absence of 10 μM or 100 μM of the DPP‐4 inhibitor sitagliptin with or without LPS stimulation (1 μg/mL, 24 hours). (F) Sort‐purified Kupffer cells were incubated for 24 hours with clodronate‐containing liposomes (5 g/mL) diluted 1/10 or 1/100 in cell culture medium; cell viability was assessed using the MTT assay, and (G) CD26/DPP‐4 enzymatic activity in the supernatant was quantified. Arbitrary units represent the rate of substrate decay during the enzymatic assay either normalized (G) or not (C) to the average value of the controls. *P <0.05, **P <0.01, ***P <0.001, and ****P <0.0001 in one‐way analysis of variance with Tukey's correction. Data are representative of at least two independent experiments. Abbreviations: A.U., arbitrary units; lips‐Clod, liposome‐clodronate; MTT, 3‐(4,5‐dimethylthiazol‐2‐yl)‐2,5‐diphenyltetrazolium bromide; Sita, sitagliptin; Unst, unstimulated.
Discussion
This work revealed that CD26/DPP‐4 enzymatic activity exerts unexpected beneficial effects in the recovery response to hepatocyte damage. We found that the influx of infiltrating hematopoietic CD45+ cells and the necrosis response at initial stages of APAP‐induced hepatotoxic damage (24 hours) were not affected by CD26 genetic ablation or pharmacologic inhibition of CD26/DPP‐4. However, at the recovery time point (72 hours), the proportion of infiltrating CD45+ cells was still significantly increased and noticeable necrosis persisted when CD26/DPP‐4 enzymatic ability was disabled. These findings support the hypothesis that CD26/DPP‐4 enzymatic activity plays a role in controlling leukocyte infiltration in the damaged liver and in resolving hepatic necrosis during recovery from acute liver injury.
In addition, we observed that extensive shifts in liver macrophage populations, consequent to acute and chronic liver injury, entail marked reductions in the typical KC population that are associated with increased CD26/DPP‐4 enzymatic activity in the serum. Interestingly, depletion of KCs induced by clodronate‐loaded liposomes also correlated with increased serum CD26/DPP‐4 enzymatic activity, suggesting that the critical triggering factor is the reduction of KCs in the liver and not the inflammatory response related to tissue damage. Accordingly, short exposure to an HCD that failed to induce perturbations in the KC proportions also showed unaltered serum CD26/DPP‐4 enzymatic levels, despite inducing increased triglyceride production and weight gain. These results suggest that in the absence of major perturbations in the KC population, metabolic changes in hepatocytes are not sufficient to augment the CD26/DPP‐4 enzymatic activity in the serum.
CD26/DPP‐4 acts as a posttranslational modifier of certain chemokines(26) and thereby could mediate or facilitate the migration/expansion of cells involved in faster clearance of the inflamed microenvironment, controlling the recovery dynamics of cell population niches, namely KCs. It is remarkable that the time course correlation of CD26/DPP‐4 serum activity and KC depletion/recovery was similar in the CCl4 chronic liver model and in the model of clodronate‐induced depletion. This indicates that during the response to liver damage significant alterations in the levels of circulating CD26/DPP‐4 are mirroring KC reduction/recovery phases and represent a quantitative marker of major perturbations in this cell compartment. Interestingly, these results are in accordance with previous observations reporting increases in DPP‐4 enzymatic levels in patients with severe liver pathology.(8, 16)
The cellular contribution to increased serum CD26/DPP‐4 enzymatic activity that we observed in models of perturbed liver homeostasis remains unclear. We have noted a reduction of CD26/DPP‐4 surface expression in KCs under exposure to an HCD and in hematopoietic cells in mice receiving APAP treatment that did not correlate with the dynamics of CD26/DPP‐4 serum activity. Thus, down‐modulation of CD26/DPP‐4 expression appears to be functionally related to cell activation but not with the increased levels of CD26/DPP‐4 in the serum. CD26/DPP‐4 could be released by KCs undergoing depletion; however, we found that in vitro induction of KC death does not lead to CD26/DPP‐4 release. Nevertheless, these findings raise the possibility that local CD26/DPP‐4 release by activated KCs could promote tissue repair responses that are impaired in CD26KO mice. On the other hand, vascular endothelial cells and to some extent bone marrow‐derived hematopoietic cells have been shown to contribute to steady‐state serum DPP‐4 levels.(11) Recruited hematopoietic cells could contribute to serum CD26/DPP‐4 activity during the acute inflammatory phase of disease, but the serum enzymatic activity remained elevated during recovery periods when hematopoietic recruitment in the liver damage models was already significantly reduced. Furthermore, hematopoietic cell recruitment does not explain the alterations in serum CD26/DPP‐4 activity in the noninflammatory model of KC depletion by clodronate liposome injection.
In the liver, KCs are in close contact with liver sinusoidal endothelial cells.(27) Genetic ablation of DPP‐4 expression on vascular endothelial cells caused down‐regulation of CD26/DPP‐4 gene expression and reduction of DPP‐4 activity in liver tissue and in serum; this provides a link between liver endothelial cells and peripheral DPP‐4 activity.(11) It is possible that significant shifts in resident KC populations are perceived as signals for other liver NPC activation, leaving open the possibility that endothelial cells respond by releasing soluble CD26/DPP‐4 into circulation or propagating the signaling leading to vascular release of the enzyme.
Our results in mouse models of induced acute hepatotoxicity suggest that CD26/DPP‐4 inhibition therapies may be detrimental in patients with acute liver damage. Nevertheless, CD26/DPP‐4 inhibition in experimental models of fibrosis development appears to be beneficial.(20, 21, 28) Pharmacologic inhibition of CD26/DPP‐4 in rats was shown to prevent porcine serum‐induced fibrosis due to attenuation of hepatic stellate cell activation.(20) In addition, it was reported that CD26KO mice are protected from CCL4‐induced chronic fibrosis, showing decreased inflammation and recruitment of B lymphocytes and reduced alterations in energy metabolism.(21) Together, these observations concur with the possibility that CD26/DPP‐4 plays a dual role in acute liver damage and in fibrosis response. Recently, expression of CD26/DPP‐4 was identified as a marker of cell senescence and a contributor to the development of this cellular program.(29) Interestingly, senescence was shown to be required for swift wound healing after liver injury in young organisms but highly unfavorable when there is persistence of the insult, as observed in severe chronic liver disease.(30) Given that CD26/DPP‐4 is multifunctional and ubiquitous, it is plausible that the liver microenvironment and inflammatory context govern the outcomes of CD26/DPP‐4 action.
In summary, we uncovered a novel role for CD26/DPP‐4 activity during liver pathology. We found that CD26/DPP‐4 enzymatic activity licenses the swift resolution of drug‐induced liver necrosis in acute liver damage. Furthermore, we unveiled that drastic changes in KC populations lead to alterations in serum CD26/DPP‐4 activity that holds potential value as a biomarker and quantitative sensor of the KC niche during clinical and subclinical liver conditions.
Potential conflict of interest
Nothing to report.
Supporting information
Acknowledgment
The authors acknowledge the histology and the flow cytometry units at Instituto Gulbenkian de Ciência, in particular Dr. Rui Pedro Faísca and Cláudia Bispo for excellent technical assistance.
View this article online at wileyonlinelibrary.com.
Funding
Supported by the Fundação para a Ciência e Tecnologia (grant no. PTDC/BIM‐MET/0486/2012), iNOVA4Health (UID/Multi/04462/2013), the European Commission Marie Skłodowska‐Curie Actions H2020 (grant agreements no. 722619 and no. 734719), the Sociedade Portuguesa de Diabetologia Bolsa Charneco da Costa 2017, and a Fundação para a Ciência e Tecnologia fellowship no. PD/BD/105997/2014 to I.C.
Contributor Information
Carlos Penha‐Gonçalves, Email: cpenha@igc.gulbenkian.pt.
Maria Paula Macedo, Email: paula.macedo@nms.unl.pt.
References
- 1. De Meester I, Korom S, Van Damme J, Scharpé S. CD26, let it cut or cut it down. Immunol Today 1999;20:367‐375. [DOI] [PubMed] [Google Scholar]
- 2. Hopsu‐Havu VK, Glenner GG. A new dipeptide naphthylamidase hydrolyzing glycyl‐prolyl‐beta‐naphthylamide. Histochemie 1966;7:197‐201. [DOI] [PubMed] [Google Scholar]
- 3. Drucker DJ, Nauck MA. The incretin system: glucagon‐like peptide‐1 receptor agonists and dipeptidyl peptidase‐4 inhibitors in type 2 diabetes. Lancet 2006;368:1696‐1705. [DOI] [PubMed] [Google Scholar]
- 4. Barreira da Silva R, Laird ME, Yatim N, Fiette L, Ingersoll MA, Albert ML. Dipeptidylpeptidase 4 inhibition enhances lymphocyte trafficking, improving both naturally occurring tumor immunity and immunotherapy. Nat Immunol 2015;16:850‐858. [DOI] [PubMed] [Google Scholar]
- 5. Klemann C, Wagner L, Stephan M, von Hörsten S. Cut to the chase: a review of CD26/dipeptidyl peptidase‐4's (DPP4) entanglement in the immune system. Clin Exp Immunol 2016;185:1‐21. [DOI] [PMC free article] [PubMed] [Google Scholar]
- 6. Röhrborn D, Wronkowitz N, Eckel J. DPP4 in diabetes. Front Immunol 2015;6:386. [DOI] [PMC free article] [PubMed] [Google Scholar]
- 7. Kim N‐H, Yu T, Lee DH. The nonglycemic actions of dipeptidyl peptidase‐4 inhibitors. Biomed Res Int 2014;2014:368703. [DOI] [PMC free article] [PubMed] [Google Scholar]
- 8. Cordero OJ, Salgado FJ, Nogueira M. On the origin of serum CD26 and its altered concentration in cancer patients. CancerImmunol Immunother 2009;58:1723‐1747. [DOI] [PMC free article] [PubMed] [Google Scholar]
- 9. Ansorge S, Nordhoff K, Bank U, Heimburg A, Julius H, Breyer D, et al. Novel aspects of cellular action of dipeptidyl peptidase IV/CD26. Biol Chem 2011;392:153‐168. [DOI] [PubMed] [Google Scholar]
- 10. Röhrborn D, Eckel J, Sell H. Shedding of dipeptidyl peptidase 4 is mediated by metalloproteases and up‐regulated by hypoxia in human adipocytes and smooth muscle cells. FEBS Lett 2014;588:3870‐3877. [DOI] [PubMed] [Google Scholar]
- 11. Mulvihill EE, Varin EM, Gladanac B, Campbell JE, Ussher JR, Baggio LL, et al. Cellular sites and mechanisms linking reduction of dipeptidyl peptidase‐4 activity to control of incretin hormone action and glucose homeostasis. CellMetab 2017;25:152‐165. [DOI] [PubMed] [Google Scholar]
- 12. Baumeier C, Saussenthaler S, Kammel A, Jähnert M, Schlüter L, Hesse D, et al. Hepatic DPP4 DNA methylation associates with fatty liver. Diabetes 2017;66:25‐35. [DOI] [PubMed] [Google Scholar]
- 13. Fukui Y, Yamamoto A, Kyoden T, Kato K, Tashiro Y. Quantitative immunogold localization of dipeptidyl peptidase IV (DPP IV) in rat liver cells. CellStruct Funct 1990;15:117‐125. [DOI] [PubMed] [Google Scholar]
- 14. Ju C, Tacke F. Hepatic macrophages in homeostasis and liver diseases: from pathogenesis to novel therapeutic strategies. Cell Mol Immunol 2016;13:316‐327. [DOI] [PMC free article] [PubMed] [Google Scholar]
- 15. Duarte N, Coelho IC, Patarrão RS, Almeida JI, Penha‐Gonçalves C, Macedo MP. How inflammation impinges on NAFLD: a role for Kupffer cells. Biomed Res Int 2015;2015:984578. [DOI] [PMC free article] [PubMed] [Google Scholar]
- 16. Bae EJ. DPP‐4 inhibitors in diabetic complications: role of DPP‐4 beyond glucose control. Arch Pharm Res 2016;39:1114‐1128. Erratum. In: Arch Pharm Res 2016;39:1335. [DOI] [PubMed] [Google Scholar]
- 17. Smits MM, Tonneijck L, Muskiet MH, Kramer MH, Pouwels PJ, Pieters‐van den Bos IC, et al. Twelve week liraglutide or sitagliptin does not affect hepatic fat in type 2 diabetes: a randomised placebo‐controlled trial. Diabetologia 2016;59:2588‐2593. [DOI] [PMC free article] [PubMed] [Google Scholar]
- 18. Cui J, Philo L, Nguyen P, Hofflich H, Hernandez C, Bettencourt R, et al. Sitagliptin vs. placebo for non‐alcoholic fatty liver disease: a randomized controlled trial. J Hepatol 2016;65:369‐376. [DOI] [PMC free article] [PubMed] [Google Scholar]
- 19. Tilg H, Moschen AR, Roden M. NAFLD and diabetes mellitus. Nat Rev Gastroenterol Hepatol 2017;14:32‐42. [DOI] [PubMed] [Google Scholar]
- 20. Kaji K, Yoshiji H, Ikenaka Y, Noguchi R, Aihara Y, Douhara A, et al. Dipeptidyl peptidase‐4 inhibitor attenuates hepatic fibrosis via suppression of activated hepatic stellate cell in rats. J Gastroenterol 2014;49:481‐491. [DOI] [PubMed] [Google Scholar]
- 21. Wang XM, Holz LE, Chowdhury S, Cordoba SP, Evans KA, Gall MG, et al. The pro‐fibrotic role of dipeptidyl peptidase 4 in carbon tetrachloride‐induced experimental liver injury. Immunol Cell Biol 2017;95:443‐453. [DOI] [PubMed] [Google Scholar]
- 22. Gonçalves LA, Rodo J, Rodrigues‐Duarte L, de Moraes LV, Penha‐gonçalves C. HGF secreted by activated Kupffer cells induces apoptosis of plasmodium‐infected hepatocytes. Front Immunol 2017;8:90. [DOI] [PMC free article] [PubMed] [Google Scholar]
- 23. Zigmond E, Samia‐Grinberg S, Pasmanik‐Chor M, Brazowski E, Shibolet O, Halpern Z, et al. Infiltrating monocyte‐derived macrophages and resident kupffer cells display different ontogeny and functions in acute liver injury. J Immunol 2014;193:344‐353. [DOI] [PubMed] [Google Scholar]
- 24. Ramachandran P, Pellicoro A, Vernon M a, Boulter L, Aucott RL, Ali A, et al. Differential Ly‐6C expression identifies the recruited macrophage phenotype, which orchestrates the regression of murine liver fibrosis. Proc Natl Acad Sci U S A 2012;109:E3186‐E195. [DOI] [PMC free article] [PubMed] [Google Scholar]
- 25. Van Rooijen N, Sanders A. Kupffer cell depletion by liposome‐delivered drugs: comparative activity of intracellular clodronate, propamidine, and ethylenediaminetetraacetic acid. Hepatology 1996;23:1239‐1243. [DOI] [PubMed] [Google Scholar]
- 26. Mortier A, Gouwy M, Van Damme J, Proost P, Struyf S. CD26/dipeptidylpeptidase IV‐chemokine interactions: double‐edged regulation of inflammation and tumor biology. J Leukoc Biol 2016;99:955‐969. [DOI] [PMC free article] [PubMed] [Google Scholar]
- 27. Malarkey DE, Johnson K, Ryan L, Boorman G, Maronpot RR. New insights into functional aspects of liver morphology. Toxicol Pathol 2005;33:27‐34. [DOI] [PubMed] [Google Scholar]
- 28. Abo‐Haded HM, Elkablawy MA, Al‐Johani Z, Al‐Ahmadi O, El‐Agamy DS. Hepatoprotective effect of sitagliptin against methotrexate induced liver toxicity. PLoS One 2017;12:e0174295. [DOI] [PMC free article] [PubMed] [Google Scholar]
- 29. Kim KM, Noh JH, Bodogai M, Martindale JL, Yang X, Indig FE, et al. Identification of senescent cell surface targetable protein DPP4. Genes Dev 2017;31:1529‐1534. [DOI] [PMC free article] [PubMed] [Google Scholar]
- 30. Aravinthan AD, Alexander GJM. Senescence in chronic liver disease: is the future in aging? J Hepatol 2016;65:825‐834. [DOI] [PubMed] [Google Scholar]
Associated Data
This section collects any data citations, data availability statements, or supplementary materials included in this article.
Supplementary Materials


