Abstract
Drug‐induced liver injury (DILI) is a serious worldwide health problem that accounts for more than 50% of acute liver failure. There is a great interest in clinical diagnosis and pharmaceutical industry to elucidate underlying molecular mechanisms and find noninvasive biomarkers for this pathology. Cell‐secreted extracellular vesicles (EVs) have provided a new biological source to identify low disease invasive markers. Despite the intense research developed on these vesicles, there is currently a gap on their patho‐physiological effects. Here, we study EVs secreted by primary rat hepatocytes challenged with galactatosamine (GalN), acetaminophen, or diclofenac as DILI in vitromodels. Proteomics analysis of these EVs revealed an increase in enzymes already associated with liver damage, such as catecholamine‐methyl transferase and arginase 1. An increase in translation‐related proteins and a decrease in regulators of apoptosis were also observed. In addition, we show the presence of enzymatic activity of P450 cytochrome 2d1 in EVs. The activity specifically is decreased in EVs secreted by hepatocytes after acetaminophen treatment and increased in EVs derived from GalN‐treated hepatocytes. By using in vivo preclinical models, we demonstrate the presence of this cytochrome activity in circulation under normal conditions and an increased activity after GalN‐induced injury. Conclusion: Hepatocyte‐secreted EVs carry active xenobiotic‐metabolizing enzymes that might be relevant in extracellular metabolism of drugs and be associated with DILI. (Hepatology Communications 2018;0:00‐00)
Abbreviations
- ADR
adverse drug reaction
- APAP
acetaminophen
- Arg1
arginase 1
- Comt
catecholamine‐methyl transferase
- CYP
cytochrome
- DCF
diclofenac
- DILI
drug‐induced liver injury
- EV
extracellular vesicle
- FDR
false discovery rate
- GalN
galactatosamine
- GOT
glutamic oxaloacetic transaminase
- LPS
lipopolysaccharide
- MTT
3‐(4,5‐dimethylthiazol‐2‐yl)‐2,5‐diphenyltetrazolium bromide
- NTA
nanoparticle tracking analysis
- PBS
phosphate‐buffered saline
- and SEC
size‐exclusion chromatography
The liver is prone to xenobiotic‐induced injury because of its central role in drug metabolism and is generally crucial for most detoxification processes.1) Drug‐induced liver injury (DILI) remains a major cause of worldwide mortality2) and can lead to a wide variety of pathological conditions,3 acute hepatitis being the predominant form.4 The idiosyncratic nature and poor prognosis of DILI makes it a major safety issue during drug development,5 representing a serious clinical and financial problem. Indeed, adverse drug reactions (ADRs) are estimated to cost billions of dollars and result in tens of thousands of deaths.6 DILI is initiated by enzyme‐mediated bioactivation of drugs to chemically reactive metabolites, causing a damage that can culminate in cell death and possible liver failure.5 Cytochromes (CYPs) are a family of hemeproteins that are essential in the metabolism of drugs and other xenobiotics.7 CYPs are a major source of variability in drug pharmacokinetics and response8 and can be inhibited or induced by drugs, resulting in clinically significant drug–drug interactions that can cause unanticipated ADRs or therapeutic failures.9
Our previous works demonstrated that hepatocyte‐secreted extracellular vesicles (EVs) carry cytochrome P450 2d1 (CYP2d1),10, 11 rat orthologous of human CYP2D6, which, although it accounts for only a small percentage of all hepatic CYPs (approximately 2%‐4%), plays a key role in the metabolism of drugs and other xenobiotics. In fact, it is involved in the metabolism of up to 25% of the clinically available drugs from virtually all therapeutic classes.12, 13 In the current work, we characterize EVs secreted by hepatocytes challenged with galactosamine (GalN) and two hepatotoxic models of DILI, such as acetaminophen (APAP)14, 15 or diclofenac (DCF).14, 16 The results show that the presence of CYP2d1 enzyme decreases in APAP‐treated hepatocytes and increases in EVs derived from GalN‐treated hepatocytes, and importantly, the enzyme is active in EVs.
Remarkably, the existing interindividual variability in the expression and activity of CYPs results in extensive differences among individuals in the metabolism of drugs.17 Given this variability, predicting the fate of a drug in a particular patient and the subsequent response remains a challenge and is far from being applied to routine clinical practice. Thus, our work opens the possibility to measure CYP activity in predicting DILI in a personalized way by measuring the activity in circulating EVs. In this way, an individual hepatic response could be estimated to determine drug optimal doses and avoid ADRs.
Materials and Methods
See the extended version of experimental procedures in the Supporting Information.
Reagents
Diclofenac sodium, acetaminophen, D‐galactosamine hydrochloride, and lipopolysaccharide were acquired from Sigma‐Aldrich (St. Louis, MO).
Animal Experimentation
Animal experimentation was conducted in accordance with the Spanish Guide for the Care and Use of Laboratory Animals (RD 1201/2005–BOE 21/10/05) and the protocols were approved by the CIC bioGUNE Ethical Review Committee (Ref. 14/901/000/6106) accredited by the AAALAC organization. Forty‐two male 14‐week‐old Wistar rats (body weight 300 g to 400 g) were maintained with standard diet (Rodent Maintenance Diet, Harlan Teklad Global Diet 2014) and water ad libitum. Ten rats were allocated to perform liver perfusion to obtain primary cultures of hepatocytes and their corresponding secreted EVs. Liver perfusion was performed by using the two‐step collagenase technique.18 The remaining 32 rats were randomly allocated to four experimental groups. The GalN group (n = 8) received an intraperitoneal injection of 1000 mg/kg/5 mL of D‐galactosamine hydrochloride dissolved in 0.9% NaCl, and 18 hours later blood samples were drawn from caudal artery. The APAP group (n = 8) received 600 mg/kg/5 mL orally using as vehicle 0.25% xanthan gum dissolved in 0.9% NaCl, and 18 hours later blood samples were drawn from caudal artery. The lipopolysaccharide (LPS)/DCF group (n = 8) received first an intravenous injection of LPS E. coli (58 × 106 EU/kg/5 mL) and 2 hours later an intraperitoneal injection of DCF (20 mg/kg/5 mL). Blood samples were drawn from caudal artery 6 hours later. Finally, the control (mock) group (n = 8) was divided among four animals for intraperitoneal administration of 0.9% NaCl (5 mL/kg) and the other four for oral administration of 0.25% xanthan gum dissolved in 0.9% NaCl (5 mL/kg). Blood samples in the mock groups were drawn 18 hours after the treatment. No differences in any of the measured parameters were found between the two mock groups; consequently, they were treated as a single group. Blood samples were collected in serum separation tubes (Microtainer, Becton‐Dickinson), allowed to clot for 30 minutes at room temperature, and centrifuged for 5 minutes at 6000g at 4°C, according to the manufacturer's instructions. Serum was stored at −80°C until needed for the assays. An aliquot of 250 μL of serum from each animal was used to determine glutamic oxaloacetic transaminase (GOT) and Cyp2d1 activities.
Primary Rat Hepatocyte Culture and EV Isolation
Hepatocytes were seeded in collagen‐coated 150‐mm dishes, at 15 million to 30 million cells per dish and cultured in complete Dulbecco's modified Eagle's medium (DMEM) for 4 hours at 37°C and 5% of CO2. They were washed twice with Dulbecco's modified phosphate‐buffered saline (PBS) and incubated for 36 hours in 25‐mM HEPES (4‐[2‐hydroxyethyl]‐1‐piperazine ethanesulfonic acid) containing complete DMEM. The medium was depleted of contaminating vesicles by overnight centrifugation at 110,000g.19 For drug treatments, the compounds were added to the vesicle‐depleted media to the final concentration of 10 mM APAP, 400 μM DCF, or 10 mM GalN. After 36 hours, cells and media were collected and processed for EV isolation. Briefly, the culture supernatant was centrifuged at 1500g for 10 minutes to remove lifted cells and cellular debris as well as large microvesicles/microparticles and apoptotic bodies. The resultant supernatant was subjected to filtration on 0.22‐μm pore filters (Filter System, Corning). Afterward the filtrate was centrifuged at 10,000g and 100,000g for 30 minutes and 60 minutes, respectively. The pellet was suspended in PBS and again centrifuged at 100,000g for 60 minutes. The final pellet of small EVs was suspended in 150 μL of PBS and stored at −80°C. Protein concentration was determined with Bradford Assay (Bio‐Rad Laboratories Inc.) using bovine serum albumin (BSA) as standard.
Cell Viability Analysis
MTT assay was performed by using the reagent 3‐(4,5‐dimethylthiazol‐2‐yl)‐2,5‐diphenyltetrazolium bromide. Briefly, primary rat hepatocytes were seeded in a 24‐well plate at a rate of 5 × 10⁴ cells/well and incubated with 0.5 ng/uL of MTT for 45 minutes at 37°C. The crystals were dissolved in DMSO + isopropanol and the absorbance was measured on a microplate reader at a wavelength of 570 nm. Cell viability of cell‐producing EVs was also measured with a benchtop‐automated cell counter (Countess, Life Technologies) by using trypan blue staining.
Nanoparticle Tracking Analysis
Size distribution and concentration of EV preparations were determined by measuring the rate of Brownian motion using a NanoSight LM10 system (Malvern, United Kingdom). Nanoparticle tracking analysis (NTA) postacquisition settings were kept constant for all samples, and each video was analyzed to give the mean, mode, and median vesicle size and an estimate of the concentration.20
Cryo‐electron Microscopy
EV preparations were directly adsorbed onto glow‐discharged holey carbon grids (QUANTIFOIL, Germany). Grids were blotted at 95% humidity and rapidly plunged into liquid ethane with the aid of VITROBOT (Maastricht Instruments BV, Netherlands). Vitrified samples were imaged at liquid nitrogen temperature using a JEM‐2200FS/CR transmission cryo‐electron microscope (JEOL, Japan) equipped with a field emission gun and operated at an acceleration voltage of 200 kV. In cryo‐electron microscope sessions, digital images were taken using a low‐dose technique by means of an ULTRASCAN 4000SP (4096 × 4096) cooled slow‐scan charged‐coupled device camera (GATAN). An in‐column energy filter (Omega Filter) was used to improve the signal‐to‐noise ratio of these images by zero‐loss filtering.
Proteomics Analysis
An equivalent volume of a solution containing 7 M urea/2 M thiourea/4% CHAPS (3‐[(3‐cholamidopropyl)dimethylammonio]‐1‐propanesulfonate)/100‐mM dithiothreitol was added to the EV samples for protein extraction and incubated under agitation for 30 minutes. The sample was vortexed for 30 seconds every 10 minutes of incubation. In‐solution digestion was carried out following filter‐aided sample‐preparation protocol with minor variations.21 Peptides were recovered from the filter units and subjected to ethyl acetate extraction following the protocol described by Yeung and Stanley.22 Samples were further desalted using stage‐tip C18 microcolumns (Zip‐tip, Millipore), and peptides were resuspended in 0.1% formic acid prior to mass spectrometry analysis. Peptide separation was performed on a nanoACQUITY UPLC system (Waters) connected to an LTQ Orbitrap XL mass spectrometer (Thermo Electron) or a Synapt G2 Si (Waters). Database searches were performed using Mascot search engine version 2.1 (Matrix Science) through Proteome Discoverer 1.4 (Thermo Electron). Spectra were searched against a Rattus norvegicus database obtained from Uniprot/Swissprot (version 2016_03). A decoy search was carried out to estimate the false discovery rate (FDR). Only peptides with an FDR of less than 1% were selected. Progenesis LC‐MS (version 4.0.4265.42984, Nonlinear Dynamics) was used for the label‐free differential protein expression. Proteins quantified with at least two different peptides identified with an FDR of less than 1% were kept for the differential analysis. Among these, those with a t test P value of less than 0.05 in any of the comparisons were considered as significantly deregulated.
Network Building and Annotation
Differentially expressed proteins (Supporting Table S1) were loaded in the string App of Cytoscape v.3.6.0 software. Enrichment analyses were retrieved with stringApp for Biological Process, Cellular Component, Molecular Function categories, and KEGG pathways.
Western Blot Analysis
Cells (1 × 10⁶) were lysed for 15 minutes on ice in a lysis buffer (1% Triton X‐100, 300 mM NaCl, 50 mM Tris‐HCl, pH 7.4). The protein concentration of cell extract and EVs was determined by Bradford protein assay using BSA as standard. NuPAGE LDS Sample Buffer (Life Technologies Inc.) was added to the samples and incubated for 5 minutes at 37°C, 65°C, and 95°C, and separated on 4%‐12% precasted gels from Thermo Scientific Inc. All proteins were detected under nonreducing conditions.
CYP2d1 Activity Assay and GOT Transaminase Activity
Luminescent assays that measure the activity of CYP P450 2D6 were used to determine the activity of its rat ortholog CYP P450 2d1 (Promega). GOT activity in serum was determined by using an automated analyzer (Selectra Junior Spinlab 100, Vital Scientific, Dieren, Netherlands; Spinreact, Girona, Spain) according to the manufacturers' instructions.
Size‐Exclusion Chromatography Analysis of Rat Serum Samples
Size‐exclusion chromatography (SEC) was performed by modifying an existing published protocol (Boing, 2014 #54). Briefly, sepharose CL‐2B (Sigma‐Aldrich) was packed in a poly‐prep chromatography column (BioRad) with 2 mL of bed volume. A 250‐uL sample of serum was allowed to enter in the column and eluted with 2 mL of PBS, collecting fractions of 200 uL each. Cytochrome activity was assayed directly with 5 uL of each fraction. An aliquot of 180 uL of each fraction was ultracentrifuged at 100,000g for 75 minutes, and sediment was resuspended in 20 uL of PBS and analyzed by western blotting.
Results
EV Characterization
To study the effects of DILI on secretion and composition of small EVs, we treated primary rat hepatocytes with drugs known to cause DILI, including APAP and DCF, and compared them with a well‐characterized drug used as a model of hepatic damage, GalN. We evaluated the viability of the hepatocytes directly by trypan‐blue extrusion assay after 36 hours of treatment with 10 mM, 0.4 mM, and 10 mM of APAP, DCF, and GalN, respectively. We performed 10 independent biological replicates, and although this method indicated that APAP produces a reduction of 15% in the viability of the hepatocytes (Fig. 1A) by MTT assays, all of the treatments showed a significant cellular toxicity (Fig. 1B). Next, we examined the amount of small EVs secreted by these hepatocytes by collecting the tissue culture media, removing lifted and cell debris at 1000g and isolating EVs by filtration through 0.22 μm followed by differential ultracentrifugation at 10000g and 100000g. The isolated material was characterized by NTA and protein measurement using the Bradford assay. The NTA revealed that all treatments significantly affect the number of secreted particles. This number increased an average of 4.5‐, 3.8‐, and 3.5‐fold in APAP‐, GalN‐, and DCF‐treated hepatocytes, respectively, in comparison to untreated cells (Fig. 2A). The increased secretion levels of particles caused by the treatments were also supported by determining total protein amount (Fig. 2B), which correlated with the NTA measurements. These data together indicate that under our conditions, APAP produced the highest increase in the secretion, followed by DCF and GalN. Next, we evaluated the effect of the treatments on the morphology and size distribution of the particles. Cryo‐electron microscopy revealed the presence of membrane vesicles in all cases (Fig. 3A), although a high heterogeneity of vesicles was observed in all of the preparations in terms of size and shape. In many cases, it was possible to observe vesicles inside the vesicles (Fig. 3A). In the case of DCF‐treated hepatocytes, in addition to rounded vesicles, the presence of a higher amount of amorphous nonvesicular material was observed in comparison with the other conditions (Fig. 3A). Regarding the size distribution, NTA of EVs obtained from untreated hepatocytes showed two main populations ranging between 110 nm and 180 nm (Fig. 3B). Interestingly, the size distribution of the particles was modified by all treatments (Fig. 3B). In the case of GalN and DCF treatments, the profiles showed these two main vesicle populations, although they were less pronounced compared with untreated hepatocytes. In contrast, in APAP treatment there was a clear main‐population average size of 130 nm (Fig. 3B). Overall, these analyses revealed that DILI conditions increase secretion of vesicles that also alter their size distribution.
Figure 1.
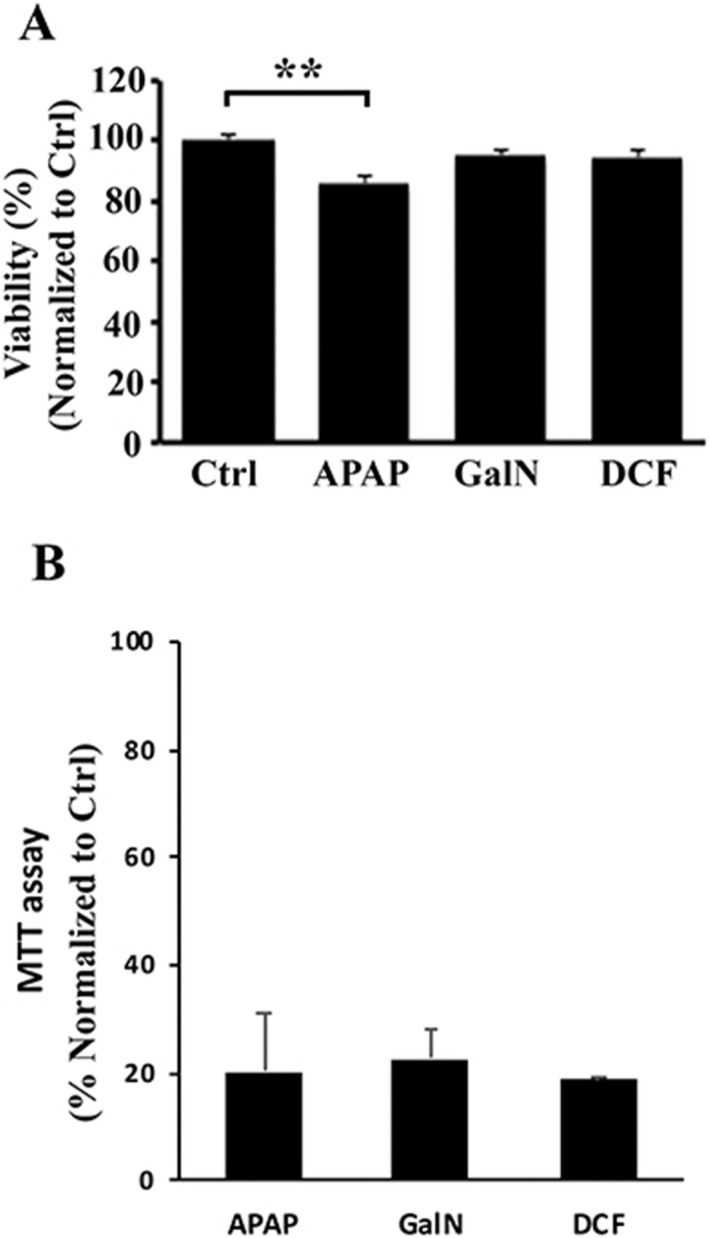
Cellular viability analysis of rat hepatocytes exposed to liver‐damaging drugs. (A) Cell viability of primary rat hepatocytes was evaluated by trypan‐blue exclusion method after culture for 36 hours in the presence of APAP (10 mM), GalN (10 mM), or DCF (0.4 mM). Error bars represent standard error of 10 biological replicates (n = 10) for each condition. **P < 0.01. (B) Cell toxicity of primary rat hepatocytes was evaluated by MTT assay after culture for 36 hours in the presence of APAP (10 mM), GalN (10 mM), or DCF (0.4 mM). Error bars represent SD of two independent experiments done in triplicate for each condition.
Figure 2.
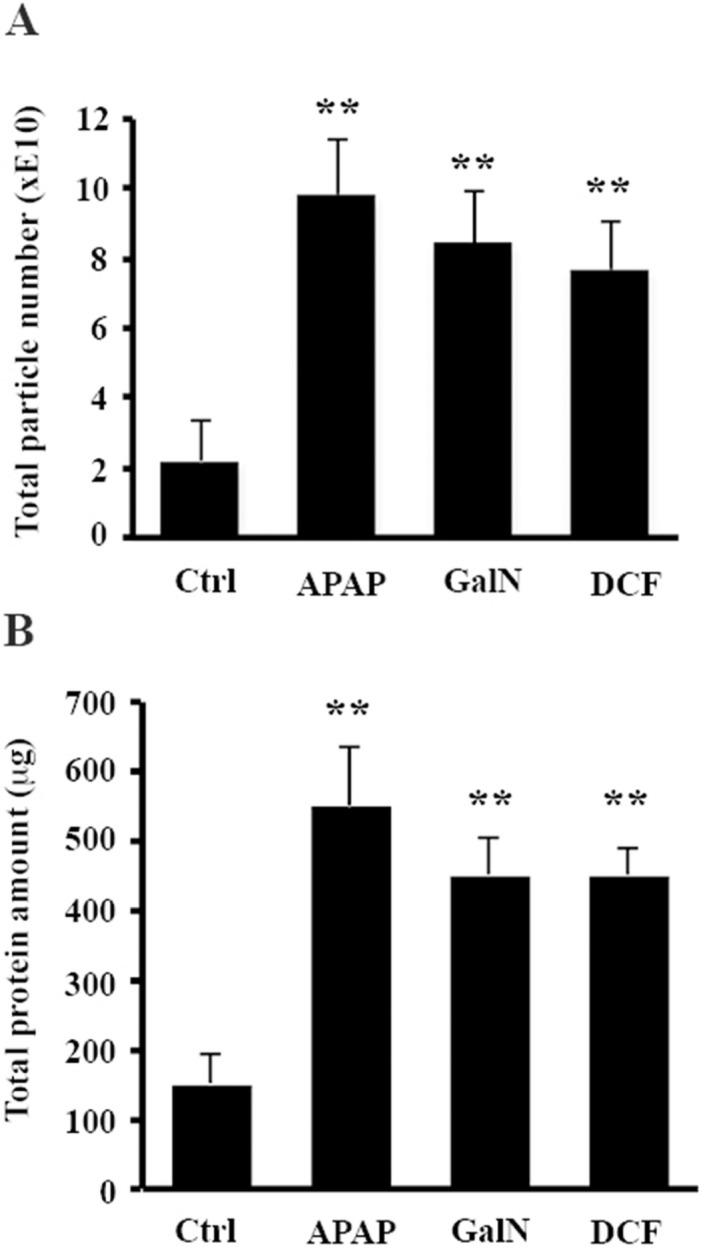
Drug effects on hepatocytes' EV secretion. (A) Total number of secreted particles was estimated by means of NTA. (B) Total protein amount contained in EV preparation was determined by Bradford assay. Error bars represent SD of 10 biological replicates (n = 10) for each condition. **P< 0.01.
Figure 3.
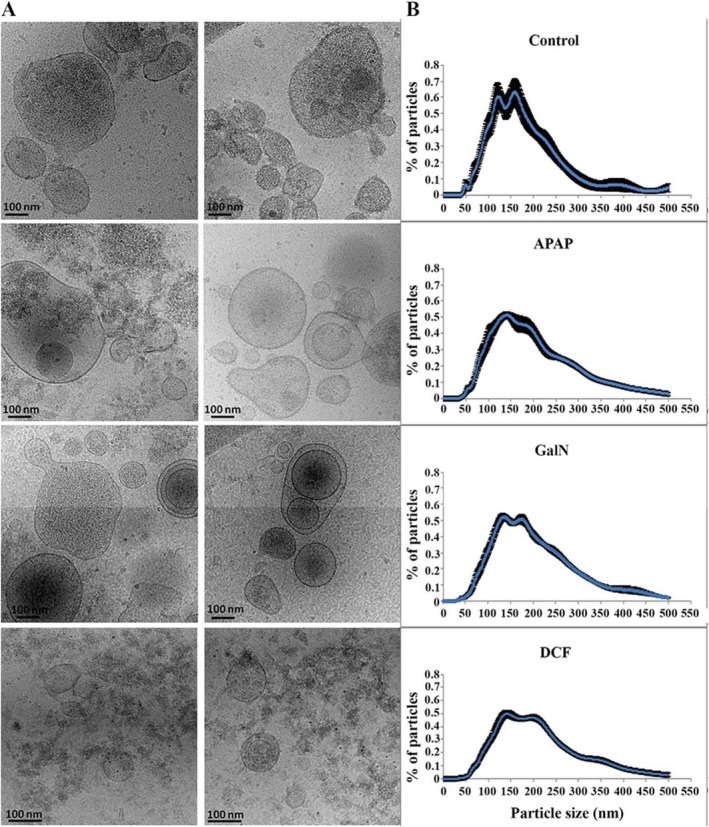
Effects on morphology and size distribution of EVs secreted by hepatocytes exposed to the drugs. Representative cryo‐electron micrographs (A) and size distribution (B) determined by NTA of EV preparations secreted by hepatocytes challenged by the indicated compounds. Bar: 100 nm. Size distribution shows the analysis of 10 biological replicates (n = 10) for each condition.
Proteomics Analysis
The proteins listed in Supporting Table S1 include those whose abundance have changed significantly between EVs derived from treated and untreated hepatocytes. Interestingly, there is a central core of 22 proteins that changes in the same direction for all of the treatments (Fig. 4). To interpret those changes, we add to that list those proteins that are significantly regulated in at least two treatments and maintain the same direction for all three treatments (Fig. 5). EV‐regulated proteins revealed a decrease in the levels of proteins that control cytoskeleton and the interaction with the extracellular matrix, including fibronectin, fibrinogens, integrin 1b and integrin‐linked kinase, Cd81, angiopoietin‐like 4, and Ras‐related protein Rap1a (Fig. 5 and Supporting Table S1). These proteins have been involved in the apoptosis survival response of cells under stressful conditions. An increase in the translational machinery and stress‐related chaperones, including Hsp90 and Hpsa5, was also observed (Fig. 5 and Supporting Table S1).
Figure 4.
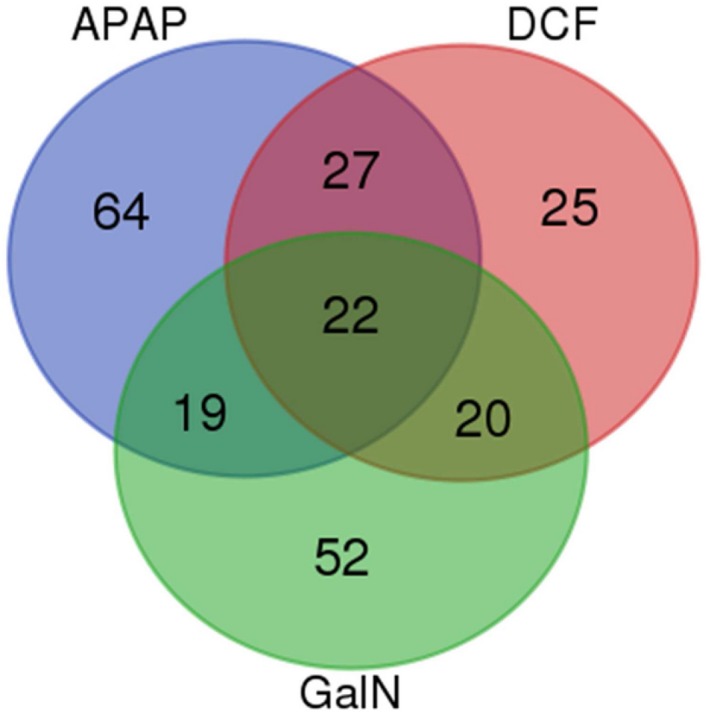
Venn diagram of EV proteomics analysis. Comparison of the proteins regulated for each treatment with respect to the proteomics analysis of EVs obtained from untreated hepatocytes.
Figure 5.
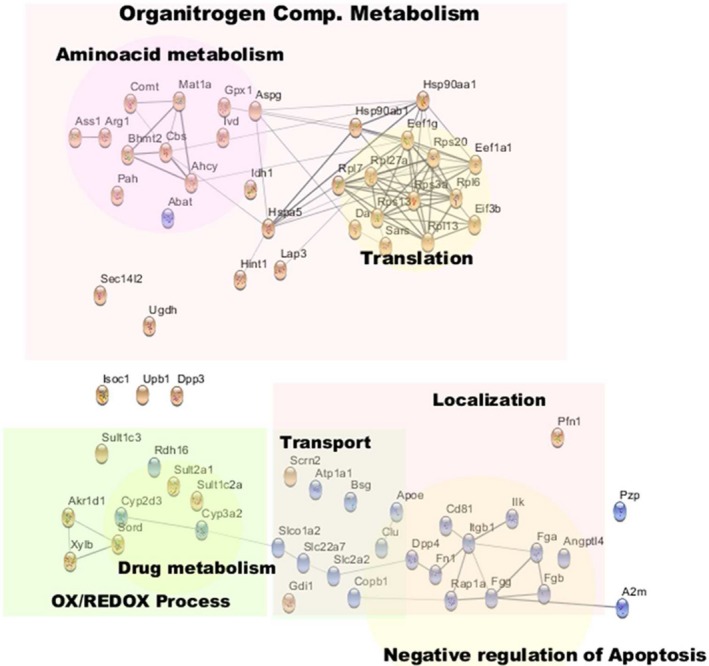
Annotated network of common molecules regulated by hepatotoxic treatments. The network included all of those molecules found significantly regulated for all three treatments, plus those molecules found to be significantly regulated in two treatments and regulated with the same trend for the other treatment. Red and blue colors denote, respectively, an increase or decrease in the amount of each protein in EVs secreted by drug‐treated hepatocytes, in comparison to untreated cells. Abbreviations: Ahcy, S‐adenosylhomocysteine hydrolase; Angptl4, angiopoietin‐like 4; Asgp, L‐asparaginase; Ass1, argininosuccinate synthase 1; Bhmt2, betaine‐homocysteine S‐methyltransferase 2; Bsg, basigin; Cbs, cystathionine‐beta‐synthase; Copb1, beta‐subunit of coatomer; Fga, Fgb, Fgg, fibrinogens; Fn1, fibronectin; Itgb1, integrin 1b; Ilk, integrin‐linked kinase; Mat1a, S‐adenosyl‐methyl transferase; Rap1a, Ras‐related protein.
We also observed a common response ejected by stressed hepatocytes on the metabolism of different amino acids that regulate several biological processes. One of these altered metabolisms is the methionine cycle, which is the main system to generate methyl donors, and consequently, a major modulator of protein methylation and epigenetic. Thus, we observed an increase in many enzymes of this route, including betaine‐homocysteine S‐methyltransferase 2, S‐adenosyl‐methyl transferase, S‐adenosylhomocysteine hydrolase, and cystathionine‐beta‐synthase (Fig. 5 and Supporting Table S1). In addition, alteration of the metabolism of arginine was also observed, as judged by the increased levels of the enzymes argininosuccinate synthase 1 and arginase 1 (Arg1) (Fig. 5 and Supporting Table S1), previously shown to be active in EVs and associated with endothelial regulation.23 Asparagine and aspartate metabolism involved cellular proliferation24 was also affected by all treatments, as suggested by the increased levels of L‐asparaginase (also known as 60 kDa lysophospholipase, LPP60) (Fig. 5 and Supporting Table S1) responsible for the conversion of asparagine to aspartate. In addition, a common feature to all treatments related to amino acid metabolism was the increased level of the enzyme catecholamine methyl transferase (Comt) (Fig. 5 and Supporting Table S1), which is involved in the metabolization of tyrosine‐derived stress hormones (e.g., epinephrine) and shown to be active in EVs.25
Another common feature detected by our proteomics analysis was a decrease in the EV levels of some transporters (i.e., Atp1a, Slc2a2, Slc22a7, and Slco1a2) and their intracellular regulators (basigin and beta‐subunit of coatomer) (Fig. 5 and Supporting Table S1) involved in the regulation of glucose, prostaglandin, and bile acid metabolisms.
Finally, several enzymes involved in endogenous and xenobiotic metabolism were downregulated (e.g., cytochromes Cyp3a2 and Cyp2d3) or upregulated (e.g., sulfotransferases Sult2a1, Sult1c2a, and Sult1c3) (Fig. 5 and Supporting Table S1) independently of the treatment.
Afterward, to identify some specific response of hepatocytes against the different treatments, we focused on the molecules that differ among treatments (Fig. 6). We observed an increase in proteins related to translation in the three treatments, although each of them affected a different set of involved molecules, providing specificity to the response. A similar situation was observed for the proteins related to drug response. DCF and GalN caused an increase in CYP‐related molecules, whereas APAP caused an increase in the EV levels of glutathione transferases. Unlike the other treatments, in the case of GalN, the changes observed with respect to control were due to the abundance of almost all proteins (only three were underrepresented among the 62 proteins) (Fig. 6). If we also consider that these proteins are associated with peroxisomes, endoplasmic reticulum, nucleus, and mitochondria, these result suggest that preparations of EV produced from GalN‐treated hepatocytes contain more vesicles associated with apoptotic processes.
Figure 6.
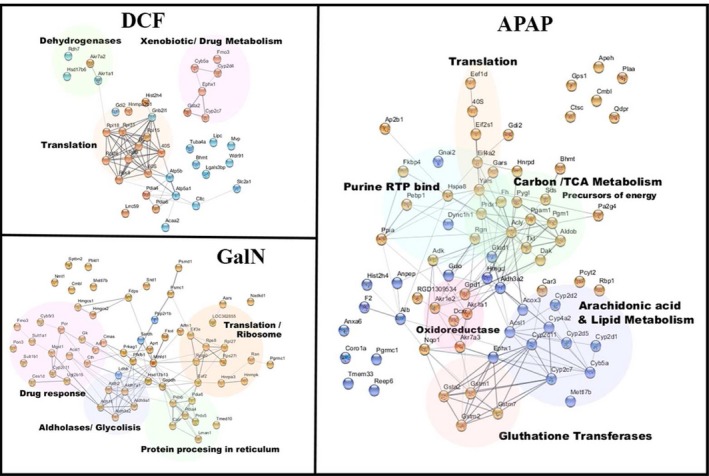
Annotated network of regulated molecules specific for each treatment. The network included for each treatment, all those molecules found to be significant only for that treatment, those molecules found to be significantly regulated in just another treatment, and the direction of regulation are not congruent among the three treatments.
Together, all of these alterations observed in EVs suggest the existence of a common, although differently tuned, stress response of the hepatocytes to the different hepatotoxic conditions. This response is aimed at controlling apoptosis, proliferation, protein translation, methylation, and metabolism of different nutrients, hormones, and signaling molecules.
Proteomic Validation and EV Characterization by Western Blot
We performed a western blot analysis, loading similar protein amounts of cell extracts and EVs, and focused on the detection of several proteins previously associated with EVs, including Cd63, Limp II, Flot1, Hsp70, Hsp90, Rab8, Ces1d, Comt, and Cyp2d1. We observed a positive agreement between the proteomics data and the western blotting (Fig. 7). For instance, Hsp90 and Comt were increased by all treatments, Ces1d primarily in GalN and DCF, and Cyp2d1 increased in GalN and decreased in APAP. Interestingly, EV markers Cd63, LimpII, and Flot1 suffered a decrease in addition to the decrease of Cd81 observed in the proteomics analysis. Regarding the cellular levels, the amount of Cd63, Limp II, and Hsp70 decreased in all treatments. The intracellular levels of Ces1d increased in the GalN and DCF treatments, and the levels of Flot‐1 and Comt increased only in the GalN‐treated hepatocytes (Fig. 7). Importantly, APAP treatment caused a drastic reduction in the cellular levels of most of the assayed proteins, suggesting that under these conditions, this drug provokes the most severe effects. Interestingly, the only protein that increased in the hepatocytes exposed to APAP was the mitochondria marker Cox4 (Fig. 7), in agreement with the proposed mechanism of APAP toxicity that implies mitochondria dysfunction.18
Figure 7.

Effect on protein content of EVs secreted by exposed hepatocytes. Representative western‐blot analysis of primary rat hepatocyte exposure to the drugs and their corresponding secreted EVs. Protein extracts (10 ug) were analyzed by western blotting using antibodies against the indicated proteins. Molecular weights are indicated in kDa.
EVs Harbor Active Cyp2d1
We wanted to confirm that cytochromes were present in EVs, taking advantage of one of the hallmarks of EVs, as vesicular carriers is their flotation in sucrose‐density gradients. We performed a sucrose‐density gradient (Fig. 8), and as can be observed, the exosomal protein markers (e.g., Aip1/Alix, Cd63, and Cd81) were enriched in vesicles floating at a density of approximately 1.21 g/mL. Remarkably, Cyp2d1 was highly enriched in the same fraction, strongly suggesting that this enzyme was associated with extracellular vesicles. We have demonstrated in hepatocyte‐secreted EVs the presence of not only the protein but also the activity for the Arg1, Ces1d, and Comt enzymes.11, 23, 25 Here, we addressed the question of whether the Cyp2d1 enzyme, detected in EVs, is active. For this purpose, we used a commercial enzymatic assay that is available for CYP2D6, the human orthologous of the rat Cyp2d1. We were able to detect the activity in EVs from untreated and treated hepatocytes (Fig. 9), and the activity correlated with the protein abundance observed by western blotting, which was significantly higher in EVs from GalN‐treated hepatocytes (Fig. 7).
Figure 8.
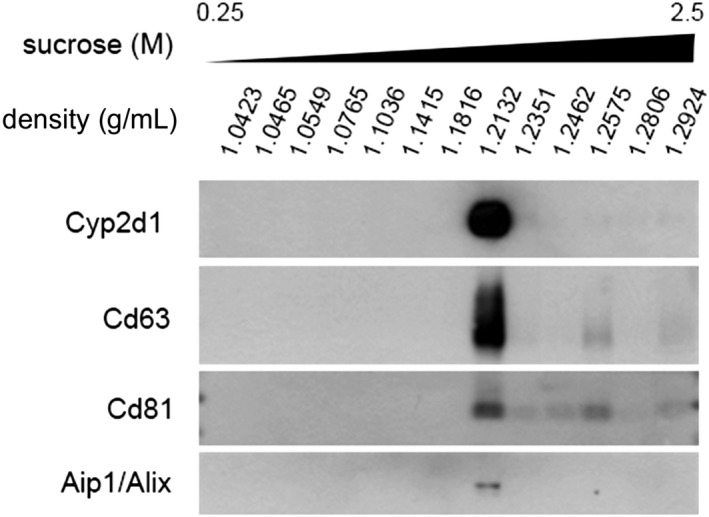
Sucrose‐density analysis of EVs secreted by hepatocytes. Based on their density, EVs were separated by ultracentrifugation in a density gradient of sucrose. Afterward, the fractions were analyzed by western blotting using antibodies against the indicated proteins.
Figure 9.
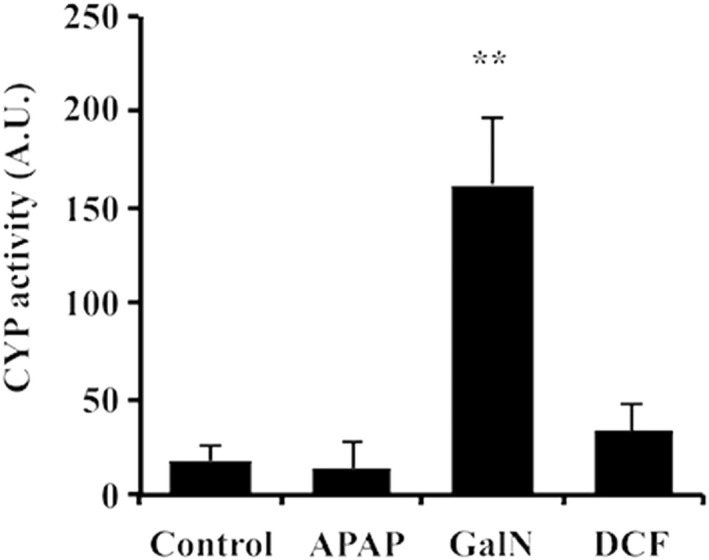
Cytochrome P450 2d1 activity associated with hepatocyte‐derived EVs exposed to the drugs. The activity of P450 2d1 was measured using a commercial fluorometric assay available for the CYP P450 2D6 (the human orthologous of the rat CYP P450 2d1). The activity expressed as an arbitrary unit was corrected by protein concentration. Error bars represent the standard error of three independent biological replicates (n = 3). **P< 0.01.
Circulating CYP Activity Increases After Liver Damage
Finally, we wanted to evaluate whether these in vitro findings are reflected in vivo by analyzing the presence of this activity in the serum of rats treated with APAP, LPS/DCF, or GalN. We used eight male rats for each treatment, and after the administration of the compounds, blood samples were drawn for determining transaminase GOT and Cyp2d1 activities (Fig. 10). Interestingly, there was already a detectable level of CYP activity in 5 µL of serum from mock‐treated rats (Fig. 10B), suggesting that under healthy conditions, a detectable amount of this enzyme is in circulation. In agreement with the results of EV characterization, animals treated with GalN showed 100 times more activity in serum than the rats receiving other treatments or the mock. All treatments showed higher serum levels of Cyp2d1 activity than the mock group and followed a similar trend as the serum levels of GOT transaminase (Fig. 10A), strongly indicating that serum Cyp2d1 activity could indicate liver damage, offering higher specificity than transaminase alone.
Figure 10.
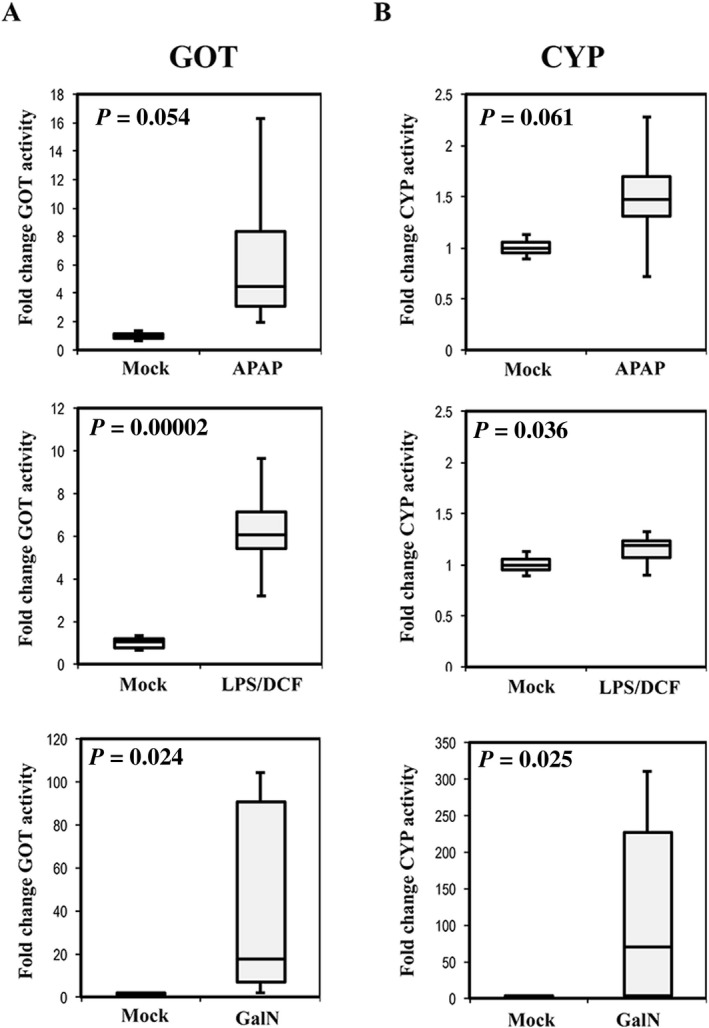
Serum levels of GOT and CYP activities in rats treated with different hepatotoxic compounds. Box plots of the transaminase GOT (A) and CYP P450 2d1 (B) activities were determined in serum of mock‐treated rats or those treated with APAP, LPS/DCF, or GalN. Activities were referred to the average activity obtained in mock group. Each experimental group was formed by eight animals (n = 8). P values of t test analysis are indicated.
We further investigated whether the Cyp2d1 activity detected in serum was associated with vesicles by performing SEC on 200 µL of serum from rats treated with vehicle, APAP, or GalN (Fig. 11). In agreement with the direct serum measurements of Cyp2d1, we detected activity in serum from control rats that was higher in APAP‐treated rats and much higher in GalN‐treated rats (Fig. 11A). In all cases, most of the activity was in the first three fractions of the SEC (Fig. 11A), supporting that serum Cyp2d1 activity is associated with vesicular material.26, 27 Then, we concentrated each fraction to perform western blot analysis of Cyp2d1, Cd63 (as EV marker), and albumin (as soluble protein) (Fig. 11B). Although we could not detect Cd63 in control samples, we could detect it in the first fractions of the APAP and GalN samples. Albumin was clearly detected in control and, at least to some extent, in the APAP and GalN samples (Fig. 11B) and was mostly associated with the late fractions. Finally, we could only detect the protein Cyp2d1 in the GalN samples, and it was mostly associated with the early fractions, in agreement with the profile obtained for the activity (Fig. 11A). Thus, western blotting indicates that soluble proteins are associated with late eluting fractions in the SEC and confirms the presence of the EV marker in the first fractions in which we detected Cyp2d1 protein and activity. However, it could also be appreciated that the distribution of Cd63 does not match perfectly with Cyp2d1 activity in APAP samples, or activity and protein in GalN samples, suggesting that Cyp2d1‐carrying vesicles have a low abundance of this tetraspanin.
Figure 11.
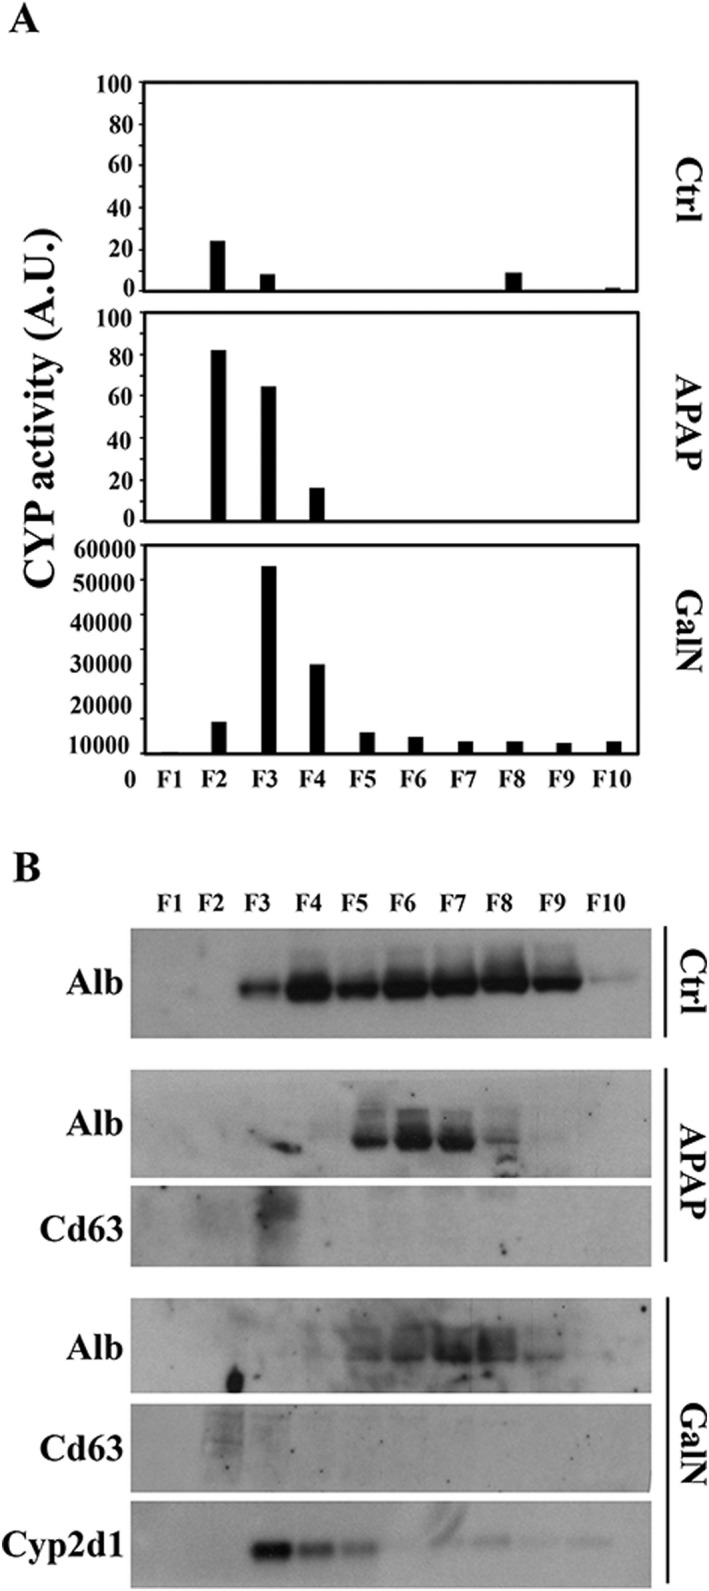
SEC analysis of rat serum samples. (A) CYP P450 2d1 activity was determined in each fraction of the SEC performed with 200 µL of serum from rats treated with the indicated compounds. (B) Western blot analysis of albumin (Alb), Cd63, and Cyp2d1 proteins was performed by loading the same volume of each fraction after concentration.
Discussion
The study of EVs as mediators of different biological processes and disease biomarkers has evolved rapidly in the last years. We have previously characterized small EVs secreted by hepatocytes exposed to GalN, a compound that causes acute liver injury. In the present work, we extended the study to the characterization of EVs secreted by hepatocytes exposed to APAP and DCF, two pharmaceutical compounds known to cause DILI. Our results show that all of these compounds modified the number, size distribution, and composition of the secreted EVs. A previous study did not report changes in the number of secreted EVs,28 but it is important to highlight the differences in their timing (i.e., they collected the medium after 24 hours versus our 36‐hour incubation) and the differences in the isolation technique (the referred study used Exoquick). Our proteomic analysis showed a group of common proteins that are regulated in the same direction for all treatments. There is an increase in the number of molecules related to transcription, and part of the nitrogen carbon metabolic machinery, whereas a decrease in molecules regulates apoptosis and proliferation. This is in agreement with the observation that EVs derived from untreated hepatocytes had a positive effect on proliferation and survival,29 whereas hepatocytes treated with toxins increase immune‐mediated responses in DILI,28 perhaps mediated by the presence of apoptotic bodies and massive export of liver proteins. Other important phenomena are the secretion of active enzymes, including Arg123 and Comt,25 which suggests that circulating EVs after liver damage will have an effect on the surrounding environment and therefore be part of the pathogenesis of DILI.
We also observed key differences among treatments. GalN promotes an increase in most regulated proteins. There are some upregulated CYPs, as well as molecules of intracellular organelles, that indicate that the contribution of apoptosis to the EVs could be more important, and this is in agreement with the involvement of caspase 3 in GalN toxicity.30 However, APAP toxicity is activated by the action of CYPs,31 which generate a reactive metabolite responsible for oxidative stress, leading to mitochondrial misfunction, depletion of ATP, activation of the stress kinase c‐Jun N‐terminal, and permeability of the membranes leading to necrosis.32 We observed a decrease in cytochromes and an increase in glutathione‐transferase enzymes in APAP‐induced EVs. Although cytochromes are part of the activation of APAP in a reactive adduct, glutathione will be used in the conjugation of the toxic metabolite.33 Therefore, the changes in the EVs that are induced by APAP treatment reflect the processes that the cell undergoes for drug neutralization, and we could expect an effect of those EVs loaded with active metabolic tools when delivering their cargo inside the recipient cells. DCF is the treatment that induces fewer changes, which could be in agreement with the fact that the toxicity of this anti‐inflammatory drug also requires the concourse of the immune system,34 which is absent in our in vitro model. However, the potential toxicity of some of the drug's adducts has also been described,35 and consequently, we have observed changes in the EVs that suggest cellular damage, particularly the presence of CYPs presumably involved in the metabolism of the drug,36 and more importantly, the presence of proteins related to the mechanism of translation as well as ribosomal proteins, whose presence in EVs suggests an increase in apoptotic bodies.37
Remarkably, we found that the hepatotoxic conditions affected a number of chaperones, including Hsp70 and Hsp90, which were increased in hepatic EVs secreted in APAP, GalN, and DCF treatments; such secretion was accompanied by an intracellular decrease in most of these proteins. This suggests a selective transport of them outside the cell under acute liver injury and probably a reduction in the synthesis in the case of APAP. Given that there is an increase in the total protein cargo secreted under the treatments (Fig. 2B), Hsp70 and Hsp90 might be secreted in a major extent to preserve the folding of this extra protein cargo, and in the case of Hsp90, its presence in EVs has been shown to play a key role in alcoholic liver diseases.38 In contrast, the expression of Rab8 protein behaves in a similar way to Hsp70/Hsp90; we observed an increased level in the secretion of Rab8. This small GTPase is involved in vesicular trafficking,39 suggesting that the cellular response to APAP, GalN, and DCF implicates changes in the vesicular trafficking system mediated by Rab8. This effect of the drugs on the intracellular trafficking is also supported by the alteration of the levels of Limp II, which plays a role in the endo‐lysosomal trafficking,40, 41 and of the tetraspanin Cd63, an endosomal marker implicated in EV biogenesis and immune response.42, 43 For both proteins, we observed a reduction in their intracellular levels, as well as in EVs. Moreover, Flot1 and Cd81 also decrease in EVs secreted by drug‐treated hepatocytes. All of these data reinforce the hypothesis that APAP, DCF, and GalN provoke changes in the intracellular trafficking, and consequently, in EV secretion and composition.
Importantly, the different compounds acted differentially to the abundance of EVs of different xenobiotic‐related enzymes, including Ces1d and Comt. We have shown that these enzymes are active in EVs.11, 25 Here, we demonstrated that another xenobiotic‐related activity, Cyp2d1, is also active in hepatocyte‐secreted EVs and, as occurs with the previous enzymes, pharmaceutical compounds altered its abundance in EVs. In this sense, GalN, APAP, and DCF affected CYPs in different ways. GalN hepatotoxicity was analyzed in a study in which rat hepatocytes were treated with this compound, resulting in a significant increase in the specific activity of CYPs.44 In the case of APAP, CYPs mediate its activation to toxic metabolites, inducing hepatotoxicity. Indeed, a strong relationship between the activity of CYPs and the severity of APAP‐induced cirrhosis has been demonstrated.45 The decrease in certain CYPs after APAP treatment has been observed, mediated by miRNAs,46 and we certainly observed the reduction of several CYPs in the APAP‐treated hepatocyte‐derived EVs. Finally, CYPs are also involved in the bioactivation of DCF to its reactive metabolites.47 Overall, the presence in EVs of Ces1d, Comt, and Cyp2d1 activities suggests a possible contribution of hepatocyte‐secreted vesicles to the extracellular metabolism of different drugs. For example, CPT‐11, a drug currently used for the treatment of different types of cancers, such as colon or rectum, is converted by Ces1d to its active metabolite.48 Comt enzyme metabolizes cathecholamines, such as dopamine or norepinephrine neurotransmitters, which are used as antidepressants or in the treatment of Parkinson's disease, among others.49, 50 In the case of Cyp2d1, it is involved in the oxidation of about 25% of clinically relevant drugs, including the morphine precursor codeine.51, 52 Overall, all of these enzymatic activities play an important role in well‐known drugs' metabolisms; therefore, their presence in circulating EVs should be taken into consideration in further studies to avoid undesired adverse drug reactions.
At this time, most of the existing techniques analyze EVs as a whole, and consequently, it is difficult to establish the identity of the EVs that carry Cyp2d1. According to the sucrose density gradient analysis (Fig. 8), Cyp2d1 is associated with vesicles that contain CD63 or co‐fraction with CD63‐positive EVs. However, under hepatotoxic conditions (Figs. 2 and 11), it appears that Cyp2d1 is associated with EVs that contain no or a low amount of CD63, suggesting that vesicular location of Cyp2d1 is sensitive to drug toxicity. Further experiments are needed to clearly establish the identity of Cyp2d1‐loaded EVs.
Our work clearly supports the study of EVs under controlled conditions being a suitable approach to identifying low‐invasive candidate markers for liver affections including DILI. Our data show a pattern similar to that reported by Cho et al.,53 who concluded that APAP‐induced liver injury increases the abundance of liver‐specific proteins in EVs. Here, we also showed that not only APAP but also DCF change differentially the content of the EVs with specific molecules that could serve to differentiate the etiology of liver injury. Finally, we demonstrated that Cyp2d1 activity is present in hepatocyte‐secreted EVs as well as in rat serum after treatment with APAP and DCF. It is important to clarify that the decrease observed in CYP activity in EVs derived of hepatocytes treated with APAP is a decrease versus untreated hepatocytes, which in any case reflects the status of the serum of untreated rats. EVs from untreated hepatocytes reflect the hepatocyte disaggregation and could also be considered a model of liver damage. Therefore, it is not surprising that, in vivo, rats treated with APAP display still higher amounts of CYP activity than untreated rats. This hepatocyte‐specific enzyme could constitute a novel candidate marker to specifically detect and follow DILI.
Potential conflicts of interest
Nothing to report.
Supporting information
Additional Supporting Information may be found at onlinelibrary.wiley.com/doi/10.1002/hep4.1210/full.
Acknowledgments
We thank David Gil (Electron Microscopy platform, CIC bioGUNE) for his technical support in the electron microscopy analysis and Agustín Berisa for his technical assistance in the animal experimentation. We thank Spanish Ministry of Economy and Competitiveness, MINECO (SAF2015‐66312) and the SEV‐2016‐0644 Severo Ochoa Excellence Accreditation. Both, co‐funded with FEDER funds. Author contributions:L.P., J.E.M., E.G., J.C‐V., M.A., F.E., and F.R. performed the experiments. L.P., F.R., and J.M.F‐P. designed the study and wrote the manuscript.
View this article online at wileyonlinelibrary.com
Supported by Ramûn Areces Foundation (Grant/Award Number: XVII‐Call), Instituto de Salud Carlos III (Grant/Award Number: PI12/01604), Secretarìa de Estado de Investigaciûn, Desarrollo e Innovaciûn (Grant/Award Number: Rediex), Health Basque Government (Grant/Award Number: 2015111149), and Movember Foundation (Grant/Award Number: GAP1).
Contributor Information
Félix Royo, Email: froyo.ciberehd@cicbiogune.es.
Juan M. Falcon‐Perez, Email: jfalcon@cicbiogune.es
References
- 1. Sturgill MG, Lambert GH. Xenobiotic‐induced hepatotoxicity: mechanisms of liver injury and methods of monitoring hepatic function. Clin Chem 1997;43:1512‐1526. [PubMed] [Google Scholar]
- 2. Ostapowicz G, Fontana RJ, Schiodt FV, Larson A, Davern TJ, Han SH, et al. Results of a prospective study of acute liver failure at 17 tertiary care centers in the United States. Ann Intern Med 2002;137:947‐954. [DOI] [PubMed] [Google Scholar]
- 3. Larrey D. Drug‐induced liver diseases. J Hepatol 2000;32:77‐88. [DOI] [PubMed] [Google Scholar]
- 4. Gunawan B, Kaplowitz N. Clinical perspectives on xenobiotic‐induced hepatotoxicity. Drug Metab Rev 2004;36:301‐312. [DOI] [PubMed] [Google Scholar]
- 5. Holt MP, Ju C. Mechanisms of drug‐induced liver injury. AAPS J 2006;8:E48‐E54. [DOI] [PMC free article] [PubMed] [Google Scholar]
- 6. Giordano C, Rivas J, Zervos X. An update on treatment of drug‐induced liver injury. J Clin Transl Hepatol 2014;2:74‐79. [DOI] [PMC free article] [PubMed] [Google Scholar]
- 7. Wijnen PA, Op den Buijsch RA, Drent M, Kuijpers PM, Neef C, Bast A, et al. Review article: the prevalence and clinical relevance of cytochrome P450 polymorphisms. Aliment Pharmacol Ther 2007;26Suppl 2:211‐219. [DOI] [PubMed] [Google Scholar]
- 8. Frye RF, Zgheib NK, Matzke GR, Chaves‐Gnecco D, Rabinovitz M, Shaikh OS, et al. Liver disease selectively modulates cytochrome P450–mediated metabolism. Clin Pharmacol Ther 2006;80:235‐245. [DOI] [PubMed] [Google Scholar]
- 9. Zanger UM, Schwab M. Cytochrome P450 enzymes in drug metabolism: regulation of gene expression, enzyme activities, and impact of genetic variation. Pharmacol Ther 2013;138:103‐141. [DOI] [PubMed] [Google Scholar]
- 10. Conde‐Vancells J, Rodriguez‐Suarez E, Embade N, Gil D, Matthiesen R, Valle M, et al. Characterization and comprehensive proteome profiling of exosomes secreted by hepatocytes. J Proteome Res 2008;7:5157‐5166. [DOI] [PMC free article] [PubMed] [Google Scholar]
- 11. Rodriguez‐Suarez E, Gonzalez E, Hughes C, Conde‐Vancells J, Rudella A, Royo F, et al. Quantitative proteomic analysis of hepatocyte‐secreted extracellular vesicles reveals candidate markers for liver toxicity. J Proteomics 2014;103:227‐240. [DOI] [PMC free article] [PubMed] [Google Scholar]
- 12. Reynolds KK, McNally BA, Linder MW. Clinical utility and economic impact of CYP2D6 genotyping. Clin Lab Med 2016;36:525‐542. [DOI] [PubMed] [Google Scholar]
- 13. Zhou SF, Liu JP, Lai XS. Substrate specificity, inhibitors and regulation of human cytochrome P450 2D6 and implications in drug development. Curr Med Chem 2009;16:2661‐2805. [DOI] [PubMed] [Google Scholar]
- 14. Hoofnagle JH, Serrano J, Knoben JE, Navarro VJ. LiverTox: a website on drug‐induced liver injury. Hepatology 2013;57:873‐874. [DOI] [PMC free article] [PubMed] [Google Scholar]
- 15. Toghill PJ, Williams R, Stephens JD, Carroll JD. Acute hepatic necrosis following an overdose of paracetamol. Gastroenterology 1969;56:773‐776. [PubMed] [Google Scholar]
- 16. Iveson TJ, Ryley NG, Kelly PM, Trowell JM, McGee JO, Chapman RW. Diclofenac associated hepatitis. J Hepatol 1990;10:85‐89. [DOI] [PubMed] [Google Scholar]
- 17. Lynch T, Price A. The effect of cytochrome P450 metabolism on drug response, interactions, and adverse effects. Am Fam Physician 2007;76:391‐396. [PubMed] [Google Scholar]
- 18. Burcham PC, Harman AW. Acetaminophen toxicity results in site‐specific mitochondrial damage in isolated mouse hepatocytes. J Biol Chem 1991;266:5049‐5054. [PubMed] [Google Scholar]
- 19. Thery C, Regnault A, Garin J, Wolfers J, Zitvogel L, Ricciardi‐Castagnoli P, et al. Molecular characterization of dendritic cell‐derived exosomes: Selective accumulation of the heat shock protein hsc73. J Cell Biol 1999;147:599‐610. [DOI] [PMC free article] [PubMed] [Google Scholar]
- 20. Dragovic RA, Gardiner C, Brooks AS, Tannetta DS, Ferguson DJ, Hole P, et al. Sizing and phenotyping of cellular vesicles using nanoparticle tracking analysis. Nanomedicine 2011;7:780‐788. [DOI] [PMC free article] [PubMed] [Google Scholar]
- 21. Wisniewski JR, Zougman A, Nagaraj N, Mann M. Universal sample preparation method for proteome analysis. Nat Methods 2009;6:359‐362. [DOI] [PubMed] [Google Scholar]
- 22. Yeung YG, Stanley ER. Rapid detergent removal from peptide samples with ethyl acetate for mass spectrometry analysis. Curr Protoc Protein Sci 2010;16:12. [DOI] [PMC free article] [PubMed] [Google Scholar]
- 23. Royo F, Moreno L, Mleczko J, Palomo L, Gonzalez E, Cabrera D, et al. Hepatocyte‐secreted extracellular vesicles modify blood metabolome and endothelial function by an arginase‐dependent mechanism. Sci Rep 2017;7:42798. [DOI] [PMC free article] [PubMed] [Google Scholar]
- 24. Krall AS, Xu S, Graeber TG, Braas D, Christofk HR. Asparagine promotes cancer cell proliferation through use as an amino acid exchange factor. Nat Commun 2016;7:11457. [DOI] [PMC free article] [PubMed] [Google Scholar]
- 25. Casal E, Palomo L, Cabrera D, Falcon‐Perez JM. A novel sensitive method to measure catechol‐o‐methyltransferase activity unravels the presence of this activity in extracellular vesicles released by rat hepatocytes. Front Pharmacol 2016;7:501. [DOI] [PMC free article] [PubMed] [Google Scholar]
- 26. Boing AN, van der Pol E, Grootemaat AE, Coumans FA, Sturk A, Nieuwland R. Single‐step isolation of extracellular vesicles by size‐exclusion chromatography. J Extracell Vesicles 2014;3. [DOI] [PMC free article] [PubMed] [Google Scholar]
- 27. Welton JL, Brennan P, Gurney M, Webber JP, Spary LK, Carton DG, et al. Proteomics analysis of vesicles isolated from plasma and urine of prostate cancer patients using a multiplex, aptamer‐based protein array. J Extracell Vesicles 2016;5:31209. [DOI] [PMC free article] [PubMed] [Google Scholar]
- 28. Holman NS, Mosedale M, Wolf KK, LeCluyse EL, Watkins PB. Subtoxic alterations in hepatocyte‐derived exosomes: an early step in drug‐induced liver injury? Toxicol Sci 2016;151:365‐375. [DOI] [PMC free article] [PubMed] [Google Scholar]
- 29. Nojima H, Freeman CM, Schuster RM, Japtok L, Kleuser B, Edwards MJ, et al. Hepatocyte exosomes mediate liver repair and regeneration via sphingosine‐1‐phosphate. J Hepatol 2016;64:60‐68. [DOI] [PMC free article] [PubMed] [Google Scholar]
- 30. Siendones E, Jimenez‐Gomez Y, Montero JL, Gomez‐Diaz C, Villalba JM, Muntane J. PGE1 abolishes the mitochondrial‐independent cell death pathway induced by D‐galactosamine in primary culture of rat hepatocytes. J Gastroenterol Hepatol 2005;20:108‐116. [DOI] [PubMed] [Google Scholar]
- 31. Dahlin DC, Miwa GT, Lu AY, Nelson SD. N‐acetyl‐p‐benzoquinone imine: a cytochrome P‐450‐mediated oxidation product of acetaminophen. Proc Natl Acad Sci U S A 1984;81:1327‐1331. [DOI] [PMC free article] [PubMed] [Google Scholar]
- 32. Barbier‐Torres L, Iruzubieta P, Fernandez‐Ramos D, Delgado TC, Taibo D, Guitierrez‐de‐Juan V, et al. The mitochondrial negative regulator MCJ is a therapeutic target for acetaminophen‐induced liver injury. Nat Commun 2017;8:2068. [DOI] [PMC free article] [PubMed] [Google Scholar]
- 33. Johnson BP, Walisser JA, Liu Y, Shen AL, McDearmon EL, Moran SM, et al. Hepatocyte circadian clock controls acetaminophen bioactivation through NADPH‐cytochrome P450 oxidoreductase. Proc Natl Acad Sci U S A 2014;111:18757‐18762. [DOI] [PMC free article] [PubMed] [Google Scholar]
- 34. Yano A, Higuchi S, Tsuneyama K, Fukami T, Nakajima M, Yokoi T. Involvement of immune‐related factors in diclofenac‐induced acute liver injury in mice. Toxicology 2012;293:107‐114. [DOI] [PubMed] [Google Scholar]
- 35. Kawase A, Hashimoto R, Shibata M, Shimada H, Iwaki M. Involvement of reactive metabolites of diclofenac in cytotoxicity in sandwich‐cultured rat hepatocytes. Int J Toxicol 2017;36:260‐267. [DOI] [PubMed] [Google Scholar]
- 36. den Braver MW, den Braver‐Sewradj SP, Vermeulen NP, Commandeur JN. Characterization of cytochrome P450 isoforms involved in sequential two‐step bioactivation of diclofenac to reactive p‐benzoquinone imines. Toxicol Lett 2016;253:46‐54. [DOI] [PubMed] [Google Scholar]
- 37. Crescitelli R, Lasser C, Szabo TG, Kittel A, Eldh M, Dianzani I, et al. Distinct RNA profiles in subpopulations of extracellular vesicles: apoptotic bodies, microvesicles and exosomes. J Extracell Vesicles 2013;2. [DOI] [PMC free article] [PubMed] [Google Scholar]
- 38. Saha B, Momen‐Heravi F, Furi I, Kodys K, Catalano D, Gangopadhyay A, et al. Extracellular vesicles from mice with alcoholic liver disease carry a distinct protein cargo and induce macrophage activation through heat shock protein 90. Hepatology 2018;67:1986‐2000. [DOI] [PMC free article] [PubMed] [Google Scholar]
- 39. Huber LA, Pimplikar S, Parton RG, Virta H, Zerial M, Simons K. Rab8, a small GTPase involved in vesicular traffic between the TGN and the basolateral plasma membrane. J Cell Biol 1993;123:35‐45. [DOI] [PMC free article] [PubMed] [Google Scholar]
- 40. Coutinho MF, Prata MJ, Alves S. A shortcut to the lysosome: the mannose‐6‐phosphate‐independent pathway. Mol Genet Metab 2012;107:257‐266. [DOI] [PubMed] [Google Scholar]
- 41. Gonzalez A, Valeiras M, Sidransky E, Tayebi N. Lysosomal integral membrane protein‐2: a new player in lysosome‐related pathology. Mol Genet Metab 2014;111:84‐91. [DOI] [PMC free article] [PubMed] [Google Scholar]
- 42. Andreu Z, Yanez‐Mo M. Tetraspanins in extracellular vesicle formation and function. Front Immunol 2014;5:442. [DOI] [PMC free article] [PubMed] [Google Scholar]
- 43. Petersen SH, Odintsova E, Haigh TA, Rickinson AB, Taylor GS, Berditchevski F. The role of tetraspanin CD63 in antigen presentation via MHC class II. Eur J Immunol 2011;41:2556‐2561. [DOI] [PubMed] [Google Scholar]
- 44. Toussaint MJ, De Wit MM, Blaauboer BJ, Nederbragt H. Phenobarbital pretreatment in vivo and in vitro and the effect of hepatotoxicity of d‐galactosamine in rat hepatocytes in culture. Toxicol In Vitro 1994;8:1129‐1137. [DOI] [PubMed] [Google Scholar]
- 45. Villeneuve JP, Pichette V. Cytochrome P450 and liver diseases. Curr Drug Metab 2004;5:273‐282. [DOI] [PubMed] [Google Scholar]
- 46. Gill P, Bhattacharyya S, McCullough S, Letzig L, Mishra PJ, Luo C, et al. MicroRNA regulation of CYP 1A2, CYP3A4 and CYP2E1 expression in acetaminophen toxicity. Sci Rep 2017;7:12331. [DOI] [PMC free article] [PubMed] [Google Scholar]
- 47. Tang W, Stearns RA, Bandiera SM, Zhang Y, Raab C, Braun MP, et al. Studies on cytochrome P‐450‐mediated bioactivation of diclofenac in rats and in human hepatocytes: identification of glutathione conjugated metabolites. Drug Metab Dispos 1999;27:365‐372. [PubMed] [Google Scholar]
- 48. Potmesil M. Camptothecins: from bench research to hospital wards. Cancer Res 1994;54:1431‐1439. [PubMed] [Google Scholar]
- 49. El Mansari M, Guiard BP, Chernoloz O, Ghanbari R, Katz N, Blier P. Relevance of norepinephrine‐dopamine interactions in the treatment of major depressive disorder. CNS Neurosci Ther 2010;16:e1‐e17. [DOI] [PMC free article] [PubMed] [Google Scholar]
- 50. Orth M, Schapira AH. Mitochondrial involvement in Parkinson's disease. Neurochem Int 2002;40:533‐541. [DOI] [PubMed] [Google Scholar]
- 51. Evans WE, Relling MV. Pharmacogenomics: translating functional genomics into rational therapeutics. Science 1999;286:487‐491. [DOI] [PubMed] [Google Scholar]
- 52. Guengerich FP. Characterization of human cytochrome P450 enzymes. FASEB J 1992;6:745‐748. [DOI] [PubMed] [Google Scholar]
- 53. Cho YE, Im EJ, Moon PG, Mezey E, Song BJ, Baek MC. Increased liver‐specific proteins in circulating extracellular vesicles as potential biomarkers for drug‐ and alcohol‐induced liver injury. PLoS One 2017;12:e0172463. [DOI] [PMC free article] [PubMed] [Google Scholar]
Associated Data
This section collects any data citations, data availability statements, or supplementary materials included in this article.
Supplementary Materials
Additional Supporting Information may be found at onlinelibrary.wiley.com/doi/10.1002/hep4.1210/full.


