Abstract
We investigated the mechanisms of resistance of two antimalarial drugs piperaquine (PQ) and lumefantrine (LM) using the rodent parasite Plasmodium berghei as a surrogate of the human parasite, Plasmodium falciparum. We analysed the whole coding sequence of Plasmodium berghei chloroquine resistance transporter (Pbcrt) and Plasmodium berghei multidrug resistance gene 1(Pbmdr-1) for polymorphisms, these genes are associated with quinoline resistance in Plasmodium falciparum. No polymorphic changes were detected in the coding sequences of Pbcrt and Pbmdr1 or in the mRNA transcript levels of Pbmdr1. However, our data demonstrated that PQ and LM resistance is achieved by multiple mechanisms that include elevated mRNA transcript levels of V-type H+ pumping pyrophosphatase (vp2), Ca2+/H+ antiporter (vcx1), gamma glutamylcysteine synthetase (ggcs) and glutathione-S-transferase (gst) genes, mechanisms also known to contribute to chloroquine resistance in P. falciparum and rodent malaria parasites. The increase in ggcs and gst transcript levels was accompanied by high glutathione (GSH) levels and elevated activity of glutathione-S-transferase (GST) enzyme. Taken together, these results demonstrate that Pbcrt and Pbmdr1 are not associated with PQ and LM resistance in P. berghei ANKA, while vp2, vcx1, ggcs and gst may mediate resistance directly or modulate functional mutations in other unknown genes.
Keywords: Malaria, Plasmodium berghei, Resistance, Piperaquine, Lumefantrine
1. Introduction
Chemotherapy remains central in the control of malaria. However, the rapid emergence and spread of resistance still hinders malaria control through the use of drugs. To minimize the loss of drugs to resistance World Health Organization (WHO) recommends the use artemisinin based combination therapies (ACT), combinations of the short acting artemisinin derivative and a long half-life partner drug (WHO, 2010). Today, the combination, lumefantrine (LM) and artemether (ATM), is the first line malaria treatment in many African countries, including Kenya (Ogutu et al., 2014), but there is a concern that resistance to LM will be selected relatively quickly due to mismatched pharmacokinetics between partner drugs (Sisowath et al., 2009; Mwai et al., 2012). An alternative combination treatment for malaria is piperaquine (PQ) and dihydroartemisinin (DHA), the second line treatment in Kenya (Ogutu et al., 2014). In both combinations, an artemisinin derivative is partnered with a drug against which resistance may arise relatively quickly, especially in high malaria transmission settings.
The initial use of PQ in China, a bisquinoline antimalarial drug chemically related to chloroquine (CQ) and other 4-aminoquinolines, was thought to herald a new dawn for malaria chemotherapy. Due to the high potency and tolerability of PQ, the drug supplanted CQ as the first line regimen in China (Davis et al., 2005). However, extensive and indiscriminate use for treatment and prophylaxis in China led to the emergence of resistance in Plasmodium falciparum and the subsequent withdrawal of PQ as a monotherapy (Davis et al., 2005). The other artemisinin derivative partner drug, LM belongs to the arylalcohol group of antimalarials structurally similar to mefloquine (MQ), halofantrine (HF) and quinine (QN) (Schlitzer, 2008). LM is effective against CQ resistant parasites with studies on resistance mechanisms indicating an inverse correlation with CQ and AQ resistance in P. falciparum (Mwai et al., 2009a).
To date, the mechanism of action and resistance markers for LM and PQ are poorly understood. Emergence of LM and PQ resistance seems to involve a complex network of genes. The mechanism of action of PQ and LM is predicted to be similar to that of CQ (Raynes, 1999; Tarning, 2007; Mwai et al., 2009a), which binds to ferriprotoporphyrin-IX (heme) in the digestive vacuole inhibiting polymerization of toxic heme into non-toxic hemozoin and consequently killing the parasite (Biagini et al., 2003; Robert et al., 2001). Thus, these drugs may share some resistance mechanisms. For instance, CQ resistance in P. falciparum is known to be associated with the mutation at codon 76 [Lys76Thr] in the chloroquine resistance transporter (Pfcrt) gene (Fidock et al., 2000; Cooper et al., 2005), and interestingly, the selection of Lys76 (wild-type allele) of Pfcrt has been associated with LM reduced susceptibility (Mwai et al., 2009b). Likewise, point mutations, increased transcript levels and increased copy numbers of the Plasmodium falciparum multidrug resistance gene 1 (Pfmdr1) have been associated with LM resistance in P. falciparum (Sidhu et al., 2006; Sisowath et al., 2005; Sisowath et al., 2007) and modulation of CQ resistance (Reed et al., 2000). Whole genome hybridization studies of PQ resistant P. falciparum revealed a single nucleotide polymorphism (SNP) in the pfcrt gene and copy number reduction in a 82kb region in chromosome 5 that included pfmdr1 (Eastman et al., 2011). The SNP in the crt gene and the amplification were however retained with loss of PQ resistant phenotypes (Eastman et al., 2011). Therefore, response to LM and PQ may potentially involve crt and mdr1 but also additional genes.
Resistance mechanisms are accompanied by compensatory and modulatory changes within the same or different genes (Jiang et al., 2008). For instance, studies on adaptive modification accompanying altered functionality of crt identified the V-type H+ pumping pyrophosphatase 2 (vp2) and Ca2+/H+ antiporter (vcx1) as genes associated with modifying drug resistance (Jiang et al., 2008). Furthermore, researchers have linked glutathione (GSH) pools to drug resistance in malaria parasites (Ginsburg et al., 1999; Meierjohann et al., 2002; He et al., 2009; Patzewitz et al., 2013). For instance, P. berghei and P. falciparum lines resistant to CQ revealed increased levels of both GSH and GSH-associated enzyme activity relative to their sensitive counterparts (Dubois, et al., 1995; Meierjohann, et al., 2002). In recent findings CQ resistance in P. chabaudi was also associated with an increase in GST and GSH levels (He et al., 2009). An increase in gamma glutamylcysteine synthetase (ggcs) mRNA levels was linked with CQ and mefloquine (MQ) resistance in P. berghei (Perez-Rosado et al., 2002).
Due to the limitations and complexity of selecting resistance in P. falciparum in vitro (Nzila & Mwai, 2010), the malaria parasite that infects rodent models have been used to study the genetic organization of drug resistance in vivo (Hunt et al., 2004a; Hunt et al., 2004b; Hunt et al., 2010; Carlton et al., 2001; Martinelli et al., 2011). Gervais et al. (1999) demonstrated an overexpression of mdr1 in MQ resistant P. berghei lines, the gene associated with MQ resistance in P. falciparum and P. chabaudi (Cravo et al., 2003). Recently, two mutations in a novel gene deubiquitinating enzyme 1 (ubp1) were associated with artesunate (ASN) and CQ resistance in P. chabaudi (Hunt et al., 2007). Although ubp1 remains to be confirmed as a gene involved in ASN or CQ resistance in P. falciparum, several studies have focused on this gene as a possible ASN resistance marker (Chavchich et al., 2010; Hunt et al., 2007; Rodrigues et al., 2010). In addition, the mdr-2 gene was recently mapped as a new resistance marker for sulfadoxine–pyrimethamine resistance in P. chabaudi (Martinelli et al., 2011).
In this study, we examined the resistance mechanisms to PQ and LM using the malaria parasite that infects rodents, P. berghei ANKA as a surrogate of the human parasite, Plasmodium falciparum. We previously selected stable PQ and LM resistant P. berghei ANKA lines through continuous drug pressure (Kiboi et al., 2009), further phenotypic analysis established that LM and PQ resistant lines were also resistant to mechanistically and chemically related and unrelated drugs such as DHA, CQ, MQ and primaquine (PMQ), thus are multidrug resistant phenotypes (Kiboi et al., 2009; Langat et al., 2012).
This study is based on two assumptions; first, the mode of PQ and LM action is similar to that of CQ and they also share mechanisms of resistance, therefore the orthologs of Pfcrt and Pfmdr1 in P. berghei may also carry mutations that confer PQ and LM resistance. Secondly, acquisition of PQ and LM resistance is augmented by increased transcript of modulatory and compensatory genes associated with quinoline drug transporters. We first cloned the resistant lines and interogated for sequence variation in Pbmdr1 and Pbcrt genes by PCR amplification and sequencing. We then investigated changes in expression of resistance compensating and modulating genes by measuring the relative amounts of mRNA of Pbvp2, Pbvcx1, Pbggcs and glutathione-S transferase (gst) in the resistant clones and their sensitive progenitors. Finally, to assess whether changes in gst and ggcs transcript levels are concomitant with changes in gene product, we measured GSH levels and activities of glutathione metabolism enzymes; glutathione-s-transferase (GST), glutathione peroxidase (GPx) and glutathione reductase (GR).
2. Material and Methods
2.1. Parasites, Host and Compounds
Two drug sensitive parasite lines of P. berghei ANKA, denoted PQ sensitive (PQS) (MRA-865, MR4, ATCC® Manassas, Virginia) and LM sensitive (LMS) (MRA-868, MR4, ATCC® Manassas, Virginia) were used as reference parental lines. Stable PQ resistant (PQr) and LM resistant (LMr) P. berghei ANKA previously submitted to drug selection pressure were used (Kiboi et al., 2009).
Male Swiss albino mice weighing 20±2g out-bred at KEMRI, Animal house Nairobi, were used for the study. The animals were housed in the animal house in standard polypropylene (hard plastic) cages and fed on commercial rodent food and water ad libitum. PQ or LM were freshly prepared by dissolving it in a solvent consisting of 70% Tween-80 (d=1.08g/ml) and 30% ethanol (d=0.81g/ml) and subsequently diluted 10 fold with double distilled water.
2.2. Dilution cloning of resistant parasite
To generate genetically homogenous resistant parasites, three different generations from PQr and three generations from LMr parasite lines (Table 1) were dilution cloned based on the protocol by Janse et al. (2004). Briefly, a mouse with parasitaemia between 0.5 and 1% was selected as a donor mouse. 5μl of infected blood was collected from the tail of the mouse in 1μl of heparin and diluted in 1ml of 1×PBS. The number of infected erythrocytes per 1μl was estimated from 20μl of diluted blood. The cell suspension was then diluted further with 1×PBS to an estimated final concentration of 0.5 parasites/0.2ml PBS. Twenty mice were intravenously injected each with 0.2ml/mouse of infected blood. Cloning was deemed successful when 20-50% of the inoculated mice became positive and showed a parasitaemia of between 0.3-1 percent at day 8 post infection.
Table 1.
List of generations from piperaquine resistant (PQr) and lumefantrine resistant (LMr), their 50% effective doses (ED50) and the number of clones (number of positive mice on day 8 post infection) obtained from limited dilution experiment using 20 mice per generation with each mouse receiving 0.5 parasites
| PQr(passage No) | ED50(mg/kg) | No of clones | LMr (passage No) | ED50(mg/kg) | No of clones |
|---|---|---|---|---|---|
| Stability line (27th) | 110 | 6 | Stability line (48th) | 116.34 | 8 |
| Mosquito passed (MP) resistant line (40th) | 25 | 4 | Mosquito passed (MP) resistant line (40th) | 49 | 6 |
| 60th generation | >110 | 4 | 60th generation | >116 | 3 |
2.3. Determination of GSH level and activity profiles of GST, GPx and GR in parasites
The infected erythrocytes were obtained from mouse whole blood, which was collected by cardiac puncture into 50µl of heparin. Erythrocytes were separated from plasma by centrifugation at 600g for 10 minutes, washed two times with three volumes of PBS and counted. For measurement of GSH levels and GST, GPx and GR activities in the isolated parasites, infected erythrocytes were lysed using ammonium chloride based on the protocol by Martin et al. (1971). Infected blood was diluted to a suspension of 109parasites/ml. The GSH levels and the activities of GST, GPx and GR in isolated parasites were measured by enzyme kinetics. The rate of increase of the reaction product or decrease of the substrate is directly proportional to the enzyme activity in the sample. GSH was determined in the isolated parasite using glutathione assay kit (Sigma-Aldrich, Saint Louis, Missouri). Briefly, 50µl aliquot of isolated parasites was added to 200µl of 5% Sulfosalisylic acid solution. The solution was voltexed, left on ice for 15 minutes and then centrifuged at 10,000 x g for 10 minutes. The supernatant was measured for calculation of glutathione levels. The GST, GR and GPx activities were measured using commercial kits (Sigma-Aldrich, Saint Louis, Missouri). Briefly, the isolated parasites were first subjected to five freeze-thaw cycles (Meierjohann et al., 2002). After centrifugation of the suspension for 15 minutes at 10,000 x g, the supernatant was collected for determination of GST, GR and GPx activities.
2.4. Drug sensitivity Profiles Tests
To assess the resistance profile of individual clones generated by dilution cloning, the fastest growing clone in each generation (27th, 40th and 60th for PQr) and (40th, 48th and 60th for LMr) was selected and evaluated for its response to PQ or LM in the 4-Day Suppressive Protocol as per Fidock et al., (2004). Briefly for each clone selected, mice were infected intraperitoneally with 1×10⁶ parasites/mouse. Oral treatment of drug was initiated on day 0, (4 h post-infection) and continued for four days, (24, 48 and 72 h post-infection). Parasite density was estimated microscopically (×100) on day 4 (96 h) post parasite inoculation using thin blood films made from tail blood. Parasite growth was then followed for at least 15 days post-infection to assess the recrudescence of the parasites after cessation of drug treatment.
2.5. DNA extraction, PCR and Sequencing
Parasite DNA was extracted by first removing mouse white blood cells through successive filtration of infected blood using Plasmodipur filters, (Euro-Diagnostica). Briefly, packed cells were re-suspended in 5 volumes of cold (4ºC) 1× erythrocyte Lysis buffer (ammonium chloride solution) for 15-30 minutes, before spinning at 2000rpm for 8 minutes to obtain the parasite pellet. Genomic DNA was extracted using the commercially available QiAamp DNA Blood Kit (Qiagen).
To amplify Pbcrt (PBANKA_121950) and Pbmdr1 (PBANKA_123780), 1µl of genomic DNA from each sample was used as template in 25µl PCR reactions. The other reagents MgCl2, dNTPs, forward and reverse primers, Dream Taq Polymerase (Thermo-Scientific) and cycling conditions were optimized accordingly as shown in Table 2a. PCR products were analysed in 1% agarose gel, purified using GeneJet™ PCR purification kit (Thermo scientific™) and then sequenced based in BigDye v3.1 using a 3730xlsequencer. The primers used for sequencing the genes are shown in Table 2b and 2c. Contigs were assembled using Lasergene 11 Core Suite, the DNA sequences and the predicted amino acid sequences were analysed using CLUSTAL W available in EBI website (www.ebi.ac.uk) and searched by BLAST© software available at the NCBI Website and PlasmoDB version 11.0 (EuPathDB, 2013).
Table 2a.
Optimized condition for PCR amplification of Pbcrt and Pbmdr1 genes using primer upstream of 5’ and downstream of 3’ untranslated region
| PCR amplifying profiles | Temperature (°C) /Time (min) | |
|---|---|---|
| Pbcrt | Pbmdr1 | |
| Initial denaturation | 95°C, 5 min | 95°C, 5 min |
| Denaturation | 95°C, 1 min | 95°C, 1 min |
| Annealing Temperature | 50°C, 45 sec | 48°C, 45 sec |
| Elongation | 68°C, 6 min | 68°C, 5 min |
| Primer (Forward & reverse) | 1.0 pmol/µl each | 1.0 pmol/µl each |
| Mgcl2 (mM) | 2.0 | 1.5 |
| dNTPs(mM) | 0.2 | 0.2 |
| Cycles | 35 | 35 |
| Final elongation | 72°C, 10 min | 72°C, 10 min |
Table 2b.
Primer sequences for PCR amplifying and sequencing P. berghei Pbcrt candidate genes
| Primer Name: | Primer Sequence (5' to 3'): PCR primers |
|---|---|
| Pbcrt -UTR upstream | TGCTTTTCTAACTCTTGAGGACA |
| Pbcrt -UTR downstream | GTCTTCTAAACAACGAGCATGCT |
|
Pbcrt Primer Sequence (5' to 3'): Sequencing primers |
|
| Pbcrt 1f | TACTCCCTAATATTAGGTTACAT |
| Pbcrt 1r | CTGAAGTAACAAAACTATAATTTCCC |
| Pbcrt 2f | GGACAGCCTAATAACCAATGG |
| Pbcrt 2r | CGACCATAGCATTCAATCTTAGG |
| Pbcrt 3f | GGTTCATGTTTCTTGGATATCGG |
| Pbcrt 3r | GCTGGTCCTTGTATACAACTAAC |
| Pbcrt 4f | CCTAAGATTGAATGCTATGGTCGT |
| Pbcrt 4r | GTTAATTCTGCTTCGGAGTCATTG |
| Pbcrt 5f | TGTTAGTTGTATACAAGGACCAGC |
| Pbcrt 5r | TCACAAAAGGAACAAACGGTCA |
Table 2c.
Primer sequences for PCR amplifying and sequencing P. berghei Pbmdr1 candidate genes
| Primer Name: | Primer Sequence (5' to 3'): PCR primers |
|---|---|
| Pbmdr1-1f UTR | GTCTAAATGTTGTAATTTGTTGTCCT |
| Pbmdr1 r (UTR) | GACATTATCTAATTTCATCACCTTG |
| Pbmdr-1: Sequencing Primer (5' to 3'): | |
| Pbmdr1 f (UTR) | TTCACGCTATAAAAGTACAGACTA |
| Pbmdr1-1r | CAGTATCATTCACACTTTCTCC |
| Pbmdr1-2f | GTGCAACTATATCAGGAGCTTCG |
| Pbmdr1-2r | CACTTTCTCCACAATAACTTGCTACA |
| Pbmdr1-3f | GCAGCTCTATATGTAATAAAAGGGTC |
| Pbmdr1-3r | GTCGACAGCTGGTTTTCTG |
| Pbmdr1-4f | CTTTGAATTACGGTAGTGGCT |
| Pbmdr1-4r | TCGCTAGTTGTATTCCTCTTAGA |
| Pbmdr1-5f | TGGAGTAGTTAGTCAAGATCCT |
| Pbmdr1-5r | GTGCCTTGTTCAACTATTACAC |
| Pbmdr1-6f | TCAAATAGAGATCAAGAATCAACAGG |
| Pbmdr1-6r | GGATATAAACCACCTGCCACT |
| Pbmdr1-7f | GCCAAGTAAACCATCATTCTTCA |
| Pbmdr1-7r | TCGCGTTGTAATGGTATATGCT |
| Pbmdr1-8f | GGATTTTTATCGTCGCATATTAACAG |
| Pbmdr1-8r | TAGCTTTATCTGCATCTCCTTTGAAG |
| Pbmdr1-9f | TGCAATAGATTATGACAGTAAAGGGG |
| Pbmdr1-9r | ATCTTTCAAATCGTAGAATCGCAT |
| Pbmdr1-10f | CTTCAAAGGAGATGCAGATAAAGCTA |
| Pbmdr1-10r | GATTCAATAAATTCGTCAATAGCAGC |
| Pbmdr1-11f | TGCAATAGTTAACCAAGAACCAATGT |
| Pbmdr1-11r UTR | CAATAGCCGATTAAAAGAAAAAACGA |
2.6. Analysis of Pbmdr1, Pbvp2, Pbggcs, Pbgst and Pbvcx1 transcription
To quantify mRNA transcripts of Pbmdr1, Pbvp2 (PBANKA_132050), Pbvcx1 (PBANKA_010230), Pbggcs (PBANKA_081980) and Pbgst (PBANKA_102390) genes, fresh parasite pellets were prepared and total RNA was extracted from at least 1×10⁶ parasites based on High Pure RNA extraction kit (Roche™). The RNA was immediately used for cDNA synthesis. The first-strand cDNA synthesis was performed in a final volume of 20µl using Transcriptor First Strand cDNA synthesis kit (Roche™) and oligo-dT as primers, briefly 5µg of total RNA, 1µl of oligo-dT (2.5µM) and water were mixed with 4µl of Transcriptor Reverse Transcriptase buffer (5×), 0.5 µl RNase Inhibitor (40U/µl), 2 µl of dNTPs (10mM) and 0.5 µl of Transcriptor Reverse Transcriptase (20U/µl) was added. The RT reaction mix was incubated at 50°C for 60 min, then at 85°C for 5 min and finally chilled on ice. The cDNA was used as template for RT-PCR assays or stored at -15 to -20°C for longer period.
2.7. Quantitative RT-PCR Assays
Real-Time PCR assays were designed to evaluate the levels of Pbmdr1, Pbvp2, Pbvcx1, Pbggcs and Pbgst RNA transcripts relative to those of Pbβ-actin (PBANKA_145930), a housekeeping gene. Oligonucleotides and TaqMan™ probes (Table 3) were designed to run PCR reactions for the genes in the same plate (using similar cycling conditions). cDNA samples, primers and probes were added to FastStart Essential DNA probes Master (Master (Roche™) according to the manufacturer’s instructions. The PCR amplification was done as per the following conditions: 95°C for 4 minutes; followed by denaturation at 95°C for 15sec and annealing/extension at 58°C for 30 sec, for 45 cycles
Table 3.
Oligonucleotide primers and TaqMan probes used to assess Pbmdr1, Pbvp2, Pbvcx1, Pbggcs, and Pbgst transcription levels with Pbβ-actin as housekeeping
| Name | Primer sequence (5’ – 3’) | Position | Tm |
|---|---|---|---|
| Pbmdr1- F | ACGGTAGTGGCTTCAATGGA | 917-936 | 54.2 |
| Pbmdr1- A | CTGTCGACAGCTGGTTTTCTG | 1082-1062 | 54.7 |
| Pbmdr1- Oligo | FAM–TTGCTGAATATATGAAATCGTTAGAGGCAA-TAMRA | 1007-1036 | 61.9 |
| Pbvp2 -F | TGCAGCAGGAAATACAACAGC | 1449-1469 | 55.2 |
| Pbvp2 -A | GTCGTACTTTTGCACTACTTGCGT | 1558-1535 | 56.5 |
| Pbvp2 -Oligo | FAM–TGCACCGAATAAGGCAAAAGCAA-TAMRA | 1533-1511 | 62.3 |
| Pbggcs -F | TGAATGCGTCGAAAAAGAAG | 810-829 | 52.8 |
| Pbggcs -A | CTTCGATGCCTAGCGTTTC | 874-856 | 52.3 |
| Pbggcs -Oligo | FAM–TGAATGCCAATGTGATGTTGCA-TAMRA | 831-852 | 59.2 |
| Pbgst -F | GACGCAAGAGGTAAAGCTGAAC | 31-52 | 54.6 |
| Pbgst -A | CGAACTATAGATTGGCTTTGAGC | 230-208 | 54.0 |
| Pbgst -Oligo | FAM–TGGTGATGCATTTGCAGAATTTAACAAT-TAMRA | 114-141 | 62.3 |
| Pb β-actin -F | CAGCAATGTATGTAGCAATTCAAGC | 392-416 | 56.8 |
| Pb β-actin -A | CATGGGGTAATGCATATCCTTCATAA | 523-498 | 58.9 |
| Pb β-actin -Oligo | FAM–ATTCATCAGGCCGTACAACAGGTATTGT-TAMRA | 431-458 | 62.5 |
| Pbcvx1 -F | TCAAATTGCTCTTTTTGTTGTACCAA | 1101-1126 | 57.9 |
| Pbcvx1 -R | ACACCTTCTAGCCAATTACTTTCACC | 1265-1240 | 57.1 |
| Pbcvx1-Oligo | FAM–CTATGACCTTAGCCTTTTCTCCTTTATCAA-TAMRA | 1160-1189 | 59.8 |
2.8. Statistical Analysis
The means of expression levels of each gene from three independent experiments and from triplicate assays obtained from LMr and PQr were compared to LMS and PQS respectively using Student’s t-test; P value was set at 0.05. The relative expression level results were normalized using Pbβ-actin as the housekeeping gene using the formula 2-ΔΔCT based on Livak and Schmittgen, 2001. The means of GSH levels, GST, GPx and GR activities obtained from five mice for each of the parasites clone were also compared using a Student‘s t test and p values less than 0.05 were considered significant.
3.0. Results
3.1. Cloning by limiting dilution of resistance phenotypes
We selected the fastest growing clone from each generation for subsequent drug sensitivity profile. The PQr selected clone from the 60th generation was termed PQR60c1; the clone from 27th generation, PQR27c1 and the clone from 40th generation were termed mpPQRc1. For the LMr parasites, the selected clone from the 60th generation was termed LMR60c1; the clone from 48th generation, LMR48c1, while the clone from the 40th generation was termed mpLMRc1.
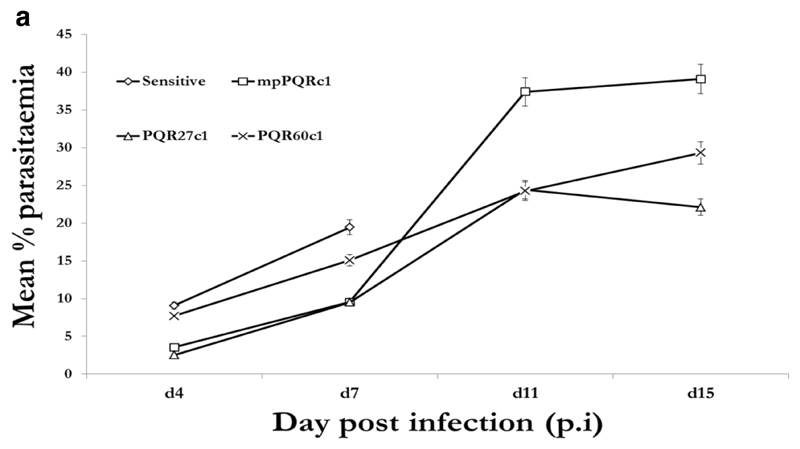
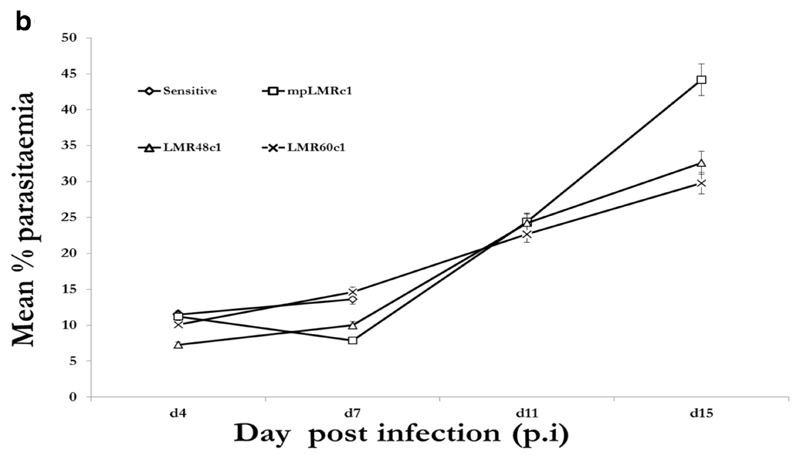
We then submitted PQR60c1, mpPQRc1, PQR27c1 and PQS clones to PQ treatment while LMR60c1, mpLMRc1, LMR48c1 and LMS clones were treated with LM. Piperaquine and LM were evaluated at 50mg/kg administered for 4 successive days in groups of five mice along the PQS or LMS which received a lower dose of 12.5mg/kg for four consecutive days. As expected all eight (8) clones (6 resistant and 2 wild-type sensitive) grew well in mice in the absence of drug treatment with peak parasitaemia reaching 19.43% (PQS), 13.63 % (LMS) while for resistant clones, 15.06% (PQR60c1), 9.70% (PQR27c1), 9.05% (mpPQRc1), 14.61% LMR60c1, 9.98% (LMR48c1), 7.86% (mpLMRc1) Figure 1a and 1b.
Figure 1a.
Growth profiles of the fastest growing clones obtained by dilution cloning piperaquine resistant parasite of 40th (mpPQRc1), 27th (PQR27c1) and 60th (PQR60c1) generation in absence of piperaquine in reference to the wild-type drug sensitive line. The data points obtained from an average of five mice per group.
Figure 1b.
Growth profiles of the fastest growing clones obtained by dilution cloning lumefantrine resistant parasite of 40th (mpLMRc1), 48th (LMR48c1) and 60th (LMR60c1) generation in absence of lumefantrine in reference to the wild-type drug sensitive line. The data points obtained from an average of five mice per group
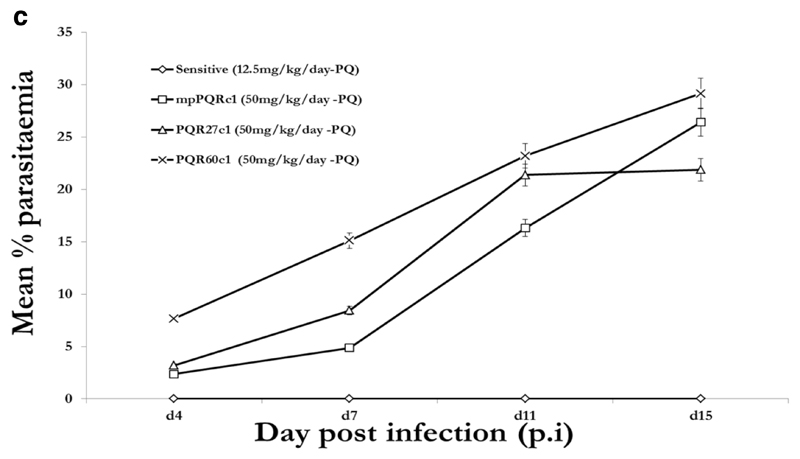
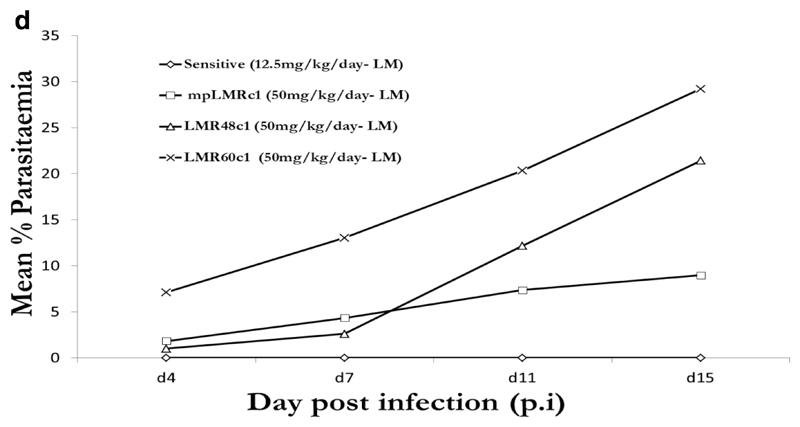
Under PQ and LM treatment (12.5mg/kg), no parasites were detected in mice infected with PQS or LMS parasite over the 15 day post infection (p.i.) follow up period. In the presence of drug (50mg/kg), resistant clones grew well with parasitaemia reaching 16.68 % (PQR60c1), 8.43 % (PQR27c1), 4.86 % (mpPQRc1), 14.28% (LMR60c1), 2.61% (LMR48c1), 4.30% (mpLMRc1) 7 days p.i, Figure 1c and 1d. We therefore concluded that PQR60c1, mpPQRc1, PQR27c1, mpLMRc1, LMR48c1 and LMR60c1 were successfully cloned. PQR60c1 and LMR60c1 clones were selected for interrogation of point mutation and differential expression assay due to their high resistance level.
Figure 1c.
Activity profiles of piperaquine against selected dilution cloned piperaquine resistant parasites from 27th (PQR27c1), 40th (mpPQRc1) and 60th (PQR60c1) generation in reference to the wild-type drug sensitive line. The data point values were determined from an average of five mice per treatment group.
Figure 1d.
Activity profiles of lumefantrine against selected dilution cloned lumefantrine resistant parasites from 40th (mpLMRc1), 48th (LMR48c1) and 60th (LMR60c1) generation in reference to the wild-type drug sensitive line. The data point values were determined from an average of five mice per treatment group.
3.2. Evaluation of sequence variation of Pbcrt and Pbmdr1 genes
We amplified and sequenced the whole coding region of Pbcrt and Pbmdr1 in PQR60c1 and LMR60c1 and their parental drug sensitive parasite, PQS and LMS, respectively. The results showed the nucleotide and translated protein sequences of these genes are the same in all tested lines (drug-sensitive and drug resistant strains) (supplementary material).
3.3. Assessment of mRNA expression by quantitative Real-time PCR
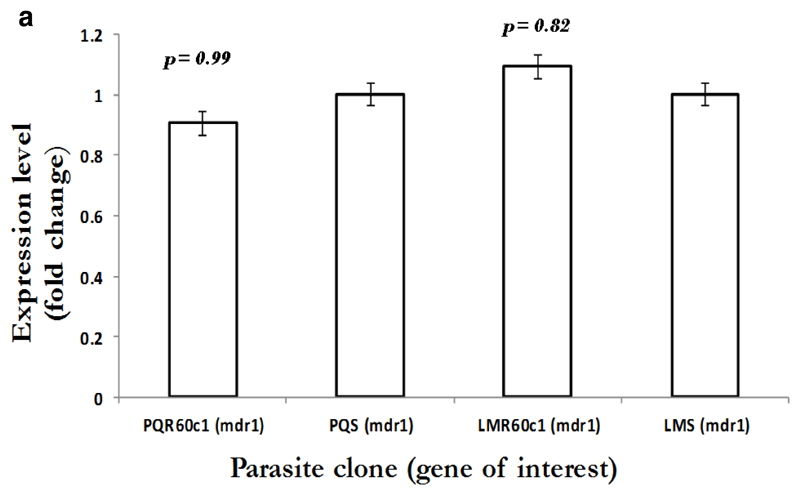
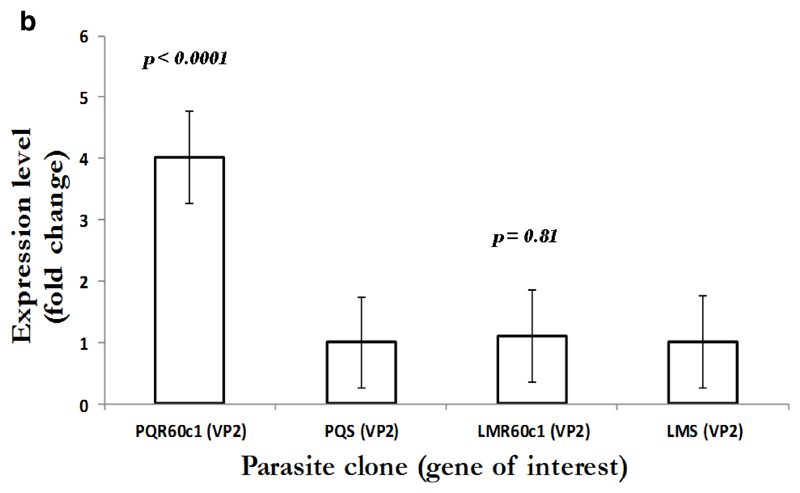
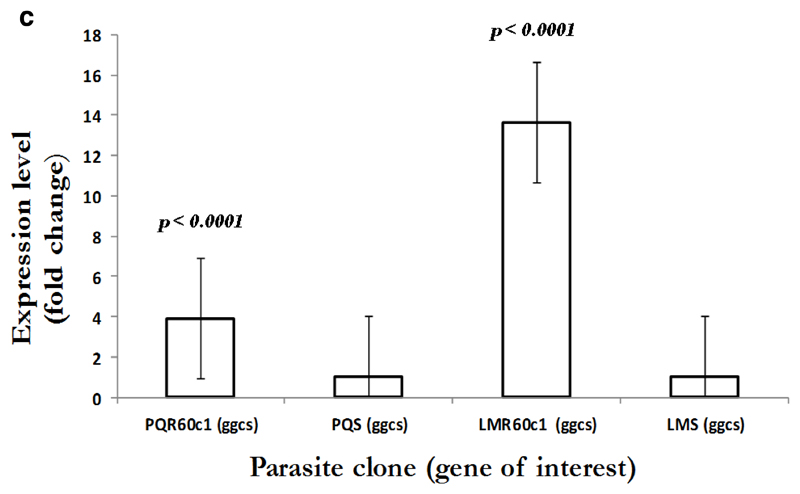
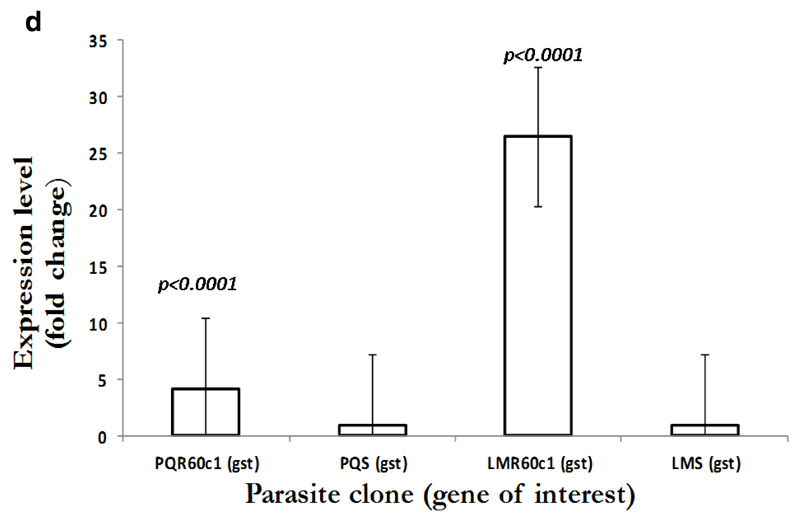
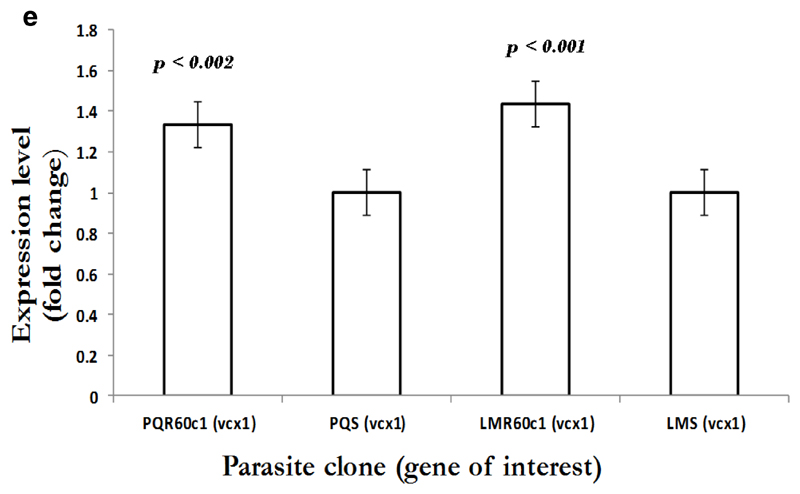
To gain an insight into the potential modulation and compensatory mechanisms, we measured mRNA transcript profiles of Pbmdr1, Pbvp2, Pbcvx1 Pbggcs and Pbgst. As shown in Figure 2a, no difference in mdr1 expression was observed between PQS and PQR60c1, with level of expression of 0.9 in PQR60c1 and 1.0 in PQs (p=0.99); while values for LMS and LMR60c1 was 1.09 and 1.0, respectively (p=0.82). Thus, there was no change in expression level in both LMr and PQR60c1 clone. We further assessed V-type H+ pumping pyrophosphatase, a transporter involved in regulation H+ molecules in protozoa and plants cells (McIntosh et al., 2001). The transcript level of Pbvp2 in LMR60c1 remained unchanged (1.10 folds, p=0.81). Interestingly in PQR60c1 clone, Pbvp2 levels were 4 times higher compared to PQs (p<0.0001) Figure 2b. We also evaluated the transcript intensities of enzymes associated with glutathione metabolism, the levels of Pbggcs were significantly elevated in both PQR60c1 and LMR60c1 parasites (Figure 2c). Surprisingly, the level of Pbggcs in LMR60c1 was 13-fold higher compared to the LMS (p<0.0001). In the PQR60c1 clone the level was 3 times higher (p<0.0001). Remarkably, the LMR60c1 parasites showed a 26-fold change in Pbgst of higher levels than in the LMS parasites (p<0.0001) (Figure 2d). The PQR60c1 contained Pbgst transcripts that were 4 times higher relative to sensitive parasite (p<0.0001). Finally, we measured the transcript amount of Ca2+/H+ mobilizing transporter, cvx1, and the data showed that in comparison with sensitive parasites, the difference in levels were statistically significant 1.34-fold (p<0.002) and 1.43-fold (p<0.001) in PQR60c1 and LMR60c1, respectively (Figure 2e).
Figure 2a.
Expression profiles in multidrug resistance gene 1 (mdr1) as measured from cDNA amount derived from 5µg of total RNA isolated from piperaquine resistant (PQR60c1) and lumefantrine resistant (LMR60c1) relative to their wild type drug sensitive parental clones piperaquine sensitive (PQS) and lumefantrine sensitive (LMS) clones respectively. The differential expression from a mean of three independent experiments were not significantly different for PQR60c1 (p= 0.99), for LMR60c1 (p = 0.82) after student’s t-test analysis with p-value set at 0.05.
Figure 2b.
Expression profiles in V-type H+ pumping pyrophosphatase (VP2) as measured from cDNA amount derived from 5µg of total RNA isolated from piperaquine resistant (PQR60c1) and lumefantrine resistant (LMR60c1) relative to their wild type drug sensitive parental clones piperaquine sensitive (PQS) and lumefantrine sensitive (LMS) clones respectively. The differential expression from a mean of three independent experiments showed significant difference (p<0.0001) in PQR60c1 with 4 folds increase but levels remained unchanged in LMR60c1 (p = 0.81) parasite clones after student’s t-test analysis with p value set at 0.05.
Figure 2c.
Expression profiles in gamma (γ)-glutamyl-cysteine-synthetase (ggcs) as measured from cDNA amount derived from 5µg of total RNA isolated from piperaquine resistant (PQR60c1) and lumefantrine resistant (LMR60c1) relative to their wild type drug sensitive parental clones piperaquine sensitive (PQS) and lumefantrine sensitive (LMS) clones respectively. The differential expression from a mean of three independent experiments showed significant increase with a 3.89 and 13.65 folds times in PQR60c1 (p<0.0001) and LMR60c1 (p<0.0001) respectively after student’s t-test analysis with p value set at 0.05.
Figure 2d.
Expression profiles in glutathione S- transferase (gst) as measured from cDNA amount derived from 5µg of total RNA isolated from piperaquine resistant (PQR60c1) and lumefantrine resistant (LMR60c1) relative to their wild type drug sensitive parental clones piperaquine sensitive (PQS) and lumefantrine sensitive (LMS) clones respectively. The differential expression from a mean of three independent experiments showed a significantly high levels of 4.17 and 26.49 folds in PQR60c1 (p<0.0001) and LMR60c1 (p<0.0001) resistant clones respectively after student’s t-test analysis with p value set at 0.05.
Figure 2e.
Expression profiles in Ca2+/H+ antiporter (vcx1) as measured from cDNA amount derived from 5µg of total RNA isolated from piperaquine resistant (PQR60c1) and lumefantrine resistant (LMR60c1) relative to their wild type drug sensitive parental clones piperaquine sensitive (PQS) and lumefantrine sensitive (LMS) clones respectively. The differential expression from a mean of three independent experiments show significant difference with a 1.34 and 1.43 folds increase in expression level in PQR60c1 (p<0.002) and LMR60c1 (p<0.001) respectively after student’s t-test analysis with p value set at 0.05.
3.4. Assessment of GSH levels and GST, GPx and GR activities
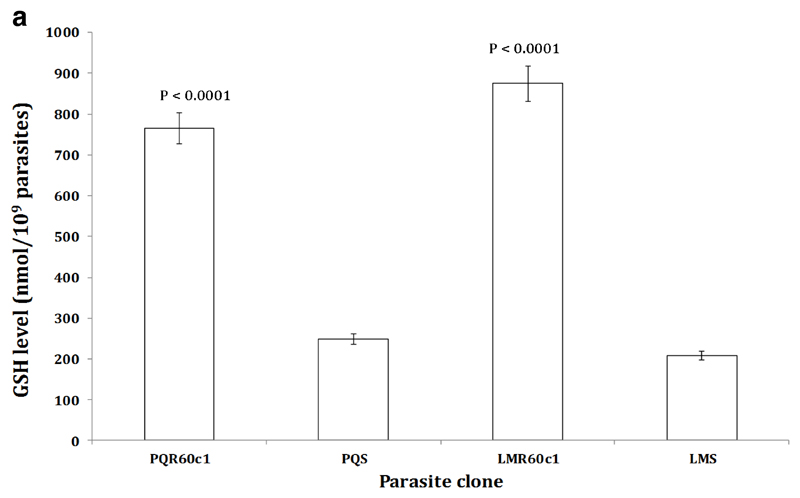
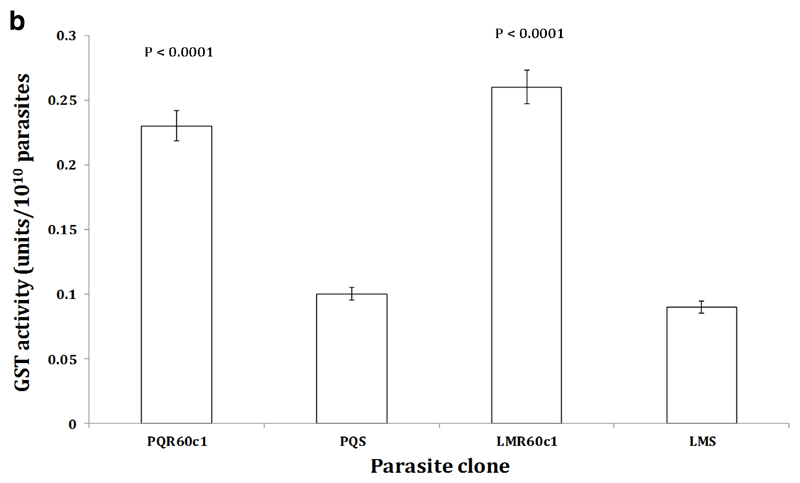
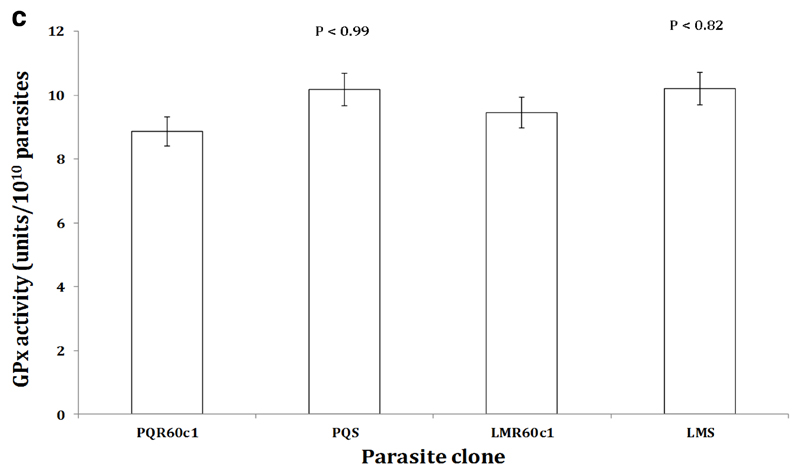
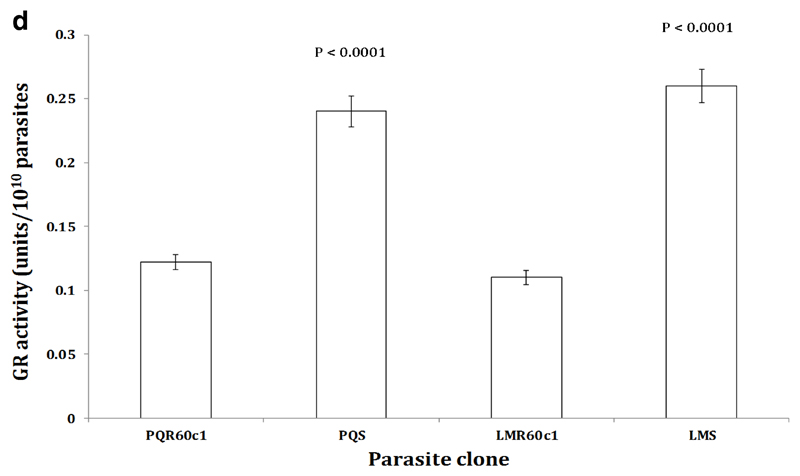
To determine whether the increase in transcription of the Pbggcs and Pbgst was concomitant with increase in its product, we measured the relative amount of GSH and activity of GST enzyme in the different parasite clones using enzyme kinetics. We observed a significant four-fold increase in GSH levels in LMR60c1 (p<0.0001) and GSH levels were three times elevated in PQR60c1 (p<0.0001) parasites (Figure 3a). Similarly the activity of GST was significantly higher in LMR60c1 (p<0.0001) and PQr (p<0.0001) with a three and two- fold rise compared to sensitive progenitors, LMs and PQs, respectively. Finally, we assayed the activity profiles of GR and GPx. Interestingly, GR activities in LMR60c1 and PQR60c1 were two times lower compared to LMs (p<0.0001) and PQs (p<0.0001) parasites, respectively. There was however no significant difference in GPx activities between LMs and LMR60c1 (p<0.82) nor PQs and PQR60c1 (p<0.99).
Figure 3a.
The level of intracellular glutathione (GSH) measured from isolated piperaquine resistant (PQR60c1) and lumefantrine resistant (LMR60c1) relative to their wild type drug sensitive parental piperaquine sensitive (PQS) and lumefantrine sensitive (LMS) clones respectively. The isolated parasites were prepared to determine GSH activities as described in Section 2. The results are expressed as mean and standard errors of five mice. The GSH level was significantly higher in PQR60c1 (p<0.0001) and LMR60c1 (p<0.0001) compared to PQS and LMS respectively after student’s t-test analysis with p value set at 0.05.
4.0. Discussion
In this study we have shown that in both LMr and PQr phenotypes, Pbcrt is not linked with PQ, LM or CQ cross-resistance in P. berghei ANKA. We thus suggest the selection of PQ and LM resistance is nonspecific and not related with predicted mechanism of CQ action. Second, we suggest that CQ cross-resistance observed in LMr and PQr is also nonspecific, mediated by mechanisms independent of the crt gene, therefore novel mutations may exist that associate with PQ, LM and also CQ cross-resistance. Indeed, studies show that PQ and LM remain active against parasites possessing the key mutation in Pfcrt K76T (Pascual et al., 2013), indicating that PQ and LM resistance may evolve independently of mutations in the Pfcrt gene.
As previously reported, PQr and LMr are cross-resistant to chemically related and unrelated drugs, such as DHA, PMQ, MQ, CQ and amodiaquine (AQ) (Kiboi et al., 2009; Langat et al., 2012), thus are true multidrug resistant phenotypes and the Pbmdr1 polymorphisms may be mediating PQ and LM responses and also their cross-resistance profiles. The mdr1 gene controls drug response via two mechanisms; first by the acquisition of mutations and second by variation of copy number and expression level in drug resistant P. falciparum (Price et al., 2004; Mwai et al., 2012; Valderramos & Fidock, 2006). However, our data does not link Pbmdr1 polymorphisms with control of either PQr or LMr phenotypes, similarly; we did not associate differential transcription of Pbmdr1 with either of the resistant phenotypes. The increase in mdr1 transcripts controls resistance to multiple drugs in P. chabaudi, P. yoelii and in P. falciparum (Cravo et al., 2003; Ferrer-Rodriguez et al., 2004; Chavchich et al., 2010; Rodrígues et al., 2010). We thus suggests that mdr1 does not control PQ or LM responses in P. berghei and that the multidrug resistance phenotypes observed in both PQr and LMr is operated by mechanisms independent of mdr1 gene. Therefore, other novel mechanisms may control the multidrug resistance profiles observed in PQr and LMr phenotypes.
The present work supports association of Pbggcs with the control of both PQr and LMr phenotypes. The ortholog of this gene in P. falciparum is closely associated with mediating and modulating AQ and CQ resistance through a tightly controlled enzymatic reaction (Ginsburg et al., 1998; Patzewitz et al., 2013). Gamma glutamyl cysteine synthetase is the rate limiting enzyme in GSH synthesis (Tew, 1994), therefore elevated transcription would be accompanied by high GSH concentration. Studies have shown that high GSH concentration is directly associated with increased detoxification of the CQ via GSH-drug binding mechanisms (Ginsburg et al., 1999) and CQ competitively inhibits GSH mediated detoxification of ferriprotoporphyrin (FP) (Ginsburg & Golenser, 2003). Thus, if the mechanism of LM and PQ resistance is similar to that of CQ, then two possible mechanisms may exist; first, high GSH in PQr and LMr phenotypes may bind LM or PQ increasing the effective dosage and second, high GSH concentration may competitively reduce the level of free FP for LM or PQ binding thus protecting the parasite from the pro-oxidant activity of the PQ- or LM-FP complex. We have further demonstrated that high GST activity is associated with LM or PQ resistance in P. berghei. The GST enzyme possesses peroxidase activity (Perez-Rosado et al., 2002), consequently high GST activity may be increasing GSH-LM or PQ conjugates, thus reducing drug concentration available for action.
Elevated GST activity and high GSH concentration are associated with CQ and MQ resistance in P. berghei and P. chabaudi (Perez-Rosado et al., 2002; He et al., 2009). As we alluded to earlier, PQr and LMr phenotypes showed cross-resistance to CQ, MQ, DHA and PMQ (Kiboi et al., 2009). We thus hold the opinion that increase in GST activity and high GSH levels may be one of the mechanisms mediating the cross-resistance profiles possibly through drug-GSH binding and competitive FP-GSH conjugates. It has been reported that intracellular GSH level is sustained by de novo biosynthesis and reduction of GSSG (Ginsburg & Golenser, 2003). Our data thus suggest that both PQs and LMs parasites preserve their capacity to maintain GSH-GSSG redox status through the action of GR. This redox status in PQr and LMr phenotypes however seems to be maintained by the de novo synthesis of GSH, possibly due to high requirements for removal of the drug and FP. Our postulations do not mean that high GSH concentration and GST activity are the sole mechanisms of LM and PQ resistance. Indeed, GSH mediated mechanisms may be a downstream process that modulates drug response in PQr and LMr phenotypes, thus unknown novel gene may exist that directly mediate PQ and LM resistance. Our data however does not support resistance mechanisms that may be GSH independent.
We have also shown that increased expression levels of the vp2 gene is associated with PQ resistance, but not with LM resistance in P. berghei ANKA. This gene is involved in the transport and regulation of cytoplasm pH (Jiang et al., 2008), recently it was shown that the vp2 gene was differentially expressed in LM resistant parasites (Mwai et al., 2012). The PQr parasites are also resistant to LM (Kiboi et al., 2009). We thus do not rule out its link with LM cross-resistance in PQr phenotypes, meaning that the increase in vp2 transcriptional levels may be selected via a different selection procedure. This may also suggest that vp2 may not be the key mechanism for adapting LM resistant phenotypes but perhaps serves to synergize resistance or compensate for the acquisition of deleterious mutations in resistant phenotypes. Increase in Pbvcx1 transcript levels was associated with both PQ and LM resistance. Recently, the putative drug transporter, Pfvcx1 in response to K76T mutation in Pfcrt was linked with CQ resistance or to the modulation of CQ resistance (Jiang et al., 2008). Assuming Pbvcx1 plays a similar role of modulating resistance in our PQr and LMr parasites, then two scenarios exist, first is that increased expression of vcx1 is independent of the crt mutation in P. berghei ANKA and second is that novel mutations may exist that harbingers the differential expression of Pbvcx1.
In conclusion, we have identified for the first time the association of vp2 with PQ resistance and ggcs, gst, and vcx1 increased transcript levels with PQ and LM resistance in P. berghei ANKA. These compensatory or modulatory genes are thought to evolve in response to polymorphisms in Pfcrt and Pfmdr1 genes occurring in CQ (Jiang et al., 2008) and LM resistant phenotypes (Mwai et al., 2012). However, our PQr and LMr phenotypes possess no polymorphism in ortholog Pbcrt and Pbmdr1. Therefore, these compensatory or modulatory mechanisms may be controlled by unknown causal gene variants. This is because the genetic background in P. berghei and P. falciparum are different thus the resistance phenotype in each species is probably mediated by different molecular markers. However, if the same mechanisms prevail in P. falciparum in the field, this study demonstrates that the analysis of rodent malaria parasites may provide biological insights on drug response profiles.
Supplementary Material
Figure 3b.
The activity profiles of glutathione-s-transferase (GST) measured from isolated piperaquine resistant (PQR60c1) and lumefantrine resistant (LMR60c1) relative to their wild type drug sensitive parental piperaquine sensitive (PQS) and lumefantrine sensitive (LMS) clones respectively. The isolated parasites were prepared to determine GST activities as described in Section 2. The results are expressed as mean and standard errors of five mice. One unit of GST activity is defined as the amount (in µmol) of the reaction product (GS-DNB conjugate) per min. The GST activity was significantly higher in PQR60c1 (p<0.0001) and LMR60c1 (p<0.0001) compared to PQS and LMS respectively after student’s t-test analysis with p value set at 0.05.
Figure 3c.
The activity profiles of glutathione peroxidase (GPx) measured from isolated piperaquine resistant (PQR60c1) and lumefantrine resistant (LMR60c1) relative to their wild type drug sensitive parental piperaquine sensitive (PQS) and lumefantrine sensitive (LMS) clones respectively. The isolated parasites were prepared to determine GPx activities as described in Section 2. The results are expressed as mean and standard errors of five mice. One unit of GPx activity is defined as the formation of 1µmol of NADP+ from NADPH per min. The GPx activity was not significantly different in PQS (p<0.99) and LMS (p<0.82) compared to PQR60c1 and LMR60c1 respectively after student’s t-test analysis with p value set at 0.05.
Figure 3d.
The activity profiles of glutathione reductase (GR) measured from isolated piperaquine resistant (PQR60c1) and lumefantrine resistant (LMR60c1) relative to their wild type drug sensitive parental piperaquine sensitive (PQS) and lumefantrine sensitive (LMS) clones respectively. The isolated parasites were prepared to determine GPx activities as described in Section 2. The results are expressed as mean and standard errors of five mice. One unit of GR activity is defined as the reduction of 1µmol of DTNB to TNB per min. The GR activity was significantly higher in PQS (p<0.0001) and LMS (p<0.0001) compared to PQR60c1 and LMR60c1 respectively after student’s t-test analysis with p value set at 0.05.
Acknowledgements
We thank the Director of the Kenya Medical Research Institute for permission to publish this work. This study was supported by UNICEF/UNDP/WORLDBANK/WHO Special Programme for Research and Training in Tropical Diseases (TDR) (A90201) and the Kenyan Government through the National Commission for Science and Technology (NCST/5/003/3rd CALL PhD/165).
Footnotes
Ethics Approval
The study and all animal work were conducted according to national and international guidelines. The study was approved by the National KEMRI scientific and ethical review Committees and the Animal Care and Use Committee
References
- Biagini GA, O’Neill P, Nzila A, Ward S, Bray PG. Antimalarial chemotherapy young guns or back to the future. Trends in Parasitology. 2003;19:479–487. doi: 10.1016/j.pt.2003.09.011. [DOI] [PubMed] [Google Scholar]
- Carlton JM-R, Hayton K, Cravo PV, Walliker D. Of mice and malaria mutants: unraveling the genetics of drug resistance using rodent malaria models. Trends in Parasitology. 2001;17:236–241. doi: 10.1016/s1471-4922(01)01899-2. [DOI] [PubMed] [Google Scholar]
- Chavchich M, Gerena L, Peters J, Chen N, Cheng Q, Kyle DE. Role of pfmdr1 Amplification and Expression in Induction of Resistance to Artemisinin Derivatives in Plasmodium falciparum. Antimicrobial Agents and Chemotherapy. 2010;54:2455–2464. doi: 10.1128/AAC.00947-09. [DOI] [PMC free article] [PubMed] [Google Scholar]
- Cooper RA, Hartwig CL, Ferdig M. pfcrt is more than the Plasmodium falciparum chloroquine resistance gene: a functional and evolutionary perspective. Acta Tropica. 2005;94:170–180. doi: 10.1016/j.actatropica.2005.04.004. [DOI] [PubMed] [Google Scholar]
- Cravo P, Carlton J, Hunt P, Bisoni L, Padua R, Walliker D. Genetics of mefloquine resistance in the rodent malaria parasite Plasmodium chabaudi. Antimicrobial Agents and Chemotherapy. 2003;47:709–718. doi: 10.1128/AAC.47.2.709-718.2003. [DOI] [PMC free article] [PubMed] [Google Scholar]
- Davis T, Hung T, Sim I, Karunajeewa H, Ilett K. Piperaquine: a resurgent antimalarial drug. Drugs. 2005;65:75–87. doi: 10.2165/00003495-200565010-00004. [DOI] [PubMed] [Google Scholar]
- Dubois LV, Platel DF, Pauly G, Tribouley-Duret J. Plasmodium berghei: Implication of Intracellular Glutathione and its Related Enzyme in Chloroquine Resistance in Vivo. Experimental Parasitology. 1995;81:117–124. doi: 10.1006/expr.1995.1099. [DOI] [PubMed] [Google Scholar]
- Eastman RT, Dharia NV, Winzeler EA, Fidock DA. Piperaquine Resistance Is Associated with a Copy Number Variation on Chromosome 5 in Drug-Pressured Plasmodium falciparum Parasite. Antimicrobial Agents and Chemotherapy. 2011;55:3908–3916. doi: 10.1128/AAC.01793-10. [DOI] [PMC free article] [PubMed] [Google Scholar]
- EuPathDB. PlasmoDB Version 9.3. 2013 Mar 11; Retrieved March 13, 2013, from Plasmodium Genomics Resource: http://plasmodb.org/plasmo/
- Ferrer-Rodríguez I, Perez-Rosado J, Gervais GW, Peters W, Robinson BL, Serrano AE. Plasmodium yoelii: Identification and partial characterization of an mdr-1 gene in artemisinin-resistant line. Journal of Parasitology. 2004;90:152–160. doi: 10.1645/GE-3225. [DOI] [PubMed] [Google Scholar]
- Fidock DA, Nomura T, Talley AK, Cooper RA, Dzekunov SM, Ferdig M, et al. Mutations in the P. falciparum digestive vacuole transmembrane protein PfCRT and evidence for their role in chloroquine resistance. Molecular Cell. 2000;6:861–871. doi: 10.1016/s1097-2765(05)00077-8. [DOI] [PMC free article] [PubMed] [Google Scholar]
- Fidock DA, Rosenthal P, Croft SL, Brun R, Nwaka S. Antimalarial Drug Discovery: Efficacy Model for Compound Screening. Nature Reviews: Drug Discovery. 2004;3:509–520. doi: 10.1038/nrd1416. [DOI] [PubMed] [Google Scholar]
- Gervais G, Trujillo K, Robinson B, Peters W, Serrano A. Plasmodium berghei: identification of an mdr-like gene associated with drug resistance. Experimental Parasitology. 1999;91:86–92. doi: 10.1006/expr.1999.4344. [DOI] [PubMed] [Google Scholar]
- Ginsburg H, Golenser J. Glutathione is involved in the antimalarial action of chloroquine and its modulation affects drug sensitivity of human and murine species of Plasmodium. Redox Report. 2003;8:276–279. doi: 10.1179/135100003225002907. [DOI] [PubMed] [Google Scholar]
- Ginsburg H, Famin O, Zhang J, Krugliak M. Inhibition of Glutathione-dependent Degradation of Heme By Chloroquine and Amodiaquine as a Possible Basis for Their Antimalarial Mode of Action. Biochemical Pharmacology. 1998;56:1305–1313. doi: 10.1016/s0006-2952(98)00184-1. [DOI] [PubMed] [Google Scholar]
- Ginsburg H, Ward SA, Bray P. An Integrated Model of Chloroquine Action. Parasitology Today. 1999;15:357–360. doi: 10.1016/s0169-4758(99)01502-1. [DOI] [PubMed] [Google Scholar]
- He ZX, Chen LL, You JL, Qin L, Chen XP. Antiretroviral Protease Inhibitors Potentiate Chloroquine Antimalarial Activity in Malaria Parasite by Regulating Intracellular Glutathione Metabolism. Experimental Parasitology. 2009;123:122–127. doi: 10.1016/j.exppara.2009.06.008. [DOI] [PubMed] [Google Scholar]
- Hunt P, Afonso A, Creasey A, Culleton R, Sidhu AB, Logan J, et al. Gene encoding a deubiquitinating enzyme is mutated in artesunate and chloroquine-resistant rodent malaria parasites. Molecular Microbiology. 2007;65:27–40. doi: 10.1111/j.1365-2958.2007.05753.x. [DOI] [PMC free article] [PubMed] [Google Scholar]
- Hunt P, Cravo P, Donleavy P, Carlton J-R, Walliker D. Chloroquine resistance in Plasmodium chabaudi: are chloroquine-resistance transporter (crt) and multi-drug resistance (mdr1) orthologues involved. Molecular & Biochemical Parasitology. 2004b;133:27–35. doi: 10.1016/j.molbiopara.2003.08.010. [DOI] [PubMed] [Google Scholar]
- Hunt P, Martinelli A, Fawcett R, Carlton J, Carter R, Walliker D. Gene synteny and chloroquine resistance in Plasmodium chabaudi. Molecular and Biochemical Parasitology. 2004a;136:157–164. doi: 10.1016/j.molbiopara.2004.03.008. [DOI] [PubMed] [Google Scholar]
- Hunt P, Martinelli A, Modrzynska K, Borges S, Creasey A, Rodrigues L, et al. Experimental evolution, genetic analysis and genome re-sequencing reveal the mutation conferring artemisinin resistance in isogenic lineage of malaria parasites. BMC Genomics. 2010;11:499. doi: 10.1186/1471-2164-11-499. [DOI] [PMC free article] [PubMed] [Google Scholar]
- Janse C, Ramesar J, Waters A. Plasmodium berghei: General parasitological methods. Leiden University Medical Center, Parasitology. Leaiden Malaria Research Group; Leiden: 2004. [Google Scholar]
- Jiang H, Patel J, Yi M, Mu J, Ding J, Stephens R, et al. Genome Wide Compensatory Changes Accompany Drug-Selected Mutations in the Plasmodium falciparum crt Gene. PLoS One. 2008;3:e2484. doi: 10.1371/journal.pone.0002484. [DOI] [PMC free article] [PubMed] [Google Scholar]
- Kiboi DM, Irungu BN, Langat B, Wittlin S, Brun R, Chollet J, et al. Plasmodium berghei ANKA: Selection of resistance to piperaquine and lumefantrine in a mouse model. Experimental Parasitology. 2009;122:196–202. doi: 10.1016/j.exppara.2009.03.010. [DOI] [PMC free article] [PubMed] [Google Scholar]
- Langat B, Kiboi D, Irungu B, Kimoloi S, Nyambati V, Rukunga G. Lumefantrine-resistant and Piperaquine resistant Plasmodium berghei show cross resistance to Primaquine but not to Atovaquone. African Journal of Pharmacology and Therapeutics. 2012;1:35–40. [Google Scholar]
- Livak KJ, Schmittgen TD. Analysis of Relative Gene Expression Data Using Real-Time Quantitative PCR and the 2-ΔΔCT method. Methods. 2001;25:402–408. doi: 10.1006/meth.2001.1262. [DOI] [PubMed] [Google Scholar]
- Martin W, Finerty J, Rosenthal A. Isolation of Plasmodium berghei (malaria) parasites by ammonium chloride lysis of infected erythrocytes. Nature New Biology. 1971;233:260–261. doi: 10.1038/newbio233260a0. [DOI] [PubMed] [Google Scholar]
- Martinelli A, Henriques G, Cravo P, Hunt P. Whole genome re-sequencing identifies a mutation in an ABC transporter (mdr2) in a Plasmodium chabaudi clone with altered susceptibility to antifolate drugs. International Journal for Parasitology. 2011;41:165–171. doi: 10.1016/j.ijpara.2010.08.008. [DOI] [PMC free article] [PubMed] [Google Scholar]
- McIntosh MT, Drozdowicz YM, Laroiya K, Rea PA. Two classes of plant-like vacuolar-type H+-pyrophosphatases in malaria parasites. Molecular and Biochemical Parasitology. 2001;114:183–195. doi: 10.1016/s0166-6851(01)00251-1. [DOI] [PubMed] [Google Scholar]
- Meierjohann S, Walter RD, Muller S. Regulation of intracellular glutathione levels in erythrocytes infected with chloroquine-sensitive and chloroquine-resistant Plasmodium falciparum. Biochemical Journal. 2002;368:761–768. doi: 10.1042/BJ20020962. [DOI] [PMC free article] [PubMed] [Google Scholar]
- Mwai L, Diriye A, Masseno V, Muriithi S, Feltwell T, Musyoki J, et al. Genome Wide Adaptations of Plasmodium falciparum in Response to Lumefantrine Selective Drug Pressure. PLoS One. 2012;7:e31623. doi: 10.1371/journal.pone.0031623. [DOI] [PMC free article] [PubMed] [Google Scholar]
- Mwai L, Kiara SM, Abdirahaman A, Pole L, Rippert A, Diriye A, et al. In vitro activities of piperaquine, lumefantrine and dihydroartemisinin in Kenyan Plasmodium falciparum isolates and polymorphisms in pfcrt and pfmdr-1. Antimicrobial Agents and Chemotherapy. 2009a:5069–5073. doi: 10.1128/AAC.00638-09. [DOI] [PMC free article] [PubMed] [Google Scholar]
- Mwai L, Ochong E, Abdirahman A, Kiara SM, Ward S, Kokwaro G, et al. Chloroquine resistance before and after its withdrawal in Kenya. Malaria Journal. 2009b;8:106. doi: 10.1186/1475-2875-8-106. [DOI] [PMC free article] [PubMed] [Google Scholar]
- Nzila A, Mwai L. In vitro selection of Plasmodium falciparum drug resistant parasite lines. Journal of Antimicrobial Chemotherapy. 2010;65:390–398. doi: 10.1093/jac/dkp449. [DOI] [PMC free article] [PubMed] [Google Scholar]
- Ogutu B, Onyango K, Koskei N, Omondi E, Ongecha J, Otieno GA, et al. Efficacy and safety of artemether-lumefantrine and dihydroartemisinin-piperaquine in the treatment of uncomplicated Plasmodium falciparum malaria in Kenyan children aged less than five years: results of an open-label, randomized, single-centre study. Malaria Journal. 2014;13:33. doi: 10.1186/1475-2875-13-33. [DOI] [PMC free article] [PubMed] [Google Scholar]
- Pascual A, Madamet M, Bertaux L, Amalvict R, Benoit N, Travers D, et al. In vitro piperaquine susceptibility is not associated with the Plasmodium falciparum chloroquine resistance transporter gene. Malaria Journal. 2013;12:431. doi: 10.1186/1475-2875-12-431. [DOI] [PMC free article] [PubMed] [Google Scholar]
- Patzewitz E, Salcedo-Sora J, Wong E, Sethia S, Stocks P, Maughan SC, et al. Glutathione Transport: A New Role for PfCRT in Chloroquine Resistance. Antioxidants & Redox Signaling. 2013;19:683–695. doi: 10.1089/ars.2012.4625. [DOI] [PMC free article] [PubMed] [Google Scholar]
- Perez-Rosado J, Gervais GW, Ferrer-Rodríguez I, Peters W, Serrano AE. Plasmodium berghei: analysis of the -glutamylcysteine synthetase gene in drug-resistant lines. Experimental Parasitology. 2002;101:175–182. doi: 10.1016/s0014-4894(02)00138-8. [DOI] [PubMed] [Google Scholar]
- Price R, Uhlemann A, Brockman A, McGready R, Ashley E, Phaipun L, et al. Mefloquine resistance in Plasmodium falciparum and increased pfmdr1 gene copy number. Lancet. 2004;364:438–447. doi: 10.1016/S0140-6736(04)16767-6. [DOI] [PMC free article] [PubMed] [Google Scholar]
- Raynes K. Bisquinoline antimalarials:their role in malaria chemotherapy. International Journal for Parasitology. 1999;29:367–379. doi: 10.1016/s0020-7519(98)00217-3. [DOI] [PubMed] [Google Scholar]
- Reed MB, Saliba K, Caruana SR, Kirk K, Cowman AF. Pgh1 modulates sensitivity and resistance to multiple antimalarials in Plasmodium falciparum. Nature. 2000;403:906–909. doi: 10.1038/35002615. [DOI] [PubMed] [Google Scholar]
- Robert A, Benoit-Vical F, Dechy-Cabaret O, Meunier B. From classical antimalarial drugs to new compounds based on the mechanism of action artemisinin. Pure and Applied Chemistry. 2001;73:1173–1188. [Google Scholar]
- Rodrigues LA, Henriques G, Borges ST, Hunt P, Sanchez CP, Martinelli A, et al. Experimental Evolution of Resistance to Artemisinin Combination Therapy Results in Amplification of the mdr1 Gene in a Rodent Malaria Parasite. PLoS One. 2010;5:e11593. doi: 10.1371/journal.pone.0011593. [DOI] [PMC free article] [PubMed] [Google Scholar]
- Schlitzer M. Antimalarial drugs—what is in use and what is in the pipeline. Archiv der Pharmazie. 2008;341:149–163. doi: 10.1002/ardp.200700184. [DOI] [PubMed] [Google Scholar]
- Sidhu AB, Uhlemann AC, Valderramos SG, Valderramos JC, Krishna S, Fidock DA. Decreasing pfmdr1 copy number in Plasmodium falciparum malaria heightens susceptibility to mefloquine, lumefantrine, halofantrine, quinine, and artemisinin. Journal of Infectious Diseases. 2006;194:528–535. doi: 10.1086/507115. [DOI] [PMC free article] [PubMed] [Google Scholar]
- Sisowath C, Ferreira P, Bustamante L, Dahlstrom S, Martensson A, Bjorkman A, et al. The role of pfmdr1 in Plasmodium falciparum tolerance to artemether-lumefantrine in Africa. Tropical Medicine and International Health. 2007;12:736–742. doi: 10.1111/j.1365-3156.2007.01843.x. [DOI] [PubMed] [Google Scholar]
- Sisowath C, Petersen I, Veiga MI, Martensson A, Premji Z, Bjorkman A, et al. In vivo selection of Plasmodium falciparum parasites carrying the chloroquine susceptible pfcrt K76allele after treatment with artemether-lumefantrine in Africa. Journal of infectious Diseases. 2009;5:750–757. doi: 10.1086/596738. [DOI] [PMC free article] [PubMed] [Google Scholar]
- Sisowath C, Stromberg J, Martensson A, Msellem M, Obondo C, Bjorkman A, et al. In Vivo Selection of Plasmodium falciparum pfmdr1 86N Coding Alleles by Artemether-Lumefantrine (Coartem) The Journal of Infectious Diseases. 2005;191:1014–1017. doi: 10.1086/427997. [DOI] [PubMed] [Google Scholar]
- Tarning J. Piperaquine: Bioanalysis, drug metabolism and pharmacokinetics. Göteborg: Institute of Neuroscience and Physiology, Department of Pharmacology, the Sahlgrenska Academy at Göteborg University; 2007. [Google Scholar]
- Tew K. Glutathione-associated Enzymes in Anticancer Drug Resistance. Cancer Research. 1994;54:4313–4320. [PubMed] [Google Scholar]
- Valderramos S, Fidock DA. Transporters involved in resistance to antimalarial drugs. TRENDS in Pharmacological Sciences. 2006;27:594–601. doi: 10.1016/j.tips.2006.09.005. [DOI] [PMC free article] [PubMed] [Google Scholar]
- WHO. Guidelines for the treatment of malaria. 2nd Edition. Geneva: World Health Organization; 2010. [PubMed] [Google Scholar]
Associated Data
This section collects any data citations, data availability statements, or supplementary materials included in this article.


