

Abstract
Glioblastoma (GBM) is a lethal primary brain tumor characterized by treatment resistance and inevitable tumor recurrence, both of which are driven by a subpopulation of GBM cancer stem-like cells (GSC) with tumorigenic and self-renewal properties. Despite having broad implications for understanding GSC phenotype, the determinants of upregulated DNA damage response (DDR) and subsequent radiation resistance in GSC are unknown and represent a significant barrier to developing effective GBM treatments. In this study, we show that constitutive DDR activation and radiation resistance are driven by high levels of DNA replication stress (RS). CD133+ GSC exhibited reduced DNA replication velocity and a higher frequency of stalled replication forks than CD133- non-GSC in vitro; immunofluorescence studies confirmed these observations in a panel of orthotopic xenografts and human GBM specimens. Exposure of non-GSC to low-level exogenous RS generated radiation resistance in vitro, confirming RS as a novel determinant of radiation resistance in tumor cells. GSC exhibited DNA double strand breaks (DSB) which co-localized with 'replication factories' and RNA: DNA hybrids. GSC also demonstrated increased expression of long neural genes (>1Mbp) containing common fragile sites, supporting the hypothesis that replication/transcription collisions are the likely cause of RS in GSC. Targeting RS by combined inhibition of ATR and PARP (CAiPi) provided GSC-specific cytotoxicity and complete abrogation of GSC radiation resistance in vitro. These data identify RS as a cancer stem cell-specific target with significant clinical potential.
Introduction
Despite detailed characterization of the genomic and molecular landscape of glioblastoma (GBM) life expectancy for patients with this aggressive tumor remains extremely poor (1, 2). Standard of care comprises neurosurgical resection followed by treatment with radiotherapy and temozolomide, both of which are DNA damaging agents (3). Accumulating evidence suggests that the inevitable recurrence of GBM after chemoradiation is driven largely by GBM cancer stem-like cells (GSC), which drive resistance to DNA damaging therapies through constitutive up regulation of the DNA damage response (DDR) (4–6). This DDR phenotype has also been reported in cancer stem cells derived from other tumor types (7, 8) and in murine embryonic stem cells (9). Despite a decade of research, however, the underlying cause of DDR up regulation in GSC remains unclear. While an association with elevated levels of reactive oxygen species (ROS) has been reported (10), other studies have attributed radiation resistance to reduced levels of ROS in cancer stem cells (11).
A consistent feature of the GSC and cancer stem cell DDR phenotype is the up regulation and/or constitutive activation of multiple components of both the DNA repair and cell cycle checkpoint pathways (4, 12). Previously, we demonstrated the therapeutic relevance of this phenotype by showing that inhibition of both DNA repair and cell cycle checkpoint function was required to overcome radioresistance (12). While several other reports have confirmed the radiosensitizing potential of DDR inhibition at the pre-clinical level (10, 13) progression to the clinic has been frustratingly slow. The aim of this study was to elucidate the mechanisms underlying constitutive DDR activation in GSC and use this knowledge to identify new therapeutic strategies for this cancer of unmet need. Our approach was informed by previous studies describing elevated levels of DNA replication stress (RS) in glioma specimens, particularly GBM (14), and by emerging evidence that RS can activate a broader spectrum of DDR proteins than previously thought (15). RS can be defined as inefficient DNA replication that causes replication forks to progress slowly or stall, and may be caused by a wide variety of cellular and environmental factors (16, 17). Because replication stress can have adverse consequences including permanent DNA damage and genomic instability, it evokes a spectrum of cellular responses that act to stabilize stalled forks and reduce the risk of fork collapse and consequent DNA damage. Extensive overlap between the cellular responses to RS and radiation induced DNA damage supports the hypothesis that constitutive RS might be responsible for radiation resistance.
A further question is whether GSC arise from neural progenitor cells, or are the product of de-differentiation of malignant glioma cells (18). Embedded within this controversy is the related question of whether neural progenitor cells are the cell of origin of GBM (19). The recently published observation that neural progenitor cells are prone to acquisition of DNA double strand breaks (DSB) at specific chromosomal sites as a consequence of RS induced by transcription of long neural genes (20) strengthens the rationale for exploring RS in GSC with a view to exploring a potential phenotypic link between these two cell populations.
In this study, we demonstrate that GSC exhibit constitutively elevated RS both in vitro and in vivo, and that S phase GSC exhibit increased levels of DSB which arise at DNA ‘replication factories’. We show that exposure to exogenous RS generates significant radiation resistance in relatively radiosensitive non-GSC glioma cells. We provide evidence to support the hypothesis that RS and consequent activation of the DDR is associated with marked overexpression of very long genes, of which the most profoundly up regulated are the long neural genes previously shown to harbor DSB in neural stem cells (20). Finally, we show that targeting the RS response through combined ataxia telangiectasia and rad3 related protein (ATR) inhibition and poly (ADP-ribose) polymerase (PARP) inhibition (CAiPi) is an effective approach to overcoming the intrinsic radiation resistance of GSC.
Materials and Methods
Derivation and maintenance of primary GBM cell lines
Primary GBM cell lines E2, G7, R10, R15, R24, R9, S2 were derived from resected tumors and maintained as described previously (12, 21), approved by the local regional Ethics Committee (LREC ref 04/Q0108/60) in compliance with the UK Human Tissue Act 2004 (HTA License ref 12315). Tumorigenicity of paired GSC and differentiated GBM cell lines has been described previously (12, 21), (summarized in Supplemental table 1). Cell lines were utilized for 20 passages from thaw prior to being discarded and were tested for the presence of mycoplasma using the Lonza MycoAlert (LT07-318) assay on a 3 monthly basis.
Immunohistochemistry/immunofluorescence on tissue sections
Immunofluorescence microscopy on paraffin embedded sections was carried out as described previously (22). Following antigen retrieval sections were incubated sequentially with primary and secondary antibodies (Supplemental tables 2 and 3). Immunofluorescence images were acquired as Z stacks with a Zeiss 780 confocal microscope and processed using maximum intensity projection (MIP) method where individual nuclei were selected and quantified for mean fluorescent intensity (MFI) values using ImageJ. Sox2 high and low values were characterized as being above and below the median Sox2 MFI value in the whole imaged cell population respectively with the MFI of RPA32 being compared between the two groups. A minimum of 150 (range 150-700) nuclei per sample were quantified from 6-12 63x magnification fields. Non fluorescent immunohistochemistry slides were imaged using a Leica Slidepath system.
Clonogenic and neurosphere assays
Clonogenic survival assays were performed as described previously (12, 23). Cells were treated with DDR inhibitors or DMSO for 1 hour followed by mock or 1-5 Gy irradiation. Cells were then incubated for a further 24 hours followed by replacement with fresh media without DDR inhibitor. Cell cultures were incubated with aphidicolin (Sigma) 0.05 μM (or DMSO) for 72 hours then plated in media with no added aphidicolin and irradiated 1 hour after plating. Colonies were fixed in methanol after 2-3 weeks, stained with crystal violet and counted manually. Clonogenic survival data were fitted using a linear quadratic model and DMF 0.37 and SER 0.37 values were calculated from the fitted curve. Significance between survival curves was assessed by two way ANOVA.
For neurosphere assay 10 GSC were seeded into each well of a 96 well plate in 100 μL medium containing 1 μM Olaparib and/or 5 μM VE821 or DMSO control for 48 hours or irradiated with 2 Gy ionizing irradiation, followed by the addition of 150 μL of fresh media per well. Neurospheres were manually counted under 5x magnification after 3-4 weeks.
Flow cytometry and cell viability
CD133+ and CD133– populations were isolated using a FACSAria fusion platform following labeling with CD133 phycoerythrin (PE) conjugated antibody. Live cells were gated (Supplementary figure 1A) and sorted populations were grown in identical stem cell culture media for 3 to 7 days prior to harvesting.
Levels of ROS were measured using dichloro-dihydro-fluorescein diacetate (DCFDHA) OxiSelect™ In Vitro ROS Assay Kit according to manufacturer’s protocol (Cell Bio Labs Inc.). Briefly, bulk and GSC were harvested and incubated in PBS containing DCFDHA at 37°C for 20 minutes. Samples were washed twice in PBS followed by flow cytometry analysis of live cells. Dead cells were excluded using DAPI.
Cell cycle analysis using BrdU was carried out as described previously (12). Briefly, bulk and GSC were incubated with 10 μM BrdU for 35 minutes. Cells were washed in PBS and fixed in 70% ethanol. Samples were co-stained with anti-BrdU-FITC antibody (BD Bioscience) and propidium iodide. Flow cytometry data was collected using FACSVerse (BD Biosciences) following doublet discrimination and analyzed using FlowJo software (Tristar).
Cell viability was carried out using CellTiter-Glo® according to manufacturer’s protocol (Promega). Briefly, bulk cells and GSC were plated out in 96 well plates and treated with Olaparib (1 μM) and VE821 (1, 3 or 5 μM) for 24 hours or 6 days, replaced with fresh media and cultured for a further 5 days followed by followed by detection of luminescence (Promega GLOMAX).
In vitro immunofluorescence
Paired bulk and GSC were plated on coverslips coated with Matrigel. For BrdU studies, sub confluent paired bulk and/or GSCs were cultured on coverslips and pulse labelled with 10μM of BrdU for 30 minutes followed by fixation in 4% formaldehyde. Immunofluorescent visualization of RPA and pATM s1981 required removal of non-chromatin bound nuclear protein using an extraction buffer (24). Coverslips were washed in PBS and denatured in 2M HCl followed by immunostaining with anti-BrdU and γ-H2AX antibodies. For DDR inhibition studies, sub confluent cells were incubated with Olaparib and/or VE821 for 24 hours and fixed in 4% formaldehyde. Cells were incubated with anti-γ-H2AX, BrdU, RPA 32 and 53BP1 antibodies overnight at 4°C followed by incubation with secondary conjugated antibodies (Supplemental tables 2 and 3). Nuclei were counterstained with Vectashield mount containing DAPI. Z-stack images were acquired under identical parameters using Zeiss LSM 780 confocal microscope and analyzed using Zen 2012 (Zeiss). Co-localization was carried out using Zen Black software (Zeiss) from Z-stack images obtained at 40x magnification on a Zeiss 780 confocal microscope. Co-localization coefficients defined as the relative number of BrdU pixels that co-localizes with γ-H2AX pixels or relative number of γ-H2AX pixels that co-localize with S9.6 pixels; value range 0-1 where 0 denotes no co-localization and 1 represents all pixels co-localized and expressed as a percentage. 50-75 BrdU positive or 50-100 drug treated cells were analyzed and each experiment was repeated at least three times.
DNA fiber assays
DNA fiber assays were performed as described previously (15). Briefly, cultured cells were incubated for 20 minutes with media containing CIdU (25μM) followed by PBS wash and incubation with media containing IdU (250μM). Cell suspensions were pipetted onto glass microscopy slides and lysed. Slides were raised to an angle of 30° in order to stretch DNA fibers along the slide. Immunostaining was then performed. CIdU was detected using anti BrdU (rat) primary antibody (Abcam ab6326 1:400) and anti-rat alexa fluorophore 555 (Invitrogen A21434 1:500) secondary. IdU was detected using anti BrdU (mouse) primary antibody (BD 347580 1:500) and anti-mouse alexa fluorophore 488 (Invitrogen A11017 1:500).
Drug treatment and radiation
ATR inhibitor VE821 (Vertex Pharmaceuticals) and PARP inhibitor olaparib (Selleckchem) were dissolved in DMSO and used at concentrations stated. A concentration of 5μM VE821 was found to be sufficient to inhibit phosphorylation of Chk1s345 following 5Gy radiation (Supplementary figure 1B). An XStrahl RS225 cabinet at room temperature with 195 kV/15 mA X rays producing a dose rate of 1.6 Gy per minute was utilized for in vitro radiation studies. For UV studies, media was removed and cells were irradiated with 10 JM-2 UV (Stratalinker, Stratagene).
Western blotting
Western blotting was carried out as described previously (23).
RNA sequencing and bioinformatics
Total RNA was extracted from 7 paired bulk and GSC followed by generation of TruSeq Stranded mRNA library. Samples were run on four V3 flow cells with seven indexes per lane and sequenced on an Illumina HiSeq 2000™ to generate 30-45 M 100 paired-end reads (supplementary materials and methods). RNA-sequencing data files were quality checked using FastQC and FastQ-Screen (www.bioinformatics.babraham.ac.uk). RNA-sequencing reads were aligned to the GRCh37 version of the human genome (25) using Tophat2 version 2.0.10 (26) with Bowtie version 2.1.0 (27). Relative expression levels were determined and statistically analyzed by a combination of HTSeq and the R 3.0.2 environment, utilising packages from the Bioconductor data analysis suite and differential gene expression analysis based on the negative binomial distribution using the DESeq package (28).
Statistical Analyses
All experiments were repeated and data points reported as mean +/- SEM. Correlation of Sox2 and RPA32 integrated density was performed using Spearman ranks due to non-normal distribution of these variables. Two way ANOVA was utilized in analyses of clonogenic survival curves. Means compared by unpaired students’ t-test. Medians were compared by Mann Whitney U test. Statistical analysis and graphs were produced using Minitab 16 and Graphpad Prism 6.
Results
Radioresistant GSC demonstrate up regulation of DNA replication stress response markers
We previously characterized constitutive DDR activation and associated radioresistance of GSC in a panel of primary GBM cell lines propagated as paired GSC-enriched (‘GSC’) and GSC-depleted (‘bulk’) cultures (12, 23, 29). Increased expression of the GSC markers Nestin and Sox2 along with constitutive up regulation and activation of the DDR proteins Chk1 and ATR were confirmed in GSC cultures by Western blot (Figure 1A). Using a DCFHDA assay no significant differences in baseline ROS levels between GSC and tumor bulk cultures were observed (Figure 1B), so alternative mechanisms to explain the up regulated DDR in GSC were investigated. The consistent pattern of robust up regulation of phosphorylated ATR (Ser428) and phosphorylated CHK1 (Ser345) in GSC cultures (Figure 1A) led us to hypothesize that GSC populations might exhibit high levels of RS. Replication protein A (RPA) binds single stranded DNA (ssDNA) adjacent to collapsed or stalled replication forks and is necessary for the activation of ATR kinase in the cellular response to RS (30). Validation of the RS phenotype was therefore sought by probing for phosphorylation of RPA subunit 32 (RPA32) at Ser4 and Ser8, which is a specific marker of RS (31). While phospho-RPA32 (Ser4/8) levels were not detectable by Western blot in asynchronous undamaged cells, exacerbation of RS by low doses of UV radiation (10 Jm-2) elicited markedly greater phosphorylation of RPA32 in GSC than in paired tumor bulk populations (Figure 1C). Pulse labeling with BrdU revealed that RPA immunofluorescence intensity was significantly higher in S phase GSC than in tumor bulk cells in E2 and G7 cell lines; a trend towards higher intensity in R10 GSC narrowly failed to reach statistical significance (Figure 1D and E). While γ-H2AX foci are markers of DNA DSB, diffuse nuclear staining is also observed under conditions of RS (Supplementary figure 1C) (32, 33) with overall nuclear MFI correlating with levels of RS. In E2, G7 and R10 cultures, S phase GSC demonstrated significantly higher γ-H2AX diffuse MFI than corresponding tumor bulk cells, providing further evidence of elevated RS (Figure 1D and E).
Figure 1. Radioresistant GSCs demonstrate up regulation of DNA RS response markers, and exogenous RS generates radiation resistance in non-GSCs.

A Western blot analysis of RS response and GSC markers in a panel of paired GSC and tumor bulk primary GBM cultures. GAPDH loading control. B Flow cytometry plots showing baseline levels of reactive oxygen species (ROS) via quantification of DCFHDA mean fluorescence intensity (MFI) in GSC and tumor bulk cultures (mean +/- SEM, n=3, unpaired t-test, NS=non-significant), C Western blot analysis of phospho-RPA32 (Ser4/8) expression in a panel of paired GSC and tumor bulk cells following UV mediated activation of RS (10Jm-2). D Immunofluorescence images showing γ-H2AX and RPA32 staining in BrdU positive G7 GSC and tumor bulk cells under basal conditions. Nuclei are counterstained with DAPI. E Quantification of γ-H2AX and RPA32 MFI in E2, G7 and R10 GSC and tumor bulk cells, (mean +/-SEM, n = 3, *p<0.05, **p < 0.01, unpaired t-test). F Clonogenic survival of E2, R10 and G7 tumor bulk cell lines treated with radiation alone (blue line) and following incubation with 0.05µM aphidicolin (red line) for 72 hours prior to irradiation (mean +/-SEM, n = 3 **p<0.01, ****p<0.001 by two way ANOVA). Representative images of colonies formed following 0, 2 and 4 Gy are shown.
Exogenous replication stress can generate a radiation resistance phenotype in non-GSC
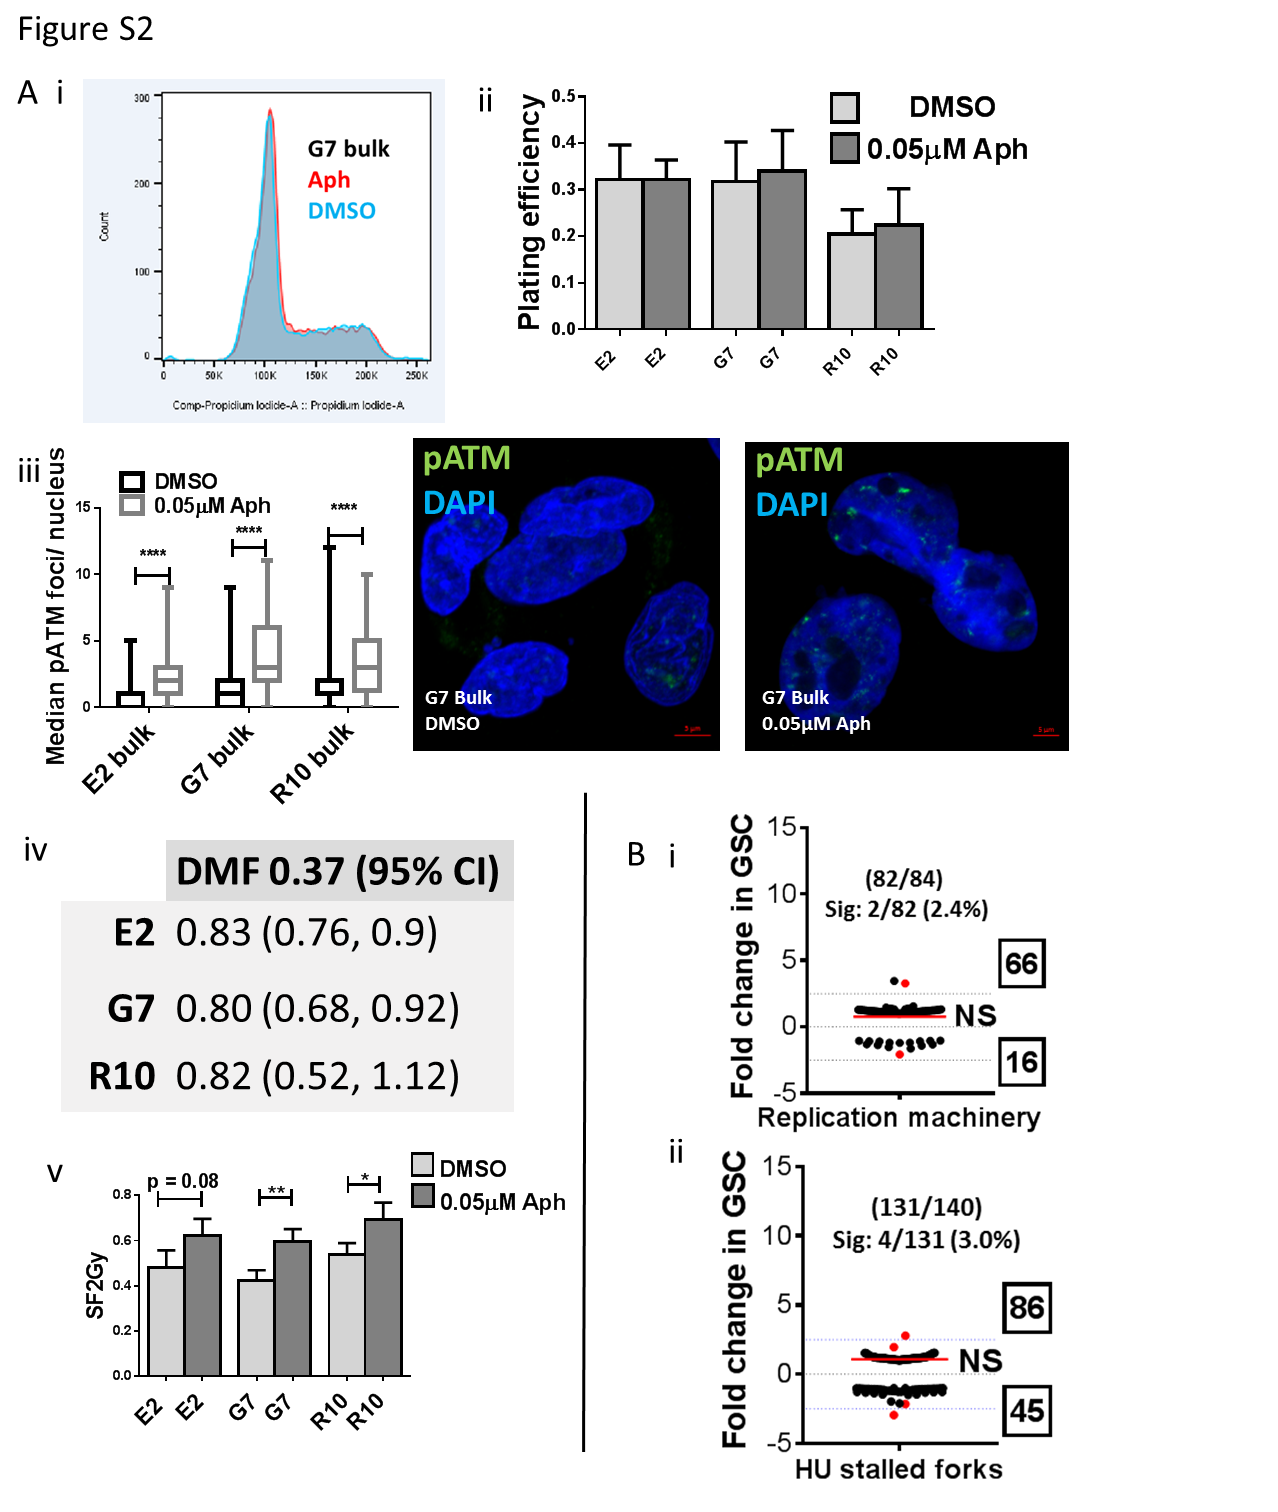
The hypothesis that exogenous RS could stimulate the DDR and thus enhance radioresistance was tested by incubating bulk cultures of E2, G7 and R10 (which are radiosensitive relative to E2, G7 and R10 GSC cultures (12, 23) with 0.05 μM aphidicolin for 72 hours prior to irradiation. This low concentration of aphidicolin is known to slow DNA replication fork speed and generate RNA: DNA hybrids, leading to RS and DDR activation (34, 35) but was not sufficient to induce S phase arrest or affect plating efficiency in the absence of radiation in these experiments (Supplementary figure S2A i,ii). Exposure to 0.05 μM aphidicolin also generated an excess of pATM s1981 foci in exposed cell cultures versus controls, demonstrating the activation of DDR DNA DSB pathways by an exogenous source of RS (Supplementary figure S2A iii). Importantly, all bulk cell lines examined exhibited a significant increase in radioresistance after exposure to low dose aphidicolin, confirming that exogenously induced RS can generate measurable radiation resistance in vitro (Figure 1F). Survival curves for DMSO versus aphidicolin treated irradiated cells were significantly different in all cell lines and dose modifying factors (DMF) at 0.37 survival (and 95% confidence intervals) were 0.83 (0.76, 0.9), 0.80 (0.68, 0.92), 0.82 (0.52, 1.12) in the E2, G7 and R10 cell lines respectively (Supplementary figure S2A iv). Surviving fractions at 2 Gy (SF2 Gy) are plotted in Supplementary figure S2A v.
Replicating GSC show altered cell cycle progression and increased replication stress in vitro
Cell cycle studies demonstrated significantly higher proportions of S phase cells in GSC than in tumor bulk populations (Figure 2A), despite GSC cultures having similar proliferation rates to tumor bulk cultures as shown in previous work (12), indicating that GSC have a prolonged S phase duration. A likely explanation is that GSC have slower DNA replication velocity than tumor bulk populations because of elevated RS.
Figure 2. Replicating GSCs show altered cell cycle phase progression and enhanced replication stress in vitro.

A Representative flow cytometry plots and analysis of S-phase populations in R10 and R15 GSC and tumor bulk cells by quantification of BrdU incorporation under basal conditions (mean +/-SEM, n = 3, * p<0.05, unpaired t-test). B Schematic of DNA fiber assay; cells were incubated sequentially with CIdU (red) then IdU (green) followed by lysis and spreading. Representative immunofluorescent images of DNA fibers obtained from E2 GSC and bulk cells. Bar charts summarize quantification of IdU and CIdU incorporation rates (replication velocities) in GSC and tumor bulk cells in E2, G7 and R15 cell lines and in E2 CD133+ and CD133- populations and G7 CD15+ and CD15- populations, (mean +/-SEM, n=3, ≥ 500 ongoing replication forks analyzed per data point, *p<0.05, unpaired t-test). C Representative immunofluorescent images showing ‘new’, ‘ongoing’, ‘stalled’ and ‘bidirectional’ replication fork structures following sequential pulse labeling with CIdU (red) and IdU (green) in E2 GSC cultures. Bar charts summarize quantification of stalled, ongoing and new replication forks (as a percentage of total number of replication structures identified) in paired GSC and bulk cultures of E2, R15 and G7 cell lines and also in E2 CD133+ and CD133- and G7 CD15+ and CD15- sorted populations. (Mean +/-SEM, unpaired t test, with approx. 1800 replication forks identified and counted for each cell line, n ≥ 3). D Schematic showing symmetric and asymmetric bidirectional DNA replication fork structures observed in DNA fiber assay. Analysis of bidirectional replication fork ratio in E2 GSC and bulk cultures and also in E2 CD133+ and CD133- sorted populations. Each point represents an individual bidirectional replication fork, with longer IdU (green) track plotted on y axis versus shorter IdU track on x axis. Plotted solid black line represents a ratio of ‘1’ (i.e. no asymmetry), whilst plotted dotted black line represents a ratio of ≥ 1.33 (i.e. asymmetry). Table shows gradient of best-fit linear regression lines (95% CI) of long IdU versus short IdU tracks in paired E2 GSC and bulk and in E2 CD133+ and CD133- populations.
We confirmed elevated RS levels in GSC using the ‘gold standard’ DNA fiber assay (Figure 2B, C, D) in which immunofluorescent staining of sequentially incorporated nucleotide analogues CIdU (red) and IdU (green) facilitates visualization of DNA replication structures and direct measurement of DNA replication velocities (Figure 2B). GSC cultures exhibited significantly slower DNA replication velocities than matched tumor bulk populations (Figure 2B), as well as higher percentages of stalled replication forks and fewer ongoing forks, all of which are consistent with increased RS (Figure 2C). GSC cultures also showed a consistent trend towards a higher percentage of new origin replication structures, however this only reached significance in the G7 cell line. To exclude the possibility that these observations were caused by GSC culture conditions, we repeated the assay utilising cell populations which were sorted using the putative GSC markers CD133 and CD15. CD133+ (GSC) and CD133- (non GSC) sorted E2 cells when cultured in identical conditions for several passages, maintained GSC and non-GSC (bulk) phenotypes respectively. Importantly, CD133+ cells exhibited reduced replication velocity, increased frequency of stalled forks and fewer ongoing forks than their CD133- counterparts. Studies in the G7 cell line examining CD15+ GSC and CD15- non-GSC cell sorted populations confirmed these findings. Further quantitative analyses of bidirectional fork replication structures in the E2 cell line supported our hypothesis. Bidirectional forks represent DNA replication arising from a single origin and proceeding in two opposing directions. In the absence of RS both forks proceed at the same velocity, leading to symmetrical green IdU tracks flanking a central red CIdU origin (Figure 2D) i.e. IdU1/IdU2 ≈ 1. E2 GSC exhibited a greater proportion of asymmetric versus symmetric bidirectional replication forks (Figure 2D) in comparison to E2 bulk cultures (asymmetry defined as >33% difference in length between bidirectional elongating IdU fibers i.e. IdU1/IdU2 ≥ 1.33 (36)). This effect was also observed in E2 CD133+ versus CD133- sorted cell populations (Figure 2D). Linear regression of long versus short track length showed significantly different gradient values for E2 GSC versus bulk cells and for E2 CD133+ versus CD133- cells (Figure 2D). Taken together our results show that RS in GSC is associated with reduced DNA replication velocity and higher rates of fork stalling.
GSC exhibit increased numbers of γ-H2AX foci, which co-localize with replication factories and RNA: DNA hybrids
Reduced DNA fork speed and other evidence of elevated RS led us to hypothesize that S phase GSC would harbor elevated numbers of DNA DSBs as a direct consequence of perturbed DNA replication. Consistent with this hypothesis, S phase GSC identified by BrdU incorporation had significantly more 53BP1 nuclear foci than tumor bulk cells (Figure 3A). γ-H2AX foci were also more numerous in S phase GSC than tumor bulk cells (Figure 3B). Furthermore, in S phase GSC cultures, γ-H2AX foci co-localized with areas of intense BrdU staining, which represent concentrations of replication forks and their associated DNA replication machinery and have been described as ‘replication factories’ (37). Co-localization of γ-H2AX and BrdU foci was significantly higher in GSC than tumor bulk cells (Figure 3C), confirming formation of DNA DSBs during aberrant DNA synthesis and providing a likely explanation for constitutive DDR activation in GSC.
Figure 3. GSCs demonstrate increased numbers of γ-H2AX foci, which co-localize with replication factories and RNA: DNA hybrids.

A-B Representative immunofluorescence images of G7 GSC and tumor bulk cells showing (A) 53BP1 and (B) γ-H2AX foci in BrdU positive cells under basal conditions, with quantification of (A) 53BP1 and (B) γ-H2AX foci per S-phase nucleus in G7 and E2 GSC and tumor bulk cells (mean +/-SEM, n = 3, *p<0.05, **p<0.01). C Representative images demonstrating co-localization of γ-H2AX foci with BrdU replication factories (BrdU foci) in G7 GSC and tumor bulk cells. Percentages of BrdU positive replication factories co-localizing with γ-H2AX foci are quantified in E2 and G7 GSC and tumor bulk cells (mean +/-SEM, n=3, *p<0.05, **p<0.01, unpaired t-test). D Mean fold change in the expression of genes across 7 GSC cultures compared to the paired tumor bulk cells associated with genes >850kb in length. Numbers of genes identified from the RNA sequencing data and total numbers of genes in the published gene dataset is shown in brackets and total numbers of up-and down regulated genes are indicated in boxes. The numbers and percentages of significantly altered (‘Sig’) genes in each dataset are shown and these genes are highlighted in red. Gene shown in blue was up regulated 24-fold. Mean fold changes across all genes are shown by red lines. Genes >850bp in length are significantly up regulated in GSC compared to paired tumor bulk population across 7 GBM cell lines (one sample t-test, *p<0.05, NS=non-significant). E Heatmap illustrating fold changes in expression of the 9 significantly up regulated genes >850bp across 7 paired cell lines. F Representative image of immunofluorescent staining for RNA: DNA hybrids using S9.6 antibody and γ-H2AX in E2 GSC. G Table of colocalization and overlap coefficients (95% CIs) for γ-H2AX versus S9.6 immunofluorescence in E2 and G7 GSC.
To explore potential mechanisms responsible for elevated RS in GSC we analyzed changes in global gene expression profile between paired GSC and tumor bulk cells derived from 7 primary GBM cell lines using high throughput RNA sequencing. We first investigated if genes associated with DNA replication and/or the cellular response to RS were responsible for elevated RS in GSC. For this purpose, expression levels of genes encoding proteins known to be enriched on nascent DNA during unperturbed replication (‘replication machinery’ genes) and under conditions of RS induced by exposure to hydroxyurea (‘HU stalled forks’ genes) from previously published lists were examined in GSC and bulk cell populations (35). Overall, no significant differences in expression of ’replication machinery’ or ‘HU stalled fork’ genes were observed between GSC and tumor bulk cells (Supplementary figure S2B i,ii). Indeed only 2 of 82 transcribed ‘replication machinery’ genes and 4 of 131 transcribed ‘HU stalled fork’ genes showed greater than 2.5 fold differential expression between GSC and bulk cells. From these data we concluded that altered expression of genes associated with nascent DNA was unlikely to be responsible for elevated RS in GSC.
Given that aphidicolin could generate radiation resistance in our non-GSC primary GBM cultures (Figure 1F) and is known to generate RNA: DNA hybrids, we next investigated the hypothesis that the RS phenotype and its accompanying DDR might be associated with replication-transcription machinery collisions with subsequent common fragile site (CFS) breakage. CFS are chromosomal loci with an increased tendency to develop DNA DSBs under conditions of RS and occur preferentially within very large genes (VLG) that are transcriptionally active (35, 38, 39). RNA sequencing data revealed that 14 out of 73 VLGs (>850 Kbp in length) demonstrated a 2.5 fold or greater expression in GSC relative to tumor bulk cells (Figure 3D), and that 9 of these genes were significantly overexpressed compared to paired bulk populations across all 7 cell lines (Figure 3D). If VLGs are defined more stringently as being greater than 1 Mbp in length, the association remained significant: expression of 5 out of 31 genes >1 Mbp was > 2.5 fold greater in GSC than bulk cells, of which 3 were significantly overexpressed across all 7 cell lines (Figure 3E). These include: deleted in colorectal carcinoma (DCC), cell adhesion molecule 2 (CADM2) and protein tyrosine phosphatase receptor type T (PTPRT); which have been shown to play important roles in the regulation of neurological development, axon guidance and synapse formation (40–42). In order to investigate the contribution of replication transcription collisions to DNA DSB generation in GSC, immunofluorescent staining for RNA: DNA hybrids (S9.6) and γ-H2AX was carried out and co-localization studies were performed. These data demonstrated significant co-localization and overlap of γ-H2AX foci with areas of intense S9.6 immunofluorescence in E2 and G7 GSC populations, suggesting a prominent role for replication transcription collisions as a source of DNA DSBs in GSC (Figure 3F, G). Consistent with these findings, a recent study by Wei et al demonstrated that long neural genes harbor recurrent DNA break clusters in neural stem/progenitor cells (20). In addition, a further study has identified intragenic DNA origin firing in highly transcribed genes with consequent replication-transcription collisions as a mechanism for oncogenic RS (43). Although much debated, neural progenitor cells have been proposed as a cell of origin for GBM (44). Therefore the description of RS induced DNA DSB formation in transcriptionally active long neural genes in neural progenitor cells and the role of intragenic origins in generating oncogenic RS are highly relevant to our own data in GSC. We propose that replication-transcription collisions due to active transcription of long neural genes in GSC is responsible for the elevated RS in GSC, resulting in generation of DNA DSBs, constitutive DDR activation and consequent therapeutic resistance.
GSC show enhanced replication stress in murine intracranial orthotopic xenografts and in human GBM tumor samples
Having observed compelling evidence of increased RS in GSC in vitro, we investigated whether this phenotype was also present in vivo. Dual immunofluorescent staining for RPA32 and the putative GSC marker Sox2 was undertaken in sections of orthotopic xenograft tumors derived from CD133+ E2 GSC, which generate highly invasive, diffuse tumors and in tumors derived from G7 GSC which form a tumour mass with an invasive front typical of human GBM (Figure 4A, B and Supplementary Figure S3A-E). Our data showed a higher MFI of RPA32 staining in high (defined as greater than median) Sox2 expressing cells relative to low (less than median) Sox 2 expressing cells, consistent with the presence of elevated RS levels in the GSC subpopulation. MFI values of Sox2 and RPA32 also showed a significant positive correlation (Figure 4A, B). Further studies in G7 GSC and CD133+ E2 xenografts confirmed increased RS in GSC, utilising alternative GSC (Olig2) and RS (PARP-1) markers (Supplementary Figure S4 A-C).
Figure 4. GSCs show enhanced replication stress in murine intracranial orthotopic xenografts and in human GBM tumor samples.

A and B Representative images (63x magnification) of immunofluorescent staining for RPA32 and Sox2 in sections from murine orthotopic intracranial xenografts derived from A E2 CD133+ cells and B G7 GSC cultures. Scatter plots showing correlation between Sox2 and RPA32 MFI, with corresponding r values (95% CI). Bar charts show RPA32 MFI quantified in Sox2 low and Sox2 high populations (defined as below and above median Sox2 MFI intensity values respectively; mean +/-SEM, unpaired t test). C Representative images (63x magnification) of immunofluorescent staining for RPA32 and Sox2 in a section from a resected human GBM tumor ‘15 1170.’ Scatter plot showing correlation between Sox2 and RPA32 MFI, with corresponding r value (95% CI). Bar chart shows RPA32 MFI quantified in Sox2 low and Sox2 high populations, (defined as above and below median Sox2 MFI values respectively; mean +/-SEM, unpaired t test) in 4 different resected human GBM specimens.
Further immunohistochemical staining for HLA, RPA32, Ki67 and γH2AX was performed in sections of xenografts derived from CD133+ E2 GSC in which the majority of HLA expressing tumor cells stained strongly positive for the GSC marker Sox2, (Supplementary Figure S3A, D). Tumour sections also exhibited widespread positivity for Ki67, RPA32 and γ-H2AX nuclear staining, indicating high levels of RS in replicating GSC in vivo.
To confirm the clinical relevance of these observations, dual immunofluorescence staining for Sox2 and RPA32 was performed in human tumor sections from four GBM patients (Figure 4C and Supplementary figure S5A-D). Consistent with our earlier xenograft studies (Figure 4A and 4B), MFI of RPA32 was significantly higher in cell populations which exhibited greater than median MFI of Sox2 (Figure 4C). This observation was reproduced using Olig2 as a GSC marker (Supplementary figure S5D). RPA32 and Sox2 expression also showed significant positive correlation in all tumors examined (Supplementary figure S5A-C).
Inhibition of the RS response in GSC reduces neurosphere formation, generates DNA DSBs and abrogates radiation resistance
Our data indicate that constitutive RS represents a promising, GSC specific therapeutic target in GBM, which is a cancer of unmet need. To validate this concept we used olaparib, a small molecule inhibitor of poly (ADP-ribose) polymerase (PARP) currently in clinical trials for GBM, and VE821, a potent and specific inhibitor of ATR (45), to target key elements of the DDR and RS responses. PARP1 facilitates restart of stalled replication forks (46) while ATR has a key role in enabling cells to tolerate RS via activation of cell cycle checkpoints, inhibition of global origin firing and stabilization of stalled replication forks. Inhibition of ATR (5 μM VE821) significantly inhibited neurosphere formation in all three GSC populations tested whereas inhibition of PARP (1 μM olaparib) had little or no effect (Figure 5A). However, addition of olaparib to VE821, (Combined ATR inhibition and PARP inhibition; ‘CAiPi’) yielded significant, supra-additive inhibition of neurosphere formation, which is a fundamental property of GSC that requires proliferation and self-renewal. Since tumor bulk cultures do not form neurospheres, cell viability assays were undertaken to enable comparison of the effects of CAiPi on paired GSC and tumor bulk cultures. Consistent with our hypothesis that RS is an integral and targetable characteristic of GSC, these populations were significantly more sensitive to CAiPi than tumor bulk cells (Figure 5B). Addition of PARPi to GSC or bulk cultures did not affect DNA replication velocities at the clinically relevant concentrations examined, whereas addition of ATRi or CAiPi reduced replication velocities in both GSC and bulk (Figure 5C). Further mechanistic studies in E2 cells showed increased induction of γ-H2AX foci and micronuclei (Figure 5C) in GSC by CAiPi, supporting the concept that higher basal RS in GSC renders them particularly vulnerable to increased DNA damage and consequent cell death when subjected to inhibition of the DDR. Furthermore, and of profound clinical relevance, clonogenic survival assays revealed that CAiPi completely abrogated the radioresistance of GSC (Figure 5D), yielding sensitizer enhancement ratios at 37% survival of between 2 and 3.6. The radiosensitizing effect of the combination was significantly greater in GSC than in bulk cells when SER 0.37 values were compared (Figure 5D). Of note, R10 GSC were not radiosensitized by olaparib alone, however combined ATR and PARP inhibition resulted in potent radiosensitization. γ-H2AX foci analyses confirmed that CAiPi generates an excess of DNA DSBs in GSC in combination with radiation, (Figure 5D iv).
Figure 5. Inhibition of RS response inhibits GSC neurosphere formation, generates DNA DSBs and abrogates GSC radiation resistance.

A Neurosphere formation by E2, G7 and R10 GSCs following 48 hour exposure to PARPi (1μM) or ATRi (5μM) alone, CAiPi or radiation (2Gy). Surviving neurosphere fraction is plotted relative to DMSO control (mean+/-SEM, n=3, *p<0.05, **p<0.01, ***p<0.001, unpaired t-test). B Cell viability of paired E2 and R10 GSC and tumor bulk cultures following 24 hour incubation with PARPi alone (1μM), incremental concentrations of ATRi alone (1, 3 and 5 μM) or CAiPi. (Mean +/-SEM, n=3, ***p<0.001 unpaired t-test). Ci Quantification of CIdU and IdU incorporation rates (replication velocities) in E2 GSC and bulk following 24 hour exposure to PARPi (1μM) or ATRi (5μM) alone or CAiPi as measured by DNA fiber assay (mean +/- SEM, n = 3, unpaired t test. ii Quantification of mean γ-H2AX foci per nuclei and micronuclei formation in E2 GSC and tumor bulk cells following 48 hour exposure to ATRi or PARPi alone or CAiPi relative to DMSO control (mean+/-SEM, n=3, **p<0.01, unpaired t test). Di Clonogenic survival curves derived from R10 GSCs following exposure to DMSO, ATRi or PARPi or CAiPi for 1 hour pre and 24 hours post ionizing radiation (0-5Gy) (mean+/SEM, n = 3). ii Clonogenic survival curve derived from R10 GSC and paired R10 bulk following treatment with DMSO or combined ATRi and PARPi with radiation. iii Quantification of radiation sensitizer enhancement ratios for 0.37 survival following combined ATRi/PARPi in E2 and R10 GSC and bulk (n≥3, mean +/- SEM). iv Quantification of median γ-H2AX foci per nucleus in E2 GSC and bulk cells following exposure to CAiPi or DMSO for 1 hour pre and 24 hours post irradiation with 2Gy or sham irradiation. (median +/- range, n = 1, *p<0.05, **p<0.01, Mann Whitney U test).
Discussion
Radiation resistance of GSC is a well-recognized yet poorly understood phenomenon, comprehension of which is vitally important to attempts to improve the therapeutic index of current therapy for GBM, since improvements in patient survival depend upon our ability to control or eradicate this tumor cell fraction. Despite characterization of up regulated DDR in cancer stem cells of different tumor types, the underlying reason for activated DDR and consequent radiation resistance in GSC has remained elusive. Given the ubiquity of this phenotype in GSC and its prevalence in cancer stem cells of other tumor types, deeper understanding of the responsible mechanisms is predicted to generate highly appealing targets for clinical therapy.
RS has previously been implicated in the evolution of GBM and other cancers, particularly with regard to oncogene-induced senescence and as an anticancer barrier in early tumorigenesis (14, 47–49). Indeed, a recent study has suggested reliance upon the BRCA1-RRM2 axis for protection from RS in GBM (50). These studies validate that RS is a general feature of GBM, and may result in activated DDR in the tumor as a whole, however do not address whether RS is of particular importance in GSC, or the role of RS in determining DDR activation in GSC and have not shown that RS is responsible for radiation resistance. RS has recently been documented in non-malignant embryonic stem cells, which display constitutively active DDR and prolonged S phase occupancy due to abnormal cell cycle progression. These features rapidly diminish upon differentiation (9). Our data provide novel insights into the importance of RS in the GSC phenotype and direct evidence that RS is responsible for the activation of DDR and subsequent radiation resistance in GSC.
Furthermore, we identify replication transcription collisions as a result of increased expression of long neural genes as a likely mechanism for RS in GSC, an observation that correlates closely with recently published studies in neural progenitor cells which demonstrate that DSB arising from replication stress are preferentially located in long neural genes (20). Indeed, several of these genes, namely DCC, CADM2 and PTPRT are significantly overexpressed across a panel of 7 GSC cultures. A further study of particular relevance to our data has recently described a novel mechanism for oncogenic RS dependent upon intragenic origin firing within highly transcribed genes (43). Taken together these data support the controversial hypothesis that GSC derive from neural stem cells and provide grounds for further studies.
Finally we show that RS responses in GSC can be specifically targeted via dual inhibition of the key DDR and RS response proteins PARP and ATR. Our data demonstrate that GSC are significantly more sensitive to RS response targeting than non-GSC because of increased DNA DSB formation in GSC. Interestingly, GSC were also sensitized to radiation by dual ATR-PARP inhibition to a significantly greater degree than non-GSC, further validating our hypothesis that the radiation resistance of GSC is highly dependent on RS. Our results also suggest the feasibility of DDR targeting agents as promising therapies for GBM, both alone and in combination with radiotherapy.
Overall, our observations elucidate for the first time the mechanism underlying DDR activation and radioresistance in GSC, support a NSC origin for GSC and identify RS response as a GSC specific therapeutic target with the potential to improve patient outcomes from GBM.
Supplementary Material
Significance.
Findings shed new light on cancer stem cell biology and reveal novel therapeutics with the potential to improve clinical outcomes by overcoming inherent radioresistance in GBM.
Acknowledgements
R Carruthers and K Strathdee are funded by a Cancer Research UK Clinician Scientist Fellowship Award (23920) awarded to R Carruthers.
R Carruthers was also funded by a Beatson Cancer Charity Clinical Research Fellow award.
E Hammond and S Ramachandran are funded by a Cancer Research UK grant (C5255/A23755) awarded to E Hammond.
Footnotes
Conflict of interests: The authors declare no potential conflicts of interest
References
- 1.Parsons DW, Jones S, Zhang X, Lin JC, Leary RJ, Angenendt P, et al. An integrated genomic analysis of human glioblastoma multiforme. Science. 2008;321(5897):1807–12. doi: 10.1126/science.1164382. [DOI] [PMC free article] [PubMed] [Google Scholar]
- 2.Ajaz M, Jefferies S, Brazil L, Watts C, Chalmers A. Current and investigational drug strategies for glioblastoma. Clin Oncol (R Coll Radiol) 2014;26(7):419–30. doi: 10.1016/j.clon.2014.03.012. [DOI] [PubMed] [Google Scholar]
- 3.Stupp R, Mason WP, van den Bent MJ, Weller M, Fisher B, Taphoorn MJ, et al. Radiotherapy plus concomitant and adjuvant temozolomide for glioblastoma. N Engl J Med. 2005;352(10):987–96. doi: 10.1056/NEJMoa043330. [DOI] [PubMed] [Google Scholar]
- 4.Bao S, Wu Q, McLendon RE, Hao Y, Shi Q, Hjelmeland AB, et al. Glioma stem cells promote radioresistance by preferential activation of the DNA damage response. Nature. 2006;444(7120):756–60. doi: 10.1038/nature05236. [DOI] [PubMed] [Google Scholar]
- 5.Chen J, Li Y, Yu TS, McKay RM, Burns DK, Kernie SG, et al. A restricted cell population propagates glioblastoma growth after chemotherapy. Nature. 2012;488(7412):522–6. doi: 10.1038/nature11287. [DOI] [PMC free article] [PubMed] [Google Scholar]
- 6.Auffinger B, Tobias AL, Han Y, Lee G, Guo D, Dey M, et al. Conversion of differentiated cancer cells into cancer stem-like cells in a glioblastoma model after primary chemotherapy. Cell Death Differ. 2014;21(7):1119–31. doi: 10.1038/cdd.2014.31. [DOI] [PMC free article] [PubMed] [Google Scholar]
- 7.Eyler CE, Rich JN. Survival of the fittest: cancer stem cells in therapeutic resistance and angiogenesis. J Clin Oncol. 2008;26(17):2839–45. doi: 10.1200/JCO.2007.15.1829. [DOI] [PMC free article] [PubMed] [Google Scholar]
- 8.Desai A, Webb B, Gerson SL. CD133+ cells contribute to radioresistance via altered regulation of DNA repair genes in human lung cancer cells. Radiother Oncol. 2014;110(3):538–45. doi: 10.1016/j.radonc.2013.10.040. [DOI] [PMC free article] [PubMed] [Google Scholar]
- 9.Ahuja AK, Jodkowska K, Teloni F, Bizard AH, Zellweger R, Herrador R, et al. A short G1 phase imposes constitutive replication stress and fork remodelling in mouse embryonic stem cells. Nat Commun. 2016;7 doi: 10.1038/ncomms10660. 10660. [DOI] [PMC free article] [PubMed] [Google Scholar]
- 10.Venere M, Hamerlik P, Wu Q, Rasmussen RD, Song LA, Vasanji A, et al. Therapeutic targeting of constitutive PARP activation compromises stem cell phenotype and survival of glioblastoma-initiating cells. Cell Death Differ. 2014;21(2):258–69. doi: 10.1038/cdd.2013.136. [DOI] [PMC free article] [PubMed] [Google Scholar]
- 11.Diehn M, Cho RW, Lobo NA, Kalisky T, Dorie MJ, Kulp AN, et al. Association of reactive oxygen species levels and radioresistance in cancer stem cells. Nature. 2009;458(7239):780–3. doi: 10.1038/nature07733. [DOI] [PMC free article] [PubMed] [Google Scholar]
- 12.Ahmed SU, Carruthers R, Gilmour L, Yildirim S, Watts C, Chalmers AJ. Selective Inhibition of Parallel DNA Damage Response Pathways Optimizes Radiosensitization of Glioblastoma Stem-like Cells. Cancer Res. 2015;75(20):4416–28. doi: 10.1158/0008-5472.CAN-14-3790. [DOI] [PubMed] [Google Scholar]
- 13.Biddlestone-Thorpe L, Sajjad M, Rosenberg E, Beckta JM, Valerie NC, Tokarz M, et al. ATM kinase inhibition preferentially sensitizes p53-mutant glioma to ionizing radiation. Clin Cancer Res. 2013;19(12):3189–200. doi: 10.1158/1078-0432.CCR-12-3408. [DOI] [PMC free article] [PubMed] [Google Scholar]
- 14.Bartkova J, Hamerlik P, Stockhausen MT, Ehrmann J, Hlobilkova A, Laursen H, et al. Replication stress and oxidative damage contribute to aberrant constitutive activation of DNA damage signalling in human gliomas. Oncogene. 2010;29(36):5095–102. doi: 10.1038/onc.2010.249. [DOI] [PubMed] [Google Scholar]
- 15.Olcina MM, Foskolou IP, Anbalagan S, Senra JM, Pires IM, Jiang Y, et al. Replication stress and chromatin context link ATM activation to a role in DNA replication. Mol Cell. 2013;52(5):758–66. doi: 10.1016/j.molcel.2013.10.019. [DOI] [PMC free article] [PubMed] [Google Scholar]
- 16.Zeman MK, Cimprich KA. Causes and consequences of replication stress. Nat Cell Biol. 2014;16(1):2–9. doi: 10.1038/ncb2897. [DOI] [PMC free article] [PubMed] [Google Scholar]
- 17.Foskolou IP, Jorgensen C, Leszczynska KB, Olcina MM, Tarhonskaya H, Haisma B, et al. Ribonucleotide Reductase Requires Subunit Switching in Hypoxia to Maintain DNA Replication. Mol Cell. 2017;66(2):206–20 e9. doi: 10.1016/j.molcel.2017.03.005. [DOI] [PMC free article] [PubMed] [Google Scholar]
- 18.Kim JK, Jeon HM, Jeon HY, Oh SY, Kim EJ, Jin X, et al. Conversion of glioma cells to glioma stem-like cells by angiocrine factors. Biochem Biophys Res Commun. 2017 doi: 10.1016/j.bbrc.2017.02.076. [DOI] [PubMed] [Google Scholar]
- 19.Alcantara Llaguno SR, Wang Z, Sun D, Chen J, Xu J, Kim E, et al. Adult Lineage-Restricted CNS Progenitors Specify Distinct Glioblastoma Subtypes. Cancer Cell. 2015;28(4):429–40. doi: 10.1016/j.ccell.2015.09.007. [DOI] [PMC free article] [PubMed] [Google Scholar]
- 20.Wei PC, Chang AN, Kao J, Du Z, Meyers RM, Alt FW, et al. Long Neural Genes Harbor Recurrent DNA Break Clusters in Neural Stem/Progenitor Cells. Cell. 2016;164(4):644–55. doi: 10.1016/j.cell.2015.12.039. [DOI] [PMC free article] [PubMed] [Google Scholar]
- 21.Fael Al-Mayhani TM, Ball SL, Zhao JW, Fawcett J, Ichimura K, Collins PV, et al. An efficient method for derivation and propagation of glioblastoma cell lines that conserves the molecular profile of their original tumours. Journal of neuroscience methods. 2009;176(2):192–9. doi: 10.1016/j.jneumeth.2008.07.022. [DOI] [PubMed] [Google Scholar]
- 22.Gomez-Roman N, Stevenson K, Gilmour L, Hamilton G, Chalmers AJ. A novel 3D human glioblastoma cell culture system for modeling drug and radiation responses. Neuro-oncology. 2016 doi: 10.1093/neuonc/now164. [DOI] [PMC free article] [PubMed] [Google Scholar]
- 23.Carruthers R, Ahmed SU, Strathdee K, Gomez-Roman N, Amoah-Buahin E, Watts C, et al. Abrogation of radioresistance in glioblastoma stem-like cells by inhibition of ATM kinase. Mol Oncol. 2015;9(1):192–203. doi: 10.1016/j.molonc.2014.08.003. [DOI] [PMC free article] [PubMed] [Google Scholar]
- 24.Mirzoeva OK, Petrini JHJ. DNA damage-dependent nuclear dynamics of the Mre11 complex. Mol Cell Biol. 2001;21(1):281–8. doi: 10.1128/MCB.21.1.281-288.2001. [DOI] [PMC free article] [PubMed] [Google Scholar]
- 25.Church DM, Schneider VA, Graves T, Auger K, Cunningham F, Bouk N, et al. Modernizing reference genome assemblies. PLoS biology. 2011;9(7):e1001091. doi: 10.1371/journal.pbio.1001091. [DOI] [PMC free article] [PubMed] [Google Scholar]
- 26.Kim D, Pertea G, Trapnell C, Pimentel H, Kelley R, Salzberg SL. TopHat2: accurate alignment of transcriptomes in the presence of insertions, deletions and gene fusions. Genome biology. 2013;14(4):R36. doi: 10.1186/gb-2013-14-4-r36. [DOI] [PMC free article] [PubMed] [Google Scholar]
- 27.Langmead B, Trapnell C, Pop M, Salzberg SL. Ultrafast and memory-efficient alignment of short DNA sequences to the human genome. Genome biology. 2009;10(3):R25. doi: 10.1186/gb-2009-10-3-r25. [DOI] [PMC free article] [PubMed] [Google Scholar]
- 28.Anders S, Huber W. Differential expression analysis for sequence count data. Genome biology. 2010;11(10):R106. doi: 10.1186/gb-2010-11-10-r106. [DOI] [PMC free article] [PubMed] [Google Scholar]
- 29.Mannino M, Gomez-Roman N, Hochegger H, Chalmers AJ. Differential sensitivity of Glioma stem cells to Aurora kinase A inhibitors: implications for stem cell mitosis and centrosome dynamics. Stem Cell Res. 2014;13(1):135–43. doi: 10.1016/j.scr.2014.05.001. [DOI] [PMC free article] [PubMed] [Google Scholar]
- 30.Zou L, Elledge SJ. Sensing DNA damage through ATRIP recognition of RPA-ssDNA complexes. Science. 2003;300(5625):1542–8. doi: 10.1126/science.1083430. [DOI] [PubMed] [Google Scholar]
- 31.Liu S, Opiyo SO, Manthey K, Glanzer JG, Ashley AK, Amerin C, et al. Distinct roles for DNA-PK, ATM and ATR in RPA phosphorylation and checkpoint activation in response to replication stress. Nucleic Acids Res. 2012;40(21):10780–94. doi: 10.1093/nar/gks849. [DOI] [PMC free article] [PubMed] [Google Scholar]
- 32.Gagou ME, Zuazua-Villar P, Meuth M. Enhanced H2AX phosphorylation, DNA replication fork arrest, and cell death in the absence of Chk1. Mol Biol Cell. 2010;21(5):739–52. doi: 10.1091/mbc.E09-07-0618. [DOI] [PMC free article] [PubMed] [Google Scholar]
- 33.Marti TM, Hefner E, Feeney L, Natale V, Cleaver JE. H2AX phosphorylation within the G1 phase after UV irradiation depends on nucleotide excision repair and not DNA double-strand breaks. Proc Natl Acad Sci U S A. 2006;103(26):9891–6. doi: 10.1073/pnas.0603779103. [DOI] [PMC free article] [PubMed] [Google Scholar]
- 34.Vesela E, Chroma K, Turi Z, Mistrik M. Common Chemical Inductors of Replication Stress: Focus on Cell-Based Studies. Biomolecules. 2017;7(1) doi: 10.3390/biom7010019. [DOI] [PMC free article] [PubMed] [Google Scholar]
- 35.Helmrich A, Ballarino M, Tora L. Collisions between replication and transcription complexes cause common fragile site instability at the longest human genes. Mol Cell. 2011;44(6):966–77. doi: 10.1016/j.molcel.2011.10.013. [DOI] [PubMed] [Google Scholar]
- 36.Zhang Y, Huang L, Fu H, Smith OK, Lin CM, Utani K, et al. A replicator-specific binding protein essential for site-specific initiation of DNA replication in mammalian cells. Nat Commun. 2016;7 doi: 10.1038/ncomms11748. 11748. [DOI] [PMC free article] [PubMed] [Google Scholar]
- 37.Meister P, Taddei A, Ponti A, Baldacci G, Gasser SM. Replication foci dynamics: replication patterns are modulated by S-phase checkpoint kinases in fission yeast. EMBO J. 2007;26(5):1315–26. doi: 10.1038/sj.emboj.7601538. [DOI] [PMC free article] [PubMed] [Google Scholar]
- 38.Smith DI, Zhu Y, McAvoy S, Kuhn R. Common fragile sites, extremely large genes, neural development and cancer. Cancer Lett. 2006;232(1):48–57. doi: 10.1016/j.canlet.2005.06.049. [DOI] [PubMed] [Google Scholar]
- 39.Helmrich A, Stout-Weider K, Hermann K, Schrock E, Heiden T. Common fragile sites are conserved features of human and mouse chromosomes and relate to large active genes. Genome Res. 2006;16(10):1222–30. doi: 10.1101/gr.5335506. [DOI] [PMC free article] [PubMed] [Google Scholar]
- 40.Xu B, Goldman JS, Rymar VV, Forget C, Lo PS, Bull SJ, et al. Critical roles for the netrin receptor deleted in colorectal cancer in dopaminergic neuronal precursor migration, axon guidance, and axon arborization. Neuroscience. 2010;169(2):932–49. doi: 10.1016/j.neuroscience.2010.05.025. [DOI] [PubMed] [Google Scholar]
- 41.Lim SH, Kwon SK, Lee MK, Moon J, Jeong DG, Park E, et al. Synapse formation regulated by protein tyrosine phosphatase receptor T through interaction with cell adhesion molecules and Fyn. EMBO J. 2009;28(22):3564–78. doi: 10.1038/emboj.2009.289. [DOI] [PMC free article] [PubMed] [Google Scholar]
- 42.Frei JA, Andermatt I, Gesemann M, Stoeckli ET. The SynCAM synaptic cell adhesion molecules are involved in sensory axon pathfinding by regulating axon-axon contacts. J Cell Sci. 2014;127(Pt 24):5288–302. doi: 10.1242/jcs.157032. [DOI] [PubMed] [Google Scholar]
- 43.Macheret M, Halazonetis TD. Intragenic origins due to short G1 phases underlie oncogene-induced DNA replication stress. Nature. 2018;555(7694):112–6. doi: 10.1038/nature25507. [DOI] [PMC free article] [PubMed] [Google Scholar]
- 44.Modrek AS, Bayin NS, Placantonakis DG. Brain stem cells as the cell of origin in glioma. World J Stem Cells. 2014;6(1):43–52. doi: 10.4252/wjsc.v6.i1.43. [DOI] [PMC free article] [PubMed] [Google Scholar]
- 45.Reaper PM, Griffiths MR, Long JM, Charrier JD, Maccormick S, Charlton PA, et al. Selective killing of ATM- or p53-deficient cancer cells through inhibition of ATR. Nat Chem Biol. 2011;7(7):428–30. doi: 10.1038/nchembio.573. [DOI] [PubMed] [Google Scholar]
- 46.Bryant HE, Petermann E, Schultz N, Jemth AS, Loseva O, Issaeva N, et al. PARP is activated at stalled forks to mediate Mre11-dependent replication restart and recombination. EMBO J. 2009;28(17):2601–15. doi: 10.1038/emboj.2009.206. [DOI] [PMC free article] [PubMed] [Google Scholar]
- 47.Bartkova J, Horejsi Z, Koed K, Kramer A, Tort F, Zieger K, et al. DNA damage response as a candidate anti-cancer barrier in early human tumorigenesis. Nature. 2005;434(7035):864–70. doi: 10.1038/nature03482. [DOI] [PubMed] [Google Scholar]
- 48.Di Micco R, Fumagalli M, Cicalese A, Piccinin S, Gasparini P, Luise C, et al. Oncogene-induced senescence is a DNA damage response triggered by DNA hyper-replication. Nature. 2006;444(7119):638–42. doi: 10.1038/nature05327. [DOI] [PubMed] [Google Scholar]
- 49.Bartkova J, Rezaei N, Liontos M, Karakaidos P, Kletsas D, Issaeva N, et al. Oncogene-induced senescence is part of the tumorigenesis barrier imposed by DNA damage checkpoints. Nature. 2006;444(7119):633–7. doi: 10.1038/nature05268. [DOI] [PubMed] [Google Scholar]
- 50.Rasmussen RD, Gajjar MK, Tuckova L, Jensen KE, Maya-Mendoza A, Holst CB, et al. BRCA1-regulated RRM2 expression protects glioblastoma cells from endogenous replication stress and promotes tumorigenicity. Nat Commun. 2016;7 doi: 10.1038/ncomms13398. 13398. [DOI] [PMC free article] [PubMed] [Google Scholar]
Associated Data
This section collects any data citations, data availability statements, or supplementary materials included in this article.