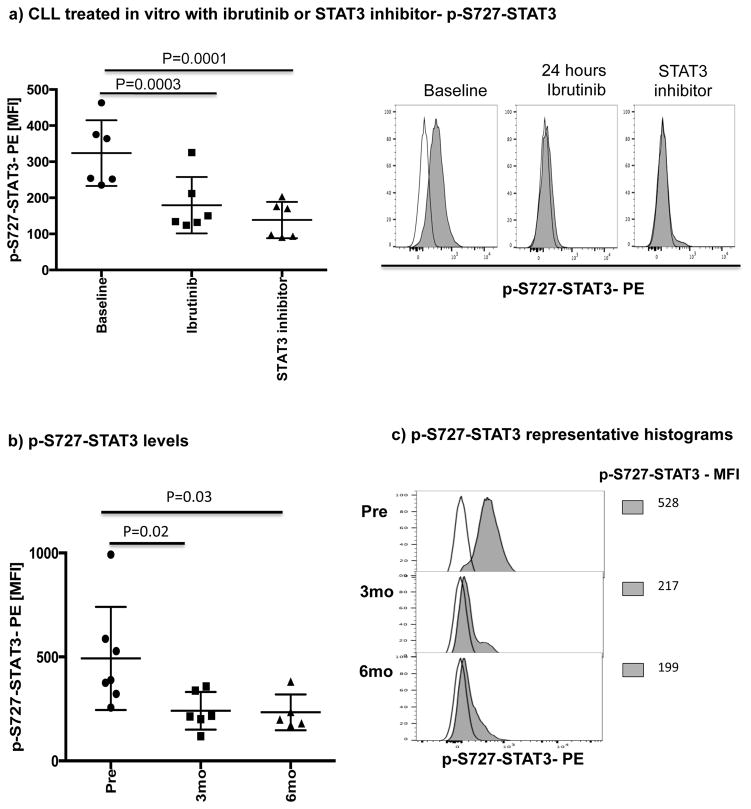
Figure 3. Ibrutinib inhibits STAT3 phosphorylation both in vitro and in vivo.
PBMCs were stained for viability using Live/Dead aqua, CD19 and CD5 and then for the phosphorylated serine STAT3 (p-S727-STAT3) using the Perfix Expose kit. The level of p-STAT3 in CD19+ CLL cells was measured by mean fluorescence intensity (MFI). (a) PBMCs from treatment-naïve CLL patients were treated with ibrutinib (1 μM) or a STAT3 inhibitor (0.05 μM) for 2 days and then stained for viability, CD19, CD5 and p-S727-STAT3 (n=6). Representative flow plots are also presented. The white histogram represents the isotype control while the gray histogram shows p-S727-STAT3 expression in CLL cells at baseline and after 48 hours of treatment with ibrutinib or a STAT3 inhibitor. (b) The level of p-S727-STAT3 in CD19+ CLL cells in samples collected pre, and at 3 and 6 months post ibrutinib therapy. (c) Representative FACS plot showing p-S727-STAT3 reduction during ibrutinib therapy are presented. The white histogram represents the isotype control while the gray histogram shows p-S727-STAT3 expression in CLL cells pre, at 3 and 6 months post ibrutinib therapy.

