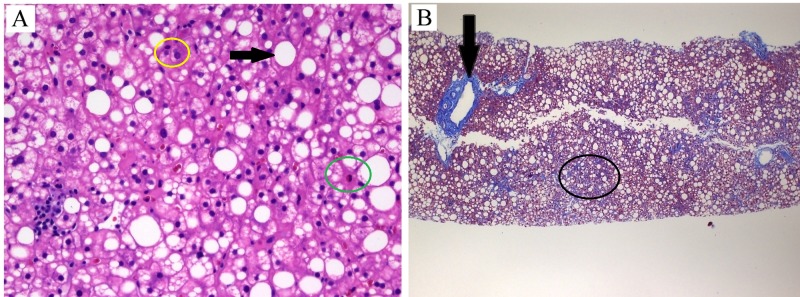
Figure 1. Histopathologic findings.
Panel A is a high power (40x) view of hematoxylin and eosin stain that shows hepatic steatosis (black arrow) with lymphocytic (yellow circle) and rare neutrophilic (green circle) inflammation. Panel B is a low power (4x) view of trichrome stain showing periportal (black arrow) and perisinusoidal fibrosis (black circle). Courtesy of William A. Kanner M.D., Department of Pathology, University of Virginia, Charlottesville, VA.

