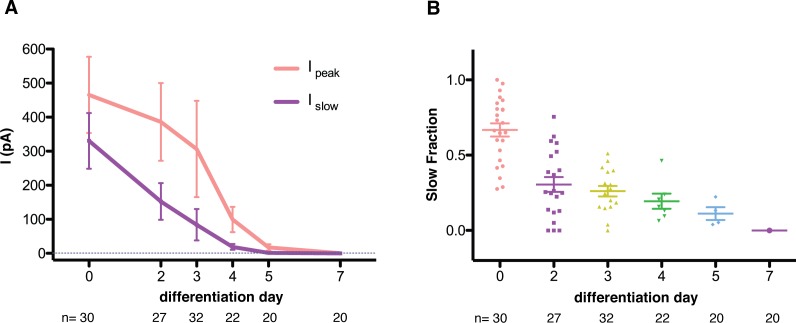
Figure 4. Quantification of mechanosensitive currents throughout the differentiation.
(A) The evolution of the peak- and slow- currents throughout the differentiations (three independent differentiations were performed, and data were pooled). Peak-current is the maximum mechanosensitive current achieved by the stimulation. Slow-current is the mechanosensitive current measured 75 ms after the beginning of the stimulation. (B) The evolution of the slow fraction, defined as the ratio between slow and peak current, throughout the differentiation. The mechanosensitive current becomes smaller and faster as the differentiation progresses. Below each dataset is the total number of cells assessed at each stage.

