Abstract
Uterine leiomyomas (ULM) are histologically and molecularly heterogeneous and clinically they grow at vastly different rates. Several driver gene mutations have been identified in ULM, including MED12 mutations, HMGA2 overexpression, and biallelic FH inactivation. ULM with different driver mutant genes may use different molecular pathways, but currently no clear correlation between gene mutations and growth related pathways has been established. To better define this relationship, we collected ULM with MED12 (n=25), HMGA2 (n=15) and FH (n=27) mutations and examined the sex steroid hormone, cell cycle, and AKT pathway genes by immunohistochemistry. While ER and PR were highly expressed in all types of ULM, FH ULM showed lower ER expression and higher PR expression. HMGA2 tumors had significantly higher levels of AKT signaling and mitogenic activity than other ULM types. HMGA2 activated AKT signaling through upregulation of IGFB2P. Silencing HMGA2 in ULM cells resulted in downregulation of AKT and upregulation of p16 and p21, which eventually led to cell senescence. HMGA2 overexpression in ULM is not only related to tumor development but also plays a role in controlling cellular proliferation through the AKT pathway.
Keywords: Leiomyoma, mutations, HMGA2, MED12, FH, pathway analysis, cellular senescence
1. Introduction
Uterine leiomyomas (ULM) are an important public health problem due to the high incidence among women and the high rate of surgical intervention with myomectomy or hysterectomy1. Up to 70% of women develop ULM during their lifetime2 and current medical therapies show no significant long term benefits, but carry significant side effects. ULM are a histologically and molecularly heterogeneous group of tumors and grow at vastly different rates.3 Yet the pathogenesis of ULM leading to the varied histology and growth behavior is largely unknown. In recent studies, several driver gene mutations have been identified in ULM, including MED12 mutations in exon 2 in 60-70% of cases, HMGA2 overexpression in 10-15% of cases, and biallelic FH inactivation in rare cases4, 5. Global gene expression analysis indicates that different mutant genes in ULM may target different molecular pathways5 and each mutation type may theoretically determine growth behavior, but these theories have not yet been proven. Notably, a uterus with multiple ULM can show somatic mutations of different genes and each given tumor only acquires a single driver gene mutation, since the mutations are mutually exclusive4, 6, 7. Thus, ULM consist of a group of genetically heterogeneous tumors with similar histogenesis.
Such genetic differences in ULM due to different driver gene mutations may determine their histological and molecular heterogeneity and further influence tumor growth rates. However, histology and molecular pathway correlation with these driver gene mutations has not been established or characterized. HMGA2 overexpression in ULM is caused by a translocation between 12q and 14q8 and the early studies showed that ULM with HMGA2 overexpression tend to be larger and grow faster than those without HMGA2 alterations5, 9, 10. HMGA2 ULM cannot be differentiated histologically from other ULM, but it is common in a variant of ULM defined as intravascular leiomyomatosis11. Unfortunately, while many oncogenic functions of HMGA2 in malignant tumors are characterized12, little is known about how HMGA2 causes and promotes ULM development and growth. MED12 mutations are the most common somatic mutations in ULM13. MED12 is essential for activating CDK8 and modulates mediator-polymerase II interactions for transcription initiation14. Growth of MED12 ULM may require and recruitment of prominent myoma-associated fibroblasts15. FH ULM exhibit characteristic histologic features in leiomyomas of bizarre nuclei16, 17. Further investigation of the molecular and histological difference in ULM with different driver gene mutations may assist in understanding biological and medical significance and aid in clinical management.
Since sex steroid hormones, cell cycle and AKT signaling are prevalent pathways for ULM growth, we aimed in this study to examine these common functional pathways in ULM with different driver mutations. We collected ULM with MED12, HMGA2 and FH mutations and examined the selected markers by immunohistochemistry. The functional correlation between AKT and HMGA2 was further analyzed in primary cultures of ULM.
2. MATERIALS AND METHODS
2.1 Case selection
Human myometrial and leiomyoma tissues were collected from premenopausal women undergoing hysterectomy at the Northwestern University. The use of human tissue specimens was approved by the Institutional Review Board for Human Research at Northwestern University. Fresh frozen and/or formalin-fixed and paraffin-embedded tumor, and myometrial tissues were used. The genotypes of the selected ULM with MED12 mutations, HMGA2 overexpression and biallelic FH inactivation have been reported in previous studies6, 16.
2.2 Primary cell culture for ULM
Subjects were only included in the study if they were not taking hormonal contraceptives or gonadotropin-releasing hormone agonists/antagonists for at least 3 months. Informed consent was obtained from all the patients participating in the study. After tissue was collected, primary myometrial and leiomyoma cells were isolated and cultured. Primary cells were cultivated in Dulbecco’s modified Eagle’s medium/nutrient Ham’s Mixture F-12 (DMEM-F12) 1:1 containing 10% fetal bovine serum (FBS) and 1% penicillin-streptomycin at 37°C and 5% CO2 atmosphere. Primary ULM cell cultures were maintained in Smooth Muscle Growth Medium-2 (SmGM™-2 medium) (Lonza) to avoid loss of myoma cells.
2.3 Senescence-associated β-galactosidase (SA-β-gal) staining
The cells were treated with MK2206 at 5μM (Merck Sharp & Dohme Corp.) Then the cells were fixed with 2% formaldehyde plus 0.2% glutaraldehyde and were stained with β-galactosidase staining solution (citric acid/sodium phosphate solution, potassium ferrocyanide, potassium ferricyanide, X-gal, pH6). They were incubated at 37°C overnight in a dry incubator and the reactions were terminated when the cells were stained blue-green, as visualized under an inverted bright-field microscope. The cells were also stained with DAPI (4′, 6-Diamidino-2-Phenylindole, Dihydrochloride) to show the nucleus. Three images were taken randomly under each treatment condition and then the percentage of the cells that were positive for β-galactosidase was calculated.
2.4 SDS-PAGE and Western blotting
Protein lysates were extracted from myometrial and leiomyoma cells using RIPA lysis and extraction buffer with protease and phosphatase inhibitors (Thermo Fisher Scientific). The protein concentration was determined using BCA Protein Assay kit (Thermo Fisher Scientific). Equal amounts of proteins were subjected to SDS-PAGE and subsequently transferred to polyvinylidene difluoride (PVDF) membranes. Immunoblotting was performed using the following primary antibodies: p21 Waf1/Cip1 (12D1) Rabbit mAb (Cell Signaling Technology), Human p16INK4a/CDKN2A Antibody (Fisher Scientific), pAKT and AKT (Cell Signaling Technology), HMGA2 (Biocheck Inc), and β-actin Antibody (Cell Signaling Technology). Secondary antibodies were horseradish peroxidase (HRP)-labeled anti-mouse (7076S, Cell Signaling Technology), anti-rabbit (7074S, Cell Signaling Technology), or anti-goat (HAF109, Fisher Scientific). Chemiluminescence was detected by adding a chemiluminescent HRP substrate (Thermo Fisher Scientific) and measured with a Fujifilm LAS-3000 Imager.
2.5 RNA isolation and RT-PCR
RNA was isolated from uterine fibroid cells using Rneasy Mini Kit (Qiagen) and reverse-transcribed with M-MLV Reverse Transcriptase (Clontech) following the manufacturer’s instructions. Quantitative RT-PCR was performed using PowerUp™ SYBR® Green Master Mix (Life Technologies) on an Applied Biosystems® Real-Time PCR Instrument. HMGA2 primers were: Forward 5′-TCCGGTGTTGATGGTGGCAG-3′; Reverse 5′-CTTGGCCGTTTTTCTCCAGTG-3′. GAPDH was used as the housekeeping gene, and relative mRNA levels were calculated using the 2−ΔΔCt method. Each data point is the average of three replicates.
2.6 HMGA2 siRNA Transient Transfection
Cells were grown to 60%-80% confluency at the day of transfection, and then were either transfected with control siRNA (Stealth RNAi negative control duplexes, ThermoFisher Scientific) or HMGA2 siRNA (Stealth siRNA, HSS111974, ThermoFisher Scientific) according to the manufacturer’s instruction using Lipofectamine RNAiMAX (ThermoFisher Scientific), as described previously in detail12.
2.7 Tissue microarrays
Formalin-fixed paraffin-embedded (FFPE) tissue blocks with the most accurate morphological features were selected for each case and 2 mm2 tissue cores were taken to create tissue microarrays (TMAs). The TMAs were sectioned at 4 μm. The first and last slides were stained with hematoxylin and eosin (H&E) for quality assurance to confirm the correct tumor types and the presence of viable tumor tissue.
2.8 Immunohistochemistry
The analytical markers for immunohistochemical (IHC) analysis included steroid hormone receptors (ER and PR), cell cycle marker (p16), and cell proliferative marker (Ki-67), and AKT pathway markers (pAKT, pS6, IGF2BP2). The driver gene markers of FH, HMGA2 and MED12 were also included in examining the selected cases. All immunohistochemical staining procedures were performed on a Ventana Nexus automated system as described previously6. All information regarding selected antibodies is summarized in Supplementary Table 1. The percent and intensity of each staining were evaluated by two pathologists. The intensity was scored as negative (0), weak (1+), moderate (2+), or strong (3+) and the percentage of positive tumor cells was scored from 0% to 100%. The results were then semi-quantitatively analyzed.
2.9 Statistical analysis
GraphPad Prism software was used for statistical analysis and IHC data were presented as median and ranges for the entire tumor samples and the control myometrium. Other data were presented as mean and standard deviation. Student’s t-test or one way Anova analysis was used to determine statistical significance. A p value less than 0.05 was considered statistically significant.
3. RESULTS
3.1 Selection of ULM with MED12, HMGA2 and FH mutations
Previously, 178 ULM cases were tested for mutational analysis of MED12 and HMGA26. MED12 exon 2 mutations were detected by Sanger sequencing and HMGA2 overexpression was identified by immunohistochemistry. MED12 mutations were found in 75.4% (134/178) ULM, HMGA2 overexpression in 10.1% of the cases (18/178). We also examined FH expression by immunohistochemistry and loss of FH expression was detected in 1.1% of the cases (2/178). In all 178 cases, the three gene mutations were mutually exclusive. After genotype was determined by gene mutation analysis (MED12 exon 2) and immunohistochemistry (HMGA2 overexpression and loss of FH), the cases from each of three gene mutations were selected for this study. We then selected 25 ULM with MED12 mutations, and 15 ULM with HMGA2 overexpression for this study. We also selected 27 ULM with loss of FH in our collection of leiomyoma with bizarre nuclei16. Histologically, MED12 ULM showed varied cellularity of smooth muscle cells with prominent extracellular matrix and low vasculature (Figure 1; H/E). HMGA2 ULM presented with increased cellularity4 and vasculature. FH ULM have their characteristic large and small round/oval nuclei, prominent nucleoli and dilated vessels (Figure 1). The demographic information for our patients is summarized in Table 1. The tumor size and patient age differed significantly among the three gene mutations. Patients with FH ULM were significantly younger than those with MED12 and HMGA2 ULM and HMGA2 ULM had significantly larger tumors than the other two.
Figure 1.
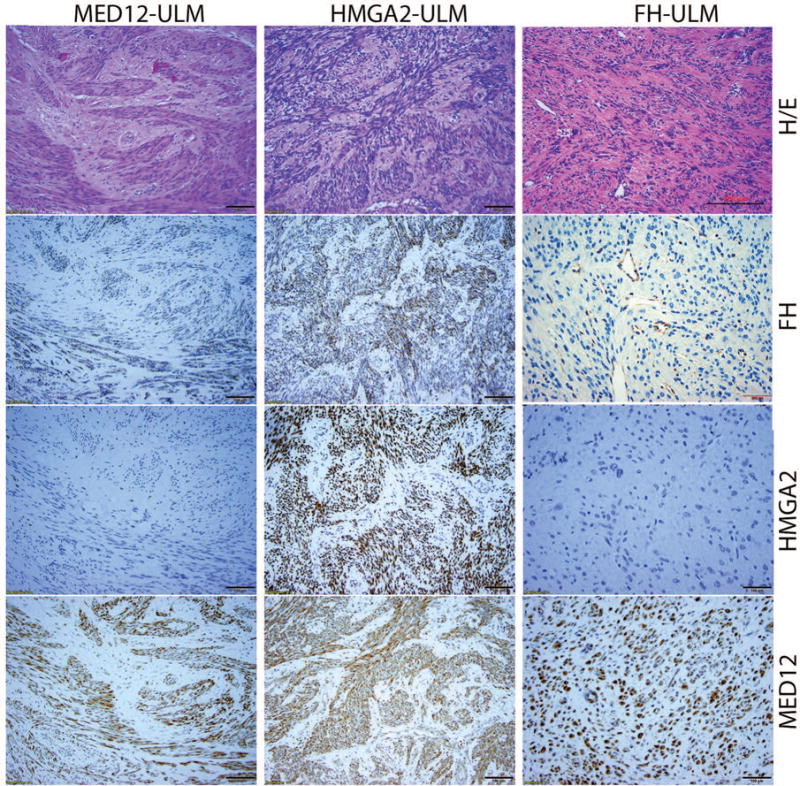
Photomicrographs illustrate examples of ULM with MED12 (MED12-ULM), HMGA2 (HMGA2-ULM) and FH (FH-ULM) mutation/alteration. Tumor sections were examined by histology (H/E) and immunohistochemistry for FH, HMGA2 and MED12 (amplification ×20).
Table 1.
Patient demographics
| MED12 | HMGA2 | FH | p-value* | ||
|---|---|---|---|---|---|
| No. Cases | 25 | 15 | 27 | 0.0213 | |
| Age (years) | Mean±sem** | 46.1±6.2 | 45.6±5.7 | 37.7±1.7 | 0.0191 |
| Tumor size (cm) | Mean±sem | 6.7±0.8 | 11.2±2.4 | 8.5±0.8 |
One way Anova analysis.
sem: standard error of the mean
3.2 Sex steroid hormone expression in different types of ULM
The relative expression of ER and PR were scored semi-quantitatively using percentage and intensity of staining. In all myometrial controls, ER and PR expression was high with a median score of 70% (95% of CI in 58-74%; Table 2). Overall, ULM also showed high levels of ER and PR expression with a range of 45-80% staining. No significant difference between myometrial controls and ULM was noted. When ER and PR expression was reviewed based on different gene mutations, FH ULM had significantly lower ER expression (45%) and bordering higher PR expression (84%) than both the other ULM subtypes and the myometrial controls (p=0.0049, p=0.058, respectively, Table 2, Figure 2). In fact, over 25% of FH ULM showed no ER expression (Figure 2A). In contrast, HMGA2 and MED12 ULM showed no significant difference in ER or PR expression and no difference when compared with myometrial controls (p>0.05). Similar trends were noted when comparing the staining intensity of ER and PR among the three variants (Table 2). These findings suggest that two of the molecular ULM subtypes maintain high levels of ER and PR expression. In contrast, the inverse association of ER and PR expression in FH ULM is noted with underlying mechanisms yet to be characterized.
Table 2.
IHC expression analysis of selected genes among three molecular subtypes of ULM
| No. cases | MED12 ULM | HMGA2 ULM | FH ULM | MM Controls | p-value* | |
|---|---|---|---|---|---|---|
|
| ||||||
| 25 | 15 | 27 | 40 | |||
| ER-% | Median (low-high 95% CI) | 60 (50.4–60.9) | 80.0 (62.8–85.2) | 45.0 (29.8–55.5) | 70.0 (58.1–74.0) | 0.0007 |
| ER-I | Median (low-high 95% CI) | 2.0 (1.76–2.24) | 3.0 (2.11–2.82) | 1.0 (0.61–1.30) | 2.0 (1.88–2.43) | 0.0001 |
| PR-% | Median (low-high 95% CI) | 70.0 (51.2–71.2) | 80.0 (56.3–81.0) | 90.0 (73.9–89.9) | 75.0 (66.0–78.0) | 0.0056 |
| PR-I | Median (low-high 95% CI) | 2.0 (1.84–2.56) | 3.0 (2.18–2.89) | 3.0 (2.59–3.03) | 2.0 (2.04–2.46) | 0.0044 |
| IGF2BP2-I | Median (low-high 95% CI) | 1.0 (0.31–0.92 | 3.0 (1.99–2.81) | 1.0 (0.72––1.28) | 1.0 (0.58–0.92) | 0.0001 |
| pAKT-I | Median (low-high 95% CI) | 1.0 (1.20–1.66) | 3.0 (2.25–2.95) | 1.0 (1.26–1.67) | 2.0 (1.48–1.92) | 0.0001 |
| pS6-I | Median (low-high 95% CI) | 1.0 (1.23–1.68) | 3.0 (2.32–2.88) | 2.0 (1.35–1.77) | 2.0 (1.37–1.84) | 0.0001 |
| Ki-67-% | Median (low-high 95% CI) | 2.0 (1.98–4.50) | 10.0 (5.56–14.04) | 1.0 (0.23–2.37) | 1.0 (0.57–2.01) | 0.0001 |
| P16-% | Median (low-high 95% CI) | 5.0 (4.47–12.25) | 1.0 (0.01–3.09) | 5.0 (4.90–17.10) | 1.0 (0.65–2.84) | 0.0060 |
One way Anova analysis.
Figure 2.
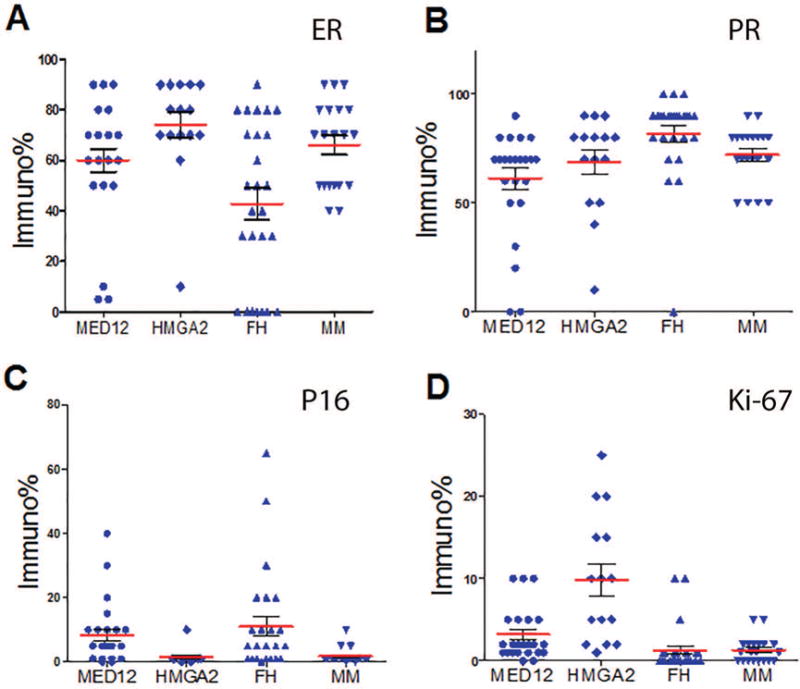
Expression analysis of ER, PR, P16 and Ki-67 by immunohistochemistry in ULM with three different driver gene mutations/alteration. Dot plot illustration of estrogen receptor (ER, A), progesterone receptor (PR, B), P16 (C) Ki-67 (D) expression by immunopercentage in ULM with MED12 mutation (rounded dot), HMGA2 overexpression (diagonal dot), loss of fumarate hydratase (FH) (upward triangle dot) and myometrium (downward triangle dot). Mean expression levels (Red line) and standard errors (short black line) for each tumor type are shown.
3.3 Expression analysis of p16 and Ki-67
P16 is a major cell cycle regulator. In malignant tumors including leiomyosarcoma, diffuse p16 expression reflects loss of function due to an RB defect in the negative feedback loop18. In normal or benign tumors like nevi and ULM, p16 expression serves as a cell cycle inhibitor driving cells into senescence19, 20. In order to determine whether different driver gene mutations influenced tumor growth and arrest through p16, IHC staining for p16 was done in ULM. Overall ULM showed very low levels of p16 expression ranging from 1-5% p16 immunoreactivity. HMGA2 ULM had almost undetectable p16 expression (0-3%) in comparison to MED12 ULM (4.5-12.3%) and FH ULM (4.9-17.1%), which was statistically significant (p<0.05%, Table 2, Figure 2C). This finding also correlated with a much higher proliferation index (Ki67) ranging from 5.6-14% in HMGA2 ULM in comparison to 2.0-4.5% in MED12 ULM and 0.2-2.4% in FH ULM (p<0.05, Figure 2D, Table 2). These findings suggest that HMGA2 promotes leiomyoma growth through its negative regulation of p16 expression.
3.4 Expression analysis of AKT pathway
AKT has been found to be activated in ULM and promotes fibroid growth and survival within an unfavorable hypoxic microenvironment21. AKT activation in ULM is not fully understood but we have demonstrated its association with the ROS pathway22. Here, we examined the levels of activated AKT and its direct downstream target, pS6, in ULM with the three different gene mutations. HMGA2 ULM showed strong, diffuse immunoreactivity for pAKT and pS6. In contrast, weak to moderate immunoreactivity for pAKT and pS6 was present in MED12 and FH ULM as well as in the myometrial controls (Figure 3, Table 2).
Figure 3.
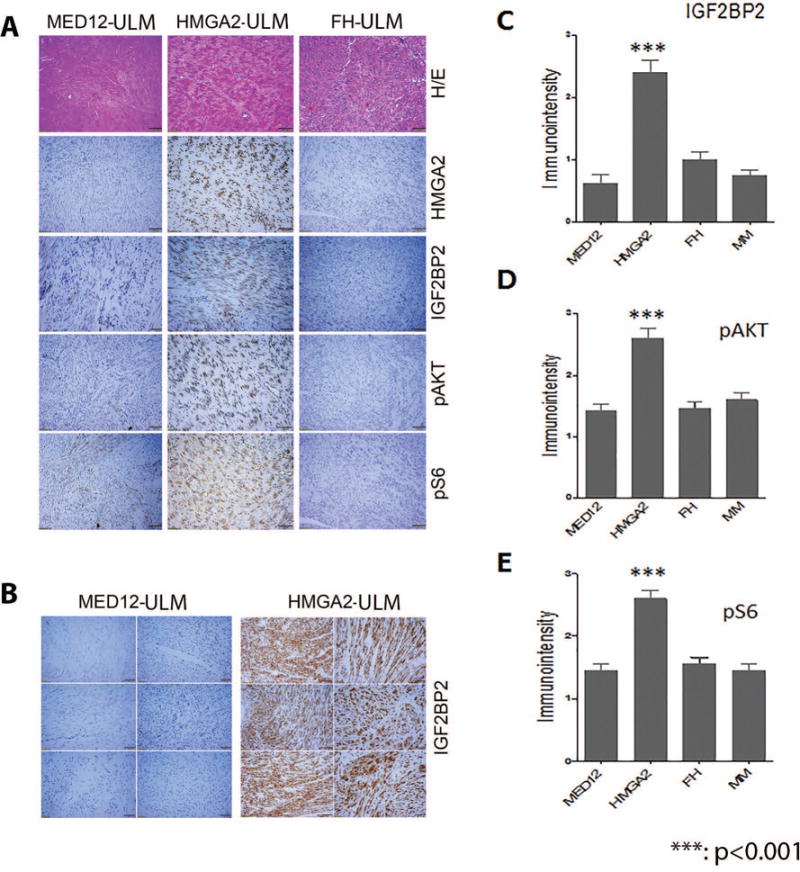
Immunohistochemistry analysis of the selected biomarkers in AKT pathways in ULM with three different driver gene mutations/alteration. A. Photomicrographs illustrate examples of tumor sections of H/E and immunostaining (in the order of HMGA2, IGF2BP2, pAKT, and pS6,) slides for ULM with three different driver gene mutations. B. Closer view of immunoreactivity for IGF2BP2 in 6 HMGA2 (right) and 6 MED12 (left) ULM. C-E. Histobar analysis of IGF2BP (C), pAKT (D) pS6 (E) expression by immuno-intensity in ULM with different driver gene mutations and myometrium (MM).
Previous gene profiling studies have shown that ULM with HMGA2 overexpression have increased IGF2BP2 expression5. To test whether IGF2BP2 is a major upstream mediator for IGF2, we examined IGF2BP2 levels by immunohistochemistry. As illustrated in Figure 3B and 3C, almost all HMGA2 ULM showed strong and diffuse immunoreactivity for IGF2BP2. In contrast, the other two subtypes and the myometrial controls showed low levels of IGF2BP2 (p<0.001). These findings suggest that an important interaction of IGF2BP2 and AKT occur in specifically HMGA2 ULM.
3.5 Molecular analysis of HMGA2-mediated AKT signaling in ULM
The immunohistochemistry results suggest that ULM with HMGA2 overexpression have significantly higher proliferation index, higher AKT activity, and lower p16 expression than the other two genetic subtypes. Thus, primary leiomyoma cells were used to evaluate the role of HMGA2 in modulating AKT, p16 and p21. ULM with MED12 mutations (low HMGA2 levels) were used to overexpress HMGA2 using lentiviral transduction using two MOIs, low (0.5) and moderate (1.0). A dose-dependent upregulation of pAKT was observed by Western blot analysis along with an increase in HMGA2 levels (Figure 4A). Next, using HMGA2 ULM, HMGA2 was silenced using siRNA. With decreased HMGA2 levels, decreased pAKT levels were observed (Figure 4B, C, and D). These data demonstrate the ability of HMGA2 to regulate AKT activity. To evaluate whether AKT regulates HMGA2 levels in ULM, AKT was blocked by the AKT inhibitor MK2206 and no significant change of HMGA2 expression was noted (Figure 4E). These data support that HMGA2 upregulates AKT and not the reverse.
Figure 4.
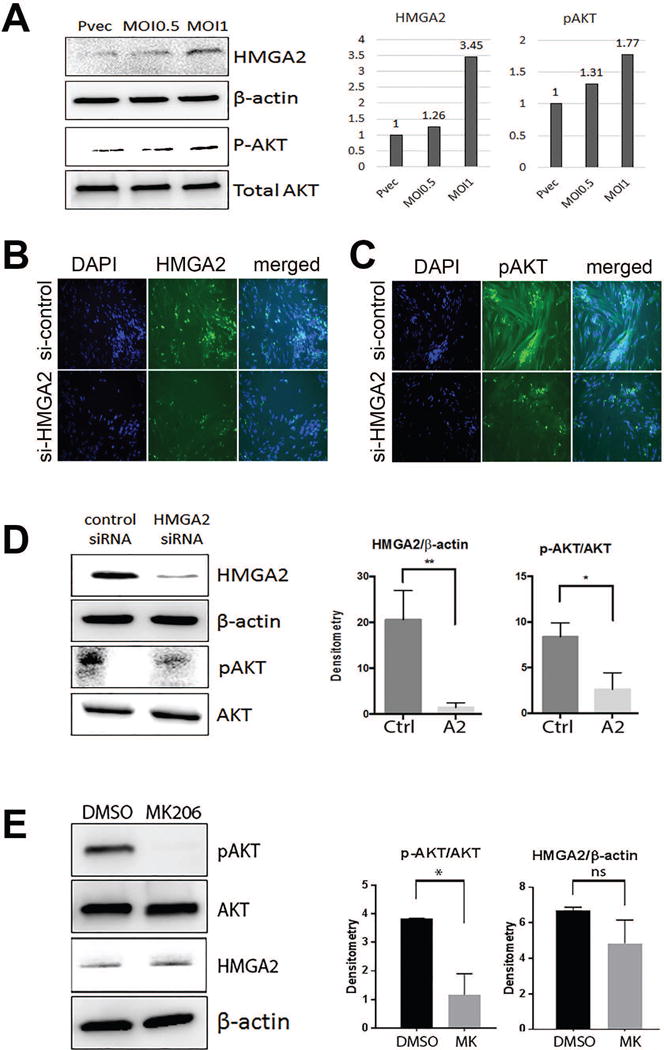
Expression analysis of HMGA2 mediated AKT alteration in primary ULM cells. A. Overexpression of HMGA2 by lentiviral transduction increases pAKT activity in a dose dependent manner. B. and C. Decreased HMGA2 expression by siRNA was evident by immunofluorescent stain of HMGA2 (B) and down regulation of pAKT occurs as a consequence (C). D. Western blot analysis illustrated that siRNA HMGA2 treatment significantly reduced pAKT, but not total AKT. E. Blocking pAKT activity by AKT inhibitor MK2206 showed minimal effect on HMGA2 expression. * p<0.05, ** p<0.01.
3.6 Downregulation of HMGA2 expression in primary culture fibroid cells leads to cellular senescence
We observed that serial passaging of primary culture leiomyoma cells led to profound replicative senescence and concurrent upregulation of both p16 and p21 (Jia et al, unpublished data). To evaluate the role of HMGA2 in this process, primary ULM and matched myometrial (MM) cells were collected at P0, P1 (passage 1) and P2 (passage 2) and then HMGA2 expression was examined by real-time quantitative RT-PCR (Figure 5A). While MM cells exhibited low expression of HMGA2, ULM cells at P0 had higher expression of HMGA2. In contrast, ULM at P1 and P2 exhibited decreased expression of HMGA2 suggesting that HMGA2 downregulation is correlated with replicative senescence. To confirm that downregulation of HMGA2 in primary culture of fibroid cells was the major driving force for cellular senescence, P0 cells were transfected with HMGA2 siRNA and cellular senescence was examined by a β-Gal stain. As shown in Figure 5B, cells treated with HMGA2 siRNA had significantly increased levels of β-Gal staining, indicative of cellular senescence than the cells treated with control siRNA (53% vs. 38%, p<0.05). Similar effects were observed when we used ELISA to measure β-Gal activity (Figure 5C). In addition, we observed in Figure 5D that silencing of HMGA2 in ULM led to upregulation of both p16 and p21. Our findings suggest that the aggressive behavior of HMGA2 ULM is due to increased tumor cell growth and survival through HMGA2, an enhanced AKT pathway and decreased cell cycle control. In contrast, when HMGA2 is low, this leads to reduced AKT activity, increased cell cycle inhibition resulting in cellular arrest or senescence.
Figure 5.
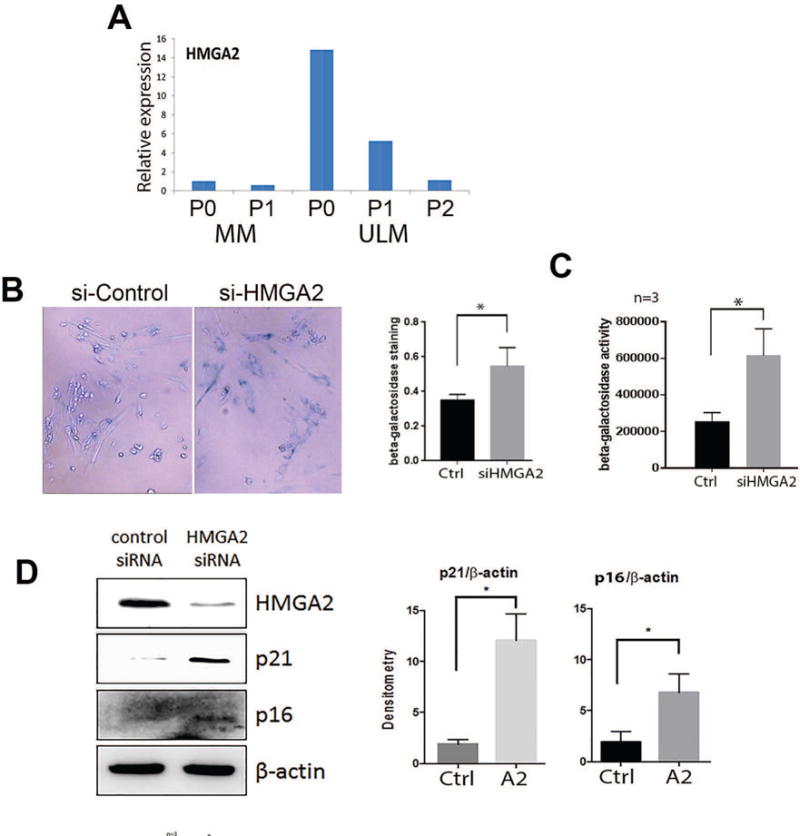
HMGA2 and cellular senescence in primary ULM cells. A. HMGA2 expression by real-time RT-PCR in myometrial (MM) and leiomyoma (ULM) cells in P0 (not passaged), P1 (passage 1) and P2 (passage 2) cultures. B. β-galactosidase staining of senescent primary leiomyoma cells after silencing of HMGA2 by siRNA. C. Senescence in primary leiomyoma cells with silencing of HMGA2 by siRNA measured by β-galactosidase activity. D. Repression of HMGA2 expression by siRNA increases p21 and p16 expression. Histobar panels illustrate the relative expression and significant differences between controls (Ctrl) and HMGA siRNA (A2) and MK2206 (MK) after normalized either total AKT or β-actin.
4. Discussion
ULM are sex steroid hormone driven tumors, characterized by fast growth rate during reproductive age. In general, most ULM, regardless of their underlying genetic mutations, express high levels of ER and PR (Figure 2). Our study has suggested that HMGA2 ULM are a variant that tends to be larger and faster-growing than other genetic subtypes, indicating that this specific gene mutation may play a significant role in tumor growth on top of sex steroid hormone signaling. Therefore, non-hormonal pathways could be a major alternative drug target for fibroid treatment. In this study, we compared the selected cell cycle regulators and AKT in ULM with three different driver gene mutations and found that only the HMGA2 tumors had high AKT activity, high cell proliferation indices (Ki-67), and significantly lower p16 expression (Figure 2).
HMGA2 mutations are the second most common driver mutations in ULM, accounting for 10-15% of the cases6. HMGA2 ULM tend to be larger and faster-growing tumors in comparison to MED12 and FH subtypes (Table 1)5, 9, 10. HMGA2 is a transcriptional regulator and is highly associated with many functions, such as tumorigenesis, stem cell renewal, cell proliferation and cellular senescence. The function of HMGA2 heavily relies on the cell type. For example, in ovarian and other cancer cells, HMGA2 is an oncogene and promotes aggressive tumor growth through its multiple oncogenic properties23. In normal or benign tumor cells, it can promote cell proliferation and sensitizes to stress and oncogene-induced senescence24. HMGA2 ULM are a subset of tumors which do not share the same major pathways as the other genetic subtypes and previous studies have demonstrated that repression of HMGA2 by let-7 and other mechanisms resulted in decreased tumor growth25. Additionally, HMGA2 ULM are larger and have higher rate of cell proliferation, supporting HMGA2 as a mitogenic factor. Transgenic mouse models indicated that HMGA2 can sufficiently repress p16 expression for stem cell self-renewal26. Since AKT pathway is one of the major pathways that regulates ULM growth22, 27–29, HMGA2 regulation of the AKT pathway is a significant discovery for ULM.
It has been shown that decreased HMGA2 expression in acute myeloid leukemia cells inhibited cell proliferation through a decrease in the protein expression of pAKT and p-mTOR30. HMGA2 may also directly regulate IGF2BP2 to influence IGF2 bioavailability in other cell types5, 31. IGF2 is one of the major growth factors highly overexpressed in ULM32. We previously reported that IGF2 is overexpressed in ULM at the transcriptional level without changing IGF2 imprinting status in ULM33. Given that HMGA2 may enhance IGF2 through IGF2BP2, we postulated that HMGA2 overexpression can activate the AKT pathway in ULM and we indeed found that ULM with HMGA2 overexpression showed a significant positive correlation with IGF2BP2, pAKT and pS6 overexpression (Figure 3). This finding was further validated by using in vitro primary leiomyoma cells (Figure 4). The results of our study provide further evidence that ULM with HMGA2 overexpression can enhance AKT activity for tumor growth and survival.
In addition to promoting cell proliferation, HMGA2 is also a major player in cellular senescence either under oncogenic24 or environmental29 stress. Several recent studies have shown that HMGA2 regulates cell cycle genes. Silencing of HMGA2 leads to the induction of cell cycle inhibitors, including cyclin D1, cyclin B1, and cyclin E expression and increases the number of cells in G0/G1 phase34–36. Interestingly, in our current study, we found that HMGA2 expression was inversely proportional to p16 expression (Figure 2). When HMGA2 was silenced in leiomyoma cells, it also resulted in the upregulation of p16 and p21 (Figure 5), leading to reduced tumor growth and increased cellular senescence (Figure 5). Based on this study, HMGA2-mediated AKT signaling and its regulation to cell proliferation and senescence in ULM is summarized in Figure 6.
Figure 6.
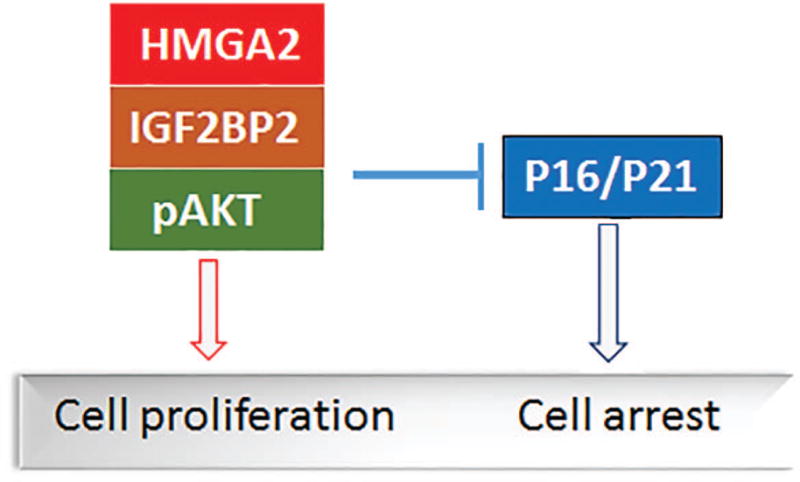
Proposed model of HMGA2 regulating AKT signaling and cell cycle genes leading to cell fate in leiomyoma cells.
Overall, we have shown that ULM with different driver gene mutations harbor different molecular pathways in regulating cell growth in ULM. These differences are reflected by their different growth rates and responses to environmental stress. Thus, HMGA2 ULM are a group of tumors that could be treated differently from other ULM. In contrast, growth of MED12 ULM may rely on tumor associated fibroblasts15. Therefore, with a better characterization of specific targets in ULM with different driver gene mutations, cell growth could be halted and cellular senescence could be induced in a more specific way. Moreover, gene mutation analysis in myomectomy specimen may help to predict the potential tumor growth and guide further clinical management when HMGA2 overexpression is detected.
Supplementary Material
Acknowledgments
We would like to thank Mrs. Stacy Ann Kujawa for obtaining consents from patients and providing fresh samples for the study. All immunohistochemistry staining was performed in the Pathology Core Facility. This study was supported by NIH P01HD57877.
References
- 1.Farquhar CM, Steiner CA. Hysterectomy rates in the United States 1990–1997. Obstet Gynecol. 2002;99:229–34. doi: 10.1016/s0029-7844(01)01723-9. [DOI] [PubMed] [Google Scholar]
- 2.Baird DD, Dunson DB, Hill MC, Cousins D, Schectman JM. High cumulative incidence of uterine leiomyoma in black and white women: ultrasound evidence. Am J Obstet Gynecol. 2003;188:100–7. doi: 10.1067/mob.2003.99. [DOI] [PubMed] [Google Scholar]
- 3.Peddada SD, Laughlin SK, Miner K, Guyon JP, Haneke K, Vahdat HL, Semelka RC, Kowalik A, Armao D, Davis B, Baird DD. Growth of uterine leiomyomata among premenopausal black and white women. Proc Natl Acad Sci U S A. 2008;105:19887–92. doi: 10.1073/pnas.0808188105. [DOI] [PMC free article] [PubMed] [Google Scholar]
- 4.Makinen N, Kampjarvi K, Frizzell N, Butzow R, Vahteristo P. Characterization of MED12, HMGA2, and FH alterations reveals molecular variability in uterine smooth muscle tumors. Mol Cancer. 2017;16:101. doi: 10.1186/s12943-017-0672-1. [DOI] [PMC free article] [PubMed] [Google Scholar]
- 5.Mehine M, Kaasinen E, Heinonen HR, Makinen N, Kampjarvi K, Sarvilinna N, Aavikko M, Vaharautio A, Pasanen A, Butzow R, Heikinheimo O, Sjoberg J, Pitkanen E, Vahteristo P, Aaltonen LA. Integrated data analysis reveals uterine leiomyoma subtypes with distinct driver pathways and biomarkers. Proc Natl Acad Sci U S A. 2016;113:1315–20. doi: 10.1073/pnas.1518752113. [DOI] [PMC free article] [PubMed] [Google Scholar]
- 6.Bertsch E, Qiang W, Zhang Q, Espona-Fiedler M, Druschitz S, Liu Y, Mittal K, Kong B, Kurita T, Wei JJ. MED12 and HMGA2 mutations: two independent genetic events in uterine leiomyoma and leiomyosarcoma. Mod Pathol. 2014;27:1144–53. doi: 10.1038/modpathol.2013.243. [DOI] [PMC free article] [PubMed] [Google Scholar]
- 7.Kampjarvi K, Makinen N, Mehine M, Valipakka S, Uimari O, Pitkanen E, Heinonen HR, Heikkinen T, Tolvanen J, Ahtikoski A, Frizzell N, Sarvilinna N, Sjoberg J, Butzow R, Aaltonen LA, Vahteristo P. MED12 mutations and FH inactivation are mutually exclusive in uterine leiomyomas. Br J Cancer. 2016;114:1405–11. doi: 10.1038/bjc.2016.130. [DOI] [PMC free article] [PubMed] [Google Scholar]
- 8.Hennig Y, Rogalla P, Wanschura S, Frey G, Deichert U, Bartnitzke S, Bullerdiek J. HMGIC expressed in a uterine leiomyoma with a deletion of the long arm of chromosome 7 along with a 12q14-15 rearrangement but not in tumors showing del(7) as the sole cytogenetic abnormality. Cancer Genet Cytogenet. 1997;96:129–33. doi: 10.1016/s0165-4608(96)00283-x. [DOI] [PubMed] [Google Scholar]
- 9.Wang T, Zhang X, Obijuru L, Laser J, Aris V, Lee P, Mittal K, Soteropoulos P, Wei J-J. A micro-RNA signature associated with race, tumor size, and target gene activity in human uterine leiomyomas. Genes Chromosomes and Cancer. 2007;46:336–47. doi: 10.1002/gcc.20415. [DOI] [PubMed] [Google Scholar]
- 10.Quade BJ, Weremowicz S, Neskey DM, Vanni R, Ladd C, Dal Cin P, Morton CC. Fusion transcripts involving HMGA2 are not a common molecular mechanism in uterine leiomyomata with rearrangements in 12q15. Cancer Res. 2003;63:1351–8. [PubMed] [Google Scholar]
- 11.Ordulu Z, Nucci MR, Dal Cin P, Hollowell ML, Otis CN, Hornick JL, Park PJ, Kim TM, Quade BJ, Morton CC. Intravenous leiomyomatosis: an unusual intermediate between benign and malignant uterine smooth muscle tumors. Mod Pathol. 2016;29:500–10. doi: 10.1038/modpathol.2016.36. [DOI] [PMC free article] [PubMed] [Google Scholar]
- 12.Wu J, Liu Z, Shao C, Gong Y, Hernando E, Lee P, Narita M, Muller W, Liu J, Wei JJ. HMGA2 overexpression-induced ovarian surface epithelial transformation is mediated through regulation of EMT genes. Cancer Res. 2011;71:349–59. doi: 10.1158/0008-5472.CAN-10-2550. [DOI] [PMC free article] [PubMed] [Google Scholar]
- 13.Makinen N, Mehine M, Tolvanen J, Kaasinen E, Li Y, Lehtonen HJ, Gentile M, Yan J, Enge M, Taipale M, Aavikko M, Katainen R, Virolainen E, Bohling T, Koski TA, Launonen V, Sjoberg J, Taipale J, Vahteristo P, Aaltonen LA. MED12, the mediator complex subunit 12 gene, is mutated at high frequency in uterine leiomyomas. Science. 2011;334:252–5. doi: 10.1126/science.1208930. [DOI] [PubMed] [Google Scholar]
- 14.Knuesel MT, Meyer KD, Donner AJ, Espinosa JM, Taatjes DJ. The human CDK8 subcomplex is a histone kinase that requires Med12 for activity and can function independently of mediator. Mol Cell Biol. 2009;29:650–61. doi: 10.1128/MCB.00993-08. [DOI] [PMC free article] [PubMed] [Google Scholar]
- 15.Wu X, Serna VA, Thomas J, Qiang W, Blumenfeld ML, Kurita T. Subtype-Specific Tumor-Associated Fibroblasts Contribute to the Pathogenesis of Uterine Leiomyoma. Cancer Res. 2017;77:6891–901. doi: 10.1158/0008-5472.CAN-17-1744. [DOI] [PMC free article] [PubMed] [Google Scholar]
- 16.Zhang Q, Poropatich K, Ubago J, Xie J, Xu X, Frizzell N, Kim J, Kong B, Wei JJ. Fumarate Hydratase Mutations and Alterations in Leiomyoma With Bizarre Nuclei. Int J Gynecol Pathol. 2017 doi: 10.1097/PGP.0000000000000447. [DOI] [PMC free article] [PubMed] [Google Scholar]
- 17.Miettinen M, Felisiak-Golabek A, Wasag B, Chmara M, Wang Z, Butzow R, Lasota J. Fumarase-deficient Uterine Leiomyomas: An Immunohistochemical, Molecular Genetic, and Clinicopathologic Study of 86 Cases. Am J Surg Pathol. 2016;40:1661–9. doi: 10.1097/PAS.0000000000000703. [DOI] [PMC free article] [PubMed] [Google Scholar]
- 18.O’Neill CJ, McBride HA, Connolly LE, McCluggage WG. Uterine leiomyosarcomas are characterized by high p16, p53 and MIB1 expression in comparison with usual leiomyomas, leiomyoma variants and smooth muscle tumours of uncertain malignant potential. Histopathology. 2007;50:851–8. doi: 10.1111/j.1365-2559.2007.02699.x. [DOI] [PubMed] [Google Scholar]
- 19.Laser J, Lee P, Wei JJ. Cellular senescence in usual type uterine leiomyoma. Fertil Steril. 2010;93:2020–6. doi: 10.1016/j.fertnstert.2008.12.116. [DOI] [PubMed] [Google Scholar]
- 20.Gray-Schopfer VC, Cheong SC, Chong H, Chow J, Moss T, Abdel-Malek ZA, Marais R, Wynford-Thomas D, Bennett DC. Cellular senescence in naevi and immortalisation in melanoma: a role for p16? Br J Cancer. 2006;95:496–505. doi: 10.1038/sj.bjc.6603283. [DOI] [PMC free article] [PubMed] [Google Scholar]
- 21.Hoekstra AV, Sefton EC, Berry E, Lu Z, Hardt J, Marsh E, Yin P, Clardy J, Chakravarti D, Bulun S, Kim JJ. Progestins activate the AKT pathway in leiomyoma cells and promote survival. J Clin Endocrinol Metab. 2009;94:1768–74. doi: 10.1210/jc.2008-2093. [DOI] [PMC free article] [PubMed] [Google Scholar]
- 22.Vidimar V, Gius D, Chakravarti D, Bulun SE, Wei JJ, Kim JJ. Dysfunctional MnSOD leads to redox dysregulation and activation of prosurvival AKT signaling in uterine leiomyomas. Sci Adv. 2016;2:e1601132. doi: 10.1126/sciadv.1601132. [DOI] [PMC free article] [PubMed] [Google Scholar]
- 23.Wu J, Wei JJ. HMGA2 and high-grade serous ovarian carcinoma. J Mol Med (Berl) 2013 doi: 10.1007/s00109-013-1055-8. [DOI] [PubMed] [Google Scholar]
- 24.Narita M, Narita M, Krizhanovsky V, Nunez S, Chicas A, Hearn SA, Myers MP, Lowe SW. A novel role for high-mobility group a proteins in cellular senescence and heterochromatin formation. Cell. 2006;126:503–14. doi: 10.1016/j.cell.2006.05.052. [DOI] [PubMed] [Google Scholar]
- 25.Peng Y, Laser J, Shi G, Mittal K, Melamed J, Lee P, Wei JJ. Antiproliferative effects by Let-7 repression of high-mobility group A2 in uterine leiomyoma. Mol Cancer Res. 2008;6:663–73. doi: 10.1158/1541-7786.MCR-07-0370. [DOI] [PubMed] [Google Scholar]
- 26.Nishino J, Kim I, Chada K, Morrison SJ. Hmga2 promotes neural stem cell self-renewal in young but not old mice by reducing p16Ink4a and p19Arf Expression. Cell. 2008;135:227–39. doi: 10.1016/j.cell.2008.09.01. [DOI] [PMC free article] [PubMed] [Google Scholar]
- 27.Dhingra S, Rodriguez ME, Shen Q, Duan X, Stanton ML, Chen L, Zhang R, Brown RE. Constitutive activation with overexpression of the mTORC2-phospholipase D1 pathway in uterine leiomyosarcoma and STUMP: morphoproteomic analysis with therapeutic implications. International journal of clinical and experimental pathology. 2011;4:134–46. [PMC free article] [PubMed] [Google Scholar]
- 28.Sefton EC, Qiang W, Serna V, Kurita T, Wei JJ, Chakravarti D, Kim JJ. MK-2206, an AKT Inhibitor, Promotes Caspase-Independent Cell Death and Inhibits Leiomyoma Growth. Endocrinology. 2013 doi: 10.1210/en.2013-1389. [DOI] [PMC free article] [PubMed] [Google Scholar]
- 29.Xu X, Lu Z, Qiang W, Vidimar V, Kong B, Kim JJ, Wei JJ. Inactivation of AKT induces cellular senescence in uterine leiomyoma. Endocrinology. 2014;155:1510–9. doi: 10.1210/en.2013-1929. [DOI] [PMC free article] [PubMed] [Google Scholar]
- 30.Tan L, Wei X, Zheng L, Zeng J, Liu H, Yang S, Tan H. Amplified HMGA2 promotes cell growth by regulating Akt pathway in AML. J Cancer Res Clin Oncol. 2016;142:389–99. doi: 10.1007/s00432-015-2036-9. [DOI] [PubMed] [Google Scholar]
- 31.Li Z, Zhang Y, Ramanujan K, Ma Y, Kirsch DG, Glass DJ. Oncogenic NRAS, required for pathogenesis of embryonic rhabdomyosarcoma, relies upon the HMGA2-IGF2BP2 pathway. Cancer Res. 2013;73:3041–50. doi: 10.1158/0008-5472.CAN-12-3947. [DOI] [PMC free article] [PubMed] [Google Scholar]
- 32.Wei JJ, Chiriboga L, Arslan AA, Melamed J, Yee H, Mittal K. Ethnic differences in expression of the dysregulated proteins in uterine leiomyomata. Hum Reprod. 2006;21:57–67. doi: 10.1093/humrep/dei309. [DOI] [PubMed] [Google Scholar]
- 33.Peng L, Wen Y, Han Y, Wei A, Shi G, Mizuguchi M, Lee P, Hernando E, Mittal K, et al. Expression of insulin-like growth factors (IGFs) and IGF signaling: molecular complexity in uterine leiomyomas. Fertility and Sterility. 2009;91:2664–75. doi: 10.1016/j.fertnstert.2007.10.083. [DOI] [PubMed] [Google Scholar]
- 34.Xie H, Wang J, Jiang L, Geng C, Li Q, Mei D, Zhao L, Cao J. ROS-dependent HMGA2 upregulation mediates Cd-induced proliferation in MRC-5 cells. Toxicol In Vitro. 2016;34:146–52. doi: 10.1016/j.tiv.2016.04.001. [DOI] [PubMed] [Google Scholar]
- 35.Esmailzadeh S, Mansoori B, Mohammadi A, Shanehbandi D, Baradaran B. siRNA-Mediated Silencing of HMGA2 Induces Apoptosis and Cell Cycle Arrest in Human Colorectal Carcinoma. J Gastrointest Cancer. 2017;48:156–63. doi: 10.1007/s12029-016-9871-z. [DOI] [PubMed] [Google Scholar]
- 36.Li Y, Peng L, Seto E. Histone Deacetylase 10 Regulates the Cell Cycle G2/M Phase Transition via a Novel Let-7-HMGA2-Cyclin A2 Pathway. Mol Cell Biol. 2015;35:3547–65. doi: 10.1128/MCB.00400-15. [DOI] [PMC free article] [PubMed] [Google Scholar]
Associated Data
This section collects any data citations, data availability statements, or supplementary materials included in this article.


