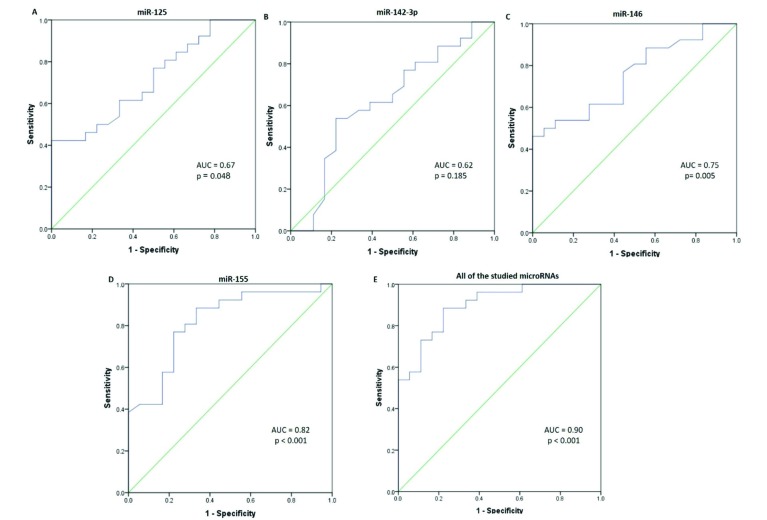
Fig. 2.
ROC curve analysis of the studied plasma miRNAs. ROC curves analysis based on q-PCR data display the diagnostic power of the following plasma miRNAs; (A) miR-125a (B) miR-142-3p (C) miR-146, (D) miR-155, and (E) the effects of the studied miRNAs (e.g., miR-125, miR-142-3p, miR-146, and miR-155) in distinguishing patients with lupus nephritis from healthy individuals.

