Abstract.
Development of advanced preclinical imaging techniques has had an important impact on the field of biomedical research, with positron emission tomography (PET) imaging the most mature of these efforts. Developers of preclinical PET scanners have joined the recent multimodality imaging trend by combining PET imaging with other modalities, such as magnetic resonance imaging (MRI). Our group has developed a combined PET-MRI insert for the imaging of animals up to the size of rats in a clinical 3T MRI scanner. The system utilizes a sequential scanner configuration instead of the more common coplanar geometry. The PET component of the system consists of a ring of 12 liquid-cooled, SiPM-based detector modules (). System performance was evaluated with the NEMA NU 4-2008 protocol. Spatial resolution is 5 cm from the center of the field-of-view measured from single-slice rebinned filtered backprojection-reconstructed images. Peak noise equivalent count rate is 17.7 kcps at 8.5 MBq; peak sensitivity is 2.9%. The MRI component of the system is composed of a 12-cm-diameter birdcage transmit/receive coil with a dual-preamplifier interface possessing very low noise preamplifiers. System performance was evaluated using American College of Radiology-based methods. Image homogeneity is 99%; the ghosting ratio is 0.0054. The signal-to-noise ratio is 95 and spatial resolution is . There was no discernable cross-modality interference.
Keywords: positron emission tomography, magnetic resonance imaging, preclinical
1. Introduction
Positron emission tomography (PET) and magnetic resonance imaging (MRI) scanners optimized for imaging of small animals are becoming common in biomedical research programs, often used with animal models of disease.1 This type of imaging requires specialized devices with small bores sizes (12 to 26 cm diameters) appropriate to accommodate mice, rats, and in some cases small primates. Preclinical PET scanners typically utilize arrays of small, parallelepiped scintillator elements ( to cross-sections and 10 to 30 mm long) and have high detection sensitivities (1.2% to 6.7% peak sensitivity measured with a centrally-located point source).2 Perhaps the most successful animal PET imaging systems have been the MicroPET® series of scanners.3 Small animal PET scanners have reconstructed spatial resolutions ranging from to full-width at half-maximum (FWHM) at the center of the field-of-view (FoV).2
As with preclinical PET imaging, several MRI systems have been developed.4–7 They typically have small bores ( diameter) and utilize strong magnetic fields (4.7 to 11.7 T), resulting in very high resolution (as high as ) and high signal-to-noise ratios (SNRs). In addition to larger magnetic fields, these systems possess specialized, high amplitude, gradient magnetic field coils, and custom transmit/receive MRI coils to achieve the performance necessary to effectively image small animals.
One impediment to some potential users of specialized MRI scanners is high cost, which has led some investigators to explore the application of clinical MRI systems to small animal imaging and spectroscopy.8,9 For example, Herrmann et al.10 investigated the capabilities of a 3 T clinical scanner to image rats. They found that it was necessary to utilize specially designed coils to obtain acceptable images. Ittrich et al.11 used a 3 T clinical system to track iron oxide-labeled mesenchymal stem cells in rats with acute kidney injury. Mayer et al.12 utilized a 3 T clinical system to quantify the metabolite and neurotransmitter signals in the basal ganglia and cerebellum of rats. These examples demonstrate that MRI scanners designed for human imaging can, with the use of specialized coils and methods, be used to produce images of small animals sufficient for research applications. The use of a preclinical imaging methods with a clinical scanner benefits from the ubiquity of MRI imagers in medical facilities and their relatively large region of homogeneous fields. The ability to temporarily transform a clinical scanner to a small animal research scanner extends the availability of MRI methods to researchers who otherwise would not have access to specialized small animal imaging.
Given the potential benefits of combining MRI and PET, several academic groups have constructed preclinical PET/MRI scanners.13–15 In one of the first efforts, a UC Davis-University of Tübingen collaboration investigated an MR-compatible PET detector that utilizes avalanche photodiodes16 (APD). This device consisted of a array of lutetium orthosilicate (LSO) detector elements coupled to a array of APDs through a 3.5-mm-thick acrylic light guide to spread scintillation light. It was integrated with a small MRI RF coil designed to be placed in the imaging region of a 7 T MRI animal scanner. To reduce electrical noise interference and protect the APDs from damage, it was necessary to shield them from the strong gradient magnetic fields present during MRI scanning. They found that the presence of 0.8-mm-thick copper shielding made MRI imaging impossible. The use of 0.15-mm-thick copper shielding, however, did allow for MRI images to be produced but with reductions of SNR by in both gradient echo and spin echo (SE) images. This reduction in SNR is likely produced by magnetic field inhomogeneities caused by eddy currents induced in the copper shielding. The energy resolution of the PET detector module was degraded slightly during MRI image acquisition (14.6% to 18.7% FWHM). Grazioso et al.,17 from Siemens Molecular Imaging, have also utilized APDs to produce MRI-compatible PET detector modules designed to be used with a clinical MRI scanner. Specifically, they coupled arrays of LSO to a arrays of APDs. The modules were tested inside the bore of a Siemens 1.5 T Symphony MRI scanner. As reported by the UC Davis-Tübingen group, the Siemens group had to shield the APDs, which resulted in a 15% reduction in SNR. They reported an energy resolution of 17% FWHM.
Recently, silicon photomultipliers (SiPM) have supplanted APDs as the preferred building block of MR-compatible PET scanners. These devices have higher gain than APDs (on the order of ) and have the same insensitivity to magnetic fields. Consequently, the latest generation of MR-compatible PET scanners utilizes SiPMs.18–25 For example, Yoon et al.26 from the Seoul National University in Korea constructed an SiPM-based PET scanner that has a diameter of 13.6 cm and an axial extent of 3.2 cm. Wehner et al.27 constructed a digital SiPM-based PET scanner for the use in a clinical 3 T MRI scanner. This system has a 16-cm-diameter FoV and a 3-cm axial FoV. In this work, we investigated the construction of a large FoV, SiPM-based, MR-compatible PET scanner insert, and custom transmit/receive MRI coils for use with a clinical 3 T MRI scanner.
2. Methods
Unlike many PET/MRI inserts, the PET component of the West Virginia University insert (WVU-PET/MRI) is not intended to be placed in the FoV of the MRI scanner. Instead, it is designed to be positioned just outside of the MRI scanner bore, similar to the geometry of many PET/CT scanners. This arrangement was chosen to maximize the image quality of both scanners since it has been observed by several groups that the presence of the PET scanner in the FoV of MRI scanners can degrade the performance of both imagers. Additionally, by separating the two scanners, the interactions (electrical and physical) between them are greatly reduced, simplifying design and construction of the PET component and MRI coils. Finally, this geometry eliminates complications caused by photon attenuation in the MRI coil. The main drawback to a sequential scanner arrangement, however, is that it is not possible to perform simultaneous PET and MRI scans. This limitation is likely only a hindrance in studies where temporal correlation between MRI-derived findings and PET images is required. In most current applications of PET/MRI scanning, temporal correlations are not required, rather it is spatial correlations that are desirable. Thus, the extra effort, complications, and performance penalties that can result from construction of a system capable of simultaneous imaging may not be necessary.
2.1. PET Scanner Design
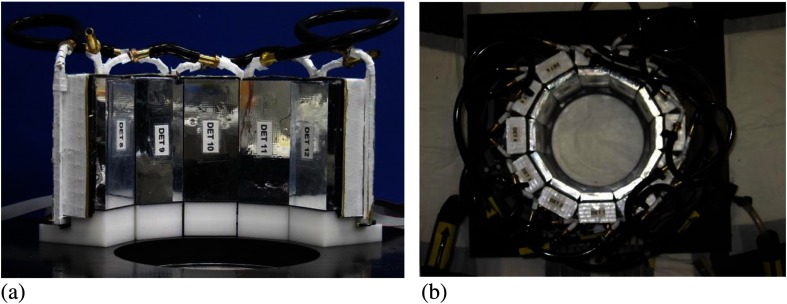
The PET component of the insert consists of a ring of 12 individual modules () designed to operate in a magnetic field environment.28 Each detector is made-up of a array of LYSO detector elements (; , manufactured by Proteus, Inc., Chagrin Falls, Ohio) coupled to two arrays of SensL Photonics ArraySL units (ArraySL-4p9, manufactured by SensL Photonics, Cork, Ireland). Each ArraySL consists of a array of individual SiPMs (144 SiPMs per device). Individual modules have an active area of and produces output channels. Electronic pulses created by the SiPM arrays are readout by multiplexing electronics developed by AiT Technologies (Newport News, Virginia). These devices accept 144 signals from each SiPM array and reduce them to four channels (X−, X+, Y−, and Y+). Thus, each detector module produces eight channels of analog output. Multiplexing is necessary to minimize the number of ADC channels to reduce the system’s cost and complexity.
As with most solid-state devices, Johnson noise is reduced by cooling SiPMs. In addition to reduced noise, lower temperatures increase the gain of SiPMs by increasing their overvoltages.28 To take advantage of the performance enhancements produced by cooling, each detector structure is surrounded by a cooling jacket. Cooling liquid is circulated through copper tubes soldered to the jacket. The liquid is cooled to 8°C and circulated with a desktop chiller (Huber USA, Cary, North Carolina). The 12 detector modules are mounted on gantry support structure to form the MR-compatible PET scanner (Fig. 1). An important characteristic of the PET module is that the physical extent of the scintillator array is slightly smaller than the active area of the SiPMs, which enhances light collection of the scintillator elements at the edges of the detector.28 The dimensions of the scintillator and SiPM arrays were chosen so that the scintillator from adjacent detectors comes in to physical contact when they were formed into a ring (see Fig. 1). The close packing of active detection regions, combined with the ability to detect signal from scintillator elements at the edges of the detector, acts to limit loss of events at junctions between modules. To improve the cooling efficiency of the system, the detector ring is divided into two separate circuits; the flow of cooling liquid is split and directed to individual halves of the detector ring. Thus, each loop of liquid cools six detectors instead of twelve, which distributes the cooling load and hence reduces the temperature gradient from the first detector to the last in the cooling loop. The gantry enclosure is purged with nitrogen gas prior to sealing to minimize the potential for formation of condensation on the cooled detector units.
Fig. 1.
Picture of the PET component of the WVU-PET/MRI gantry showing the (a) close spacing of the detectors and (b) the completed ring of 12 detector modules with the cooling tubes (light tight cover removed).
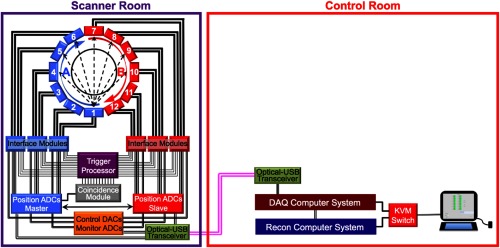
As noted above, each detector module produces two sets of analog outputs (one for each of the two SiPM arrays in a module). These data are routed to interface modules (SIPMM4×4H, AiT Technologies) that format the signals for transmittance to FPGA-based ADCs (AiT Technologies) via multiconductor, ribbon cables (Fig. 2). The interface module also produce pulses whose amplitudes are proportional to the total amount of light collected by the each SiPM array. An individual interface module can accept data from two PET detector modules. The two energy pulses produced by each module are combined by a custom NIM processing module to produce one signal proportional to the amount of energy deposited by a photon in the scintillator of the detector module. Coincidence timing resolution is 2.1 ns.28 Each of the 12 energy pulses is routed to a coincidence module developed in collaboration with Mesytec, Inc. (Putzbrunn, Germany). This device amplitude discriminates () the input signals and determines coincidences between the 12 input signals (coincidence window = 6 ns) based on a pattern programmed into the module. Each WVU-PET/MRI detector module is in coincidence with seven opposing modules, producing a nominal transaxial FoV of 12 cm (axial FoV extent= 9.1 cm). When a coincidence is detected, the TTL pulse produced by the module initiates an analog-to-digital conversion of the analog SiPM readout signals. These data are then transmitted to the data acquisition (DAQ) computer. Determination of event location in the scintillator array is made by calculation of the center-of-mass of this data and application of a premeasured look-up table. The energy of each event is determined from the digitized signals after application of a premeasured energy calibration table. These list mode data are transmitted from the DAQ computer to the reconstruction computer via a gigabit network connection (see Fig. 2).
Fig. 2.
Schematic of the PET gantry of the WVU-PET/MRI system showing the ring of detector modules (flow direction of the cooling liquid shown) and elements of the data acquisition system. Flow of the cooling liquid in the “A” loop moves from detector 1 to detector 6, while in the “B” loop, liquid flow is from detector 7 to 12 to equalize scanner cooling. Also shown are the DACs used to control bias voltage and the ADCs used to monitor temperature and bias voltage. Finally, the major components of the data acquisition subsystem are shown. All communication signals to and from the scanner gantry are converted from USB2 to optical signals for transmission over fiber optic cable and then back to USB2, where they are routed to the DAQ control computer. The DAQ computer is networked with the reconstruction computer. The locations of the gantry components (scanner room and control room) are labeled.
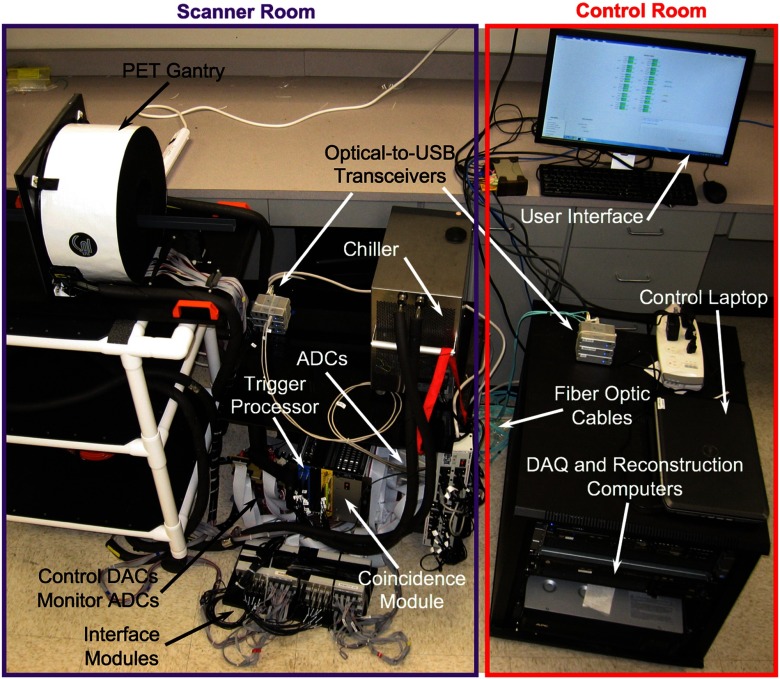
Operation of the scanner is controlled and monitored via a custom computer user interface. Specifically, the bias voltage to each SiPM () is determined by application of analog inputs from a computer-controlled-DAC (National Instruments, Inc., NI 9264) to a programmable voltage supply incorporated in the SiPM interface modules. The optimal bias voltage for each SiPM array at operating temperature was determined by adjusting individual voltages to equalize gains across the scanner. Detector temperature and bias voltages are monitored with an analog-to-digital converter (National Instruments, Inc., NI 9205 ADC). Specifically, the temperature of each SiPM array is monitored by measuring the voltage across a thermistor positioned on the units. Bias voltages are monitored by digitizing outputs from each SiPM array with the NI 9205 ADC. The computer interface is also used to set data acquisition parameters (acquisition duration and name of output data file). All communications (transfer of digitized data, system control signals, and monitor signals) between the control computer and PET gantry are accomplished via fiber optics, which eliminates the possibility RF entering the MRI scanner room via electrically conductive cables that can become RF antennae. Figure 3 shows a picture of the PET scanner component of the system.
Fig. 3.
Picture of the PET scanner component showing the system elements in the schematic drawing of the system including their locations (Fig. 2). The control computer user interface is also shown.
Prior to reconstruction, the data are corrected for loss of detection sensitivity at the areas where the detector modules come into contact. These gaps are well known in small diameter ring PET scanners.29 In regions where the modules meet, there is little scintillator material, so few photons interact with the detectors. Thus, the object is not completely sampled, causing artifacts in the reconstructed images. To correct for these gaps, we developed an algorithm, similar in concept to the sinogram interpolation method,29 which inserts events to create “pseudodetectors.” Specifically, the list mode data was scanned to identify entries from detector elements adjacent to these gaps. For every three of these entries, four are added to the data at a position that coincides with the physical location of a scintillator gap. The 4-to-3 ratio accounts for the fact that the volume void regions are a factor 1.33 larger than the volume of a detector element.
Reconstruction of images from the list mode data is performed using the ordered set expectation maximization (OSEM) iterative algorithm (three subsets). The OSEM algorithm was optimized for use with the eight cores present in the reconstruction computer.30 Inhomogeneities in detector response were addressed by incorporation of a flood phantom correction into the reconstruction algorithm. Density maps calculated from knowledge of the object geometry were used to correct the PET data for photon attenuation (no Compton scattering correction is applied). Only events where both photons had energies between 350 and 650 KeV were included in the reconstructed images. To comply with the NEMA NU 4-2008 protocol, the data used for measurement of spatial resolution were rebinned into sinograms using single slice rebinning (SSRB) and reconstructed using the filtered backprojection (SSRB-FBP) algorithm.31
2.2. MRI Coil Design
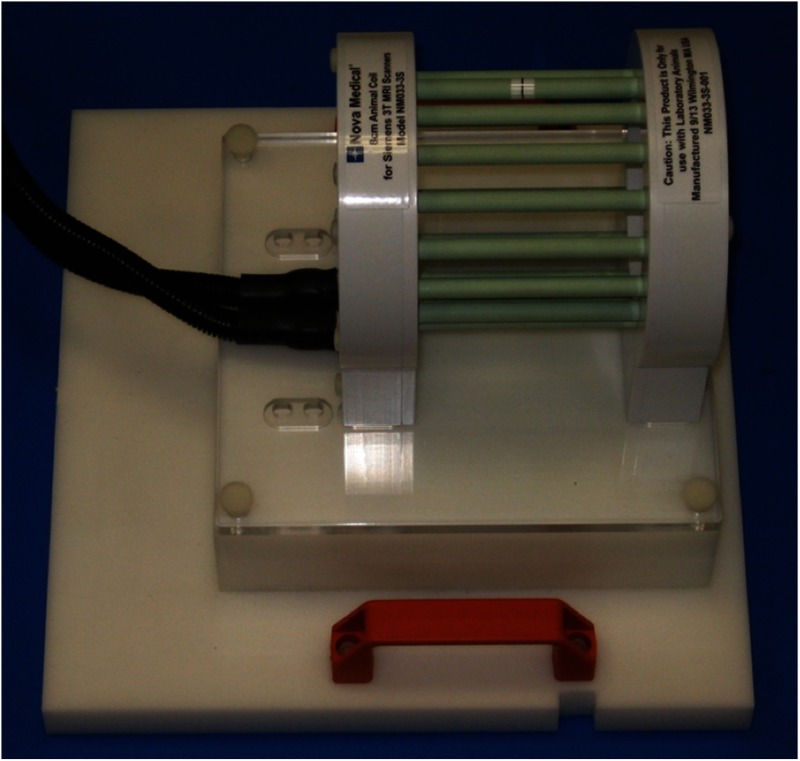
To perform imaging of small animals up to medium-sized rats in a clinical 3 T MRI scanner (Siemens Verio), a special MRI coil was constructed (Fig. 4). Specifically, a 12-cm-diameter birdcage transmit/receive coil with a dual-preamplifier interface possessing very low noise preamplifiers was designed and built by Nova Medical, Inc. (Wilmington, Massachusetts). The coil was constructed with 16, 0.4-cm-diameter, 13.7-cm long copper rungs arranged in a 13.5-cm-diameter ring. End-rings were fabricated from standard 0.032” single sided flame retardant, glass-reinforced epoxy-laminated fiberglass (FR4)-printed circuit board (FR4-PCB). The housing was constructed using a combination of FR4 and white UL94-VO rated PVC. The coil required end-ring tuning capacitance of pf. Drive points at the 4:30 and 7:30 locations were matched to 50Ω with a capacitive divider and fed via baluns and triaxial cable to a dual preamplifier quadrature interface for direct connection to a Siemens-style coil plug. The dual preamplifier interface, which places preamplifiers directly after the transmit/receive switches for each quadrature channel (versus after the quadrature hybrid), was chosen to minimize SNR changes that occur with various load conditions.32 The loaded-to-unloaded ratio of the coil is to , depending upon dimensions of the object. We chose the transmit/receive birdcage approach over a typical 8 ch array design because, with the relatively low filling factor obtained with small animals and desired inner coil diameter, we found that an 8 ch array had very poor loading of individual channels compared to a birdcage configuration. This poor filling factor, and consequent high loaded (), caused this approach to suffer considerable element-element coupling and degradation of coil SNR by the noise from nonisolated coil preamplifiers. Additionally, the highly homogenous images provided by a birdcage design simplify image analysis as there is no need for image intensity correction. Coil specific absorption rate levels were set in the coil files based on appropriate full-wave finite-difference time-domain calculations (Remcom XFDTD Version 7.3.2, State College, Pennsylvania).
Fig. 4.
Picture of the custom, small animal transmit/receive MRI coil.
2.3. Integration of PET and MRI Components
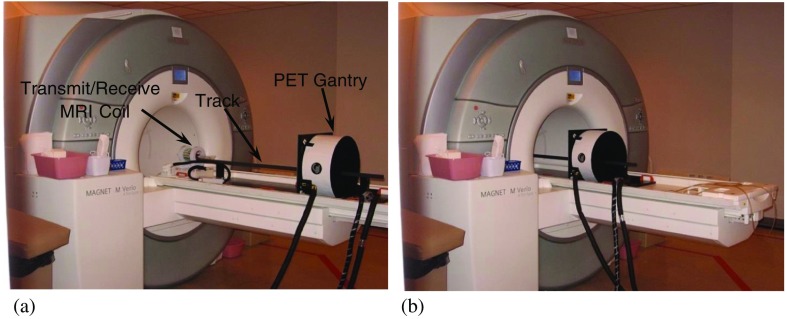
Unlike many PET/MRI scanners, the PET component of the WVU-PET/MRI scanner is not positioned inside the bore of the MRI scanner. Instead, its geometry is similar to clinical PET/CT scanners, where the individual components are sequentially positioned, rather than the coplanar arrangement used in many other PET/MRI scanners (Fig. 5). To integrate the two scanners, a special structure consisting of the PET scanner gantry, connections for the cooling system and connections to the PET electronics were constructed. This structure is designed to fit into the bed of the Siemens 3 T Verio MRI scanner, replacing the removable spinal MRI coil. A mounting fixture that holds the object to be imaged slides along a track intersecting the centers of the PET scanner and MRI coil (Fig. 5). Objects larger than the axial FoV of the PET system can be scanned by acquiring data from multiple bed positions (35% overlap). There are detents in the track that ensure reproducible positioning in the PET and MRI scanners. PET-MRI image coregistration is accomplished with software written in the IDL software environment (Harris Geospatial Solutions, Inc., Broomfield, Colorado). The software adjusts reconstructed voxel sizes and utilizes a previously calculated translation matrix to align the images. The images are then displayed using the Amide software package.33 Note that since the imaging areas of the two scanners are coaxial, no rotation is required to align the images. While it is possible to utilize MRI images to correct the effect of photon attenuation and Compton scattering on PET images,34 this capability is not currently implemented on our system.
Fig. 5.
Pictures of the WVU-PET/MRI insert at its (a) extracted and (b) inserted positions. Note the cooling tubes and signal cable bundle leading to the PET gantry.
2.4. PET Scanner Performance Testing
To assess the basic performance characteristics of the PET component, the NU 4-2008 NEMA protocol was performed31 with the system separated from MRI scanner. Briefly, spatial resolution was measured by stepping a point-like source containing 1.85 MBq of (Isotope Product Laboratories, Inc., Valencia, California) transaxially at positions of 5 mm, 10 mm, 15 mm, 25 mm, and 50 mm from the center of the scanner at its axial center and offset by 2.3 cm (¼ axial FoV from center). The data were reconstructed using the SSRB-FBP algorithm. The FWHM and full-width-at-tenth-maximum of radial, tangential and axial profiles through the images of the point source were measured. The count rate capabilities of the scanner were assessed by scanning the rat-like NEMA NU 4-2008 phantom. Total, true, random, and scatter coincidences rates, as well as the noise equivalent count rates (NECR), were measured at levels ranging from to . Detection sensitivity was measured by stepping the source used to make the spatial resolution measurements along the central axis of the scanner in 5-mm increments. The absolute system detection sensitivity was plotted as a function of position. Finally, imaging performance was assessed by scanning the NEMA NU 4-2008 image quality phantom [OSEM reconstruction (3 subsets, 10 iterations)]. Image uniformity and recovery coefficients (RCs) for each of the five small rod sources present in the phantom and spillover ratios (SORs) for the two hollow cylinders in the phantom were calculated using the methods stated in the protocol.
2.5. Transmit/Receive MRI Coil Testing
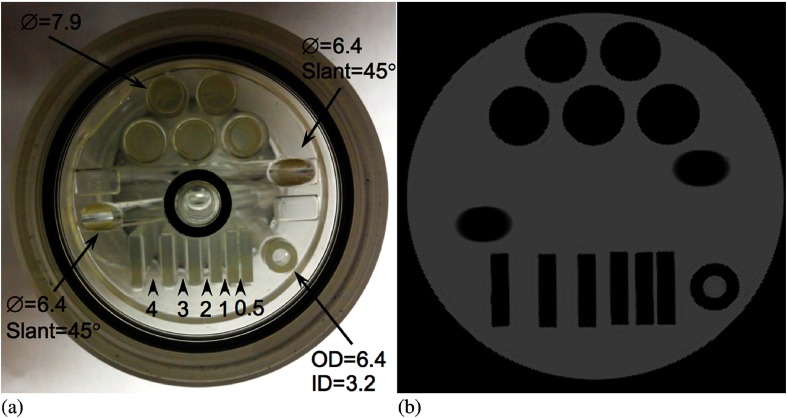
Evaluation of the animal MRI coil was performed with two phantoms: a uniform cylinder (6-cm diameter and 14-cm long) constructed by our group and a custom quality assurance phantom (6-cm diameter and 11-cm long). This phantom consists of a series of acrylic blocks with varying separations to assess spatial resolution. It also contains cylinders of different wall thickness and diameter, in addition to two solid acrylic rods slanted at 45 deg. Both phantoms contained a solution of nickel chloride and sodium chloride: 10 mM and 0.45% by weight aqueous NaCl.35 The phantoms were scanned using a T1-weighted, SE pulse sequence: , , , slice and . The methodology used to measure image quality parameters, such as ghosting ratio, SNR, spatial resolution, and image homogeneity are based on the techniques described by the American College of Radiology’s MRI accreditation program.35
2.6. PET/MRI Imaging Test
To illustrate the hybrid imaging capabilities of the scanner, a micro-hot-rod phantom was scanned sequentially with both components of the WVU-PET/MRI insert at its inserted position. The phantom was filled with water containing 1.85 MBq of FDG. PET data were acquired for 180 s. It was then moved to the MRI-scan position and scanned utilizing the same SE pulse sequence used to scan the MRI phantoms described above. The phantom was also scanned with PET scanner at the extracted position.
3. Results
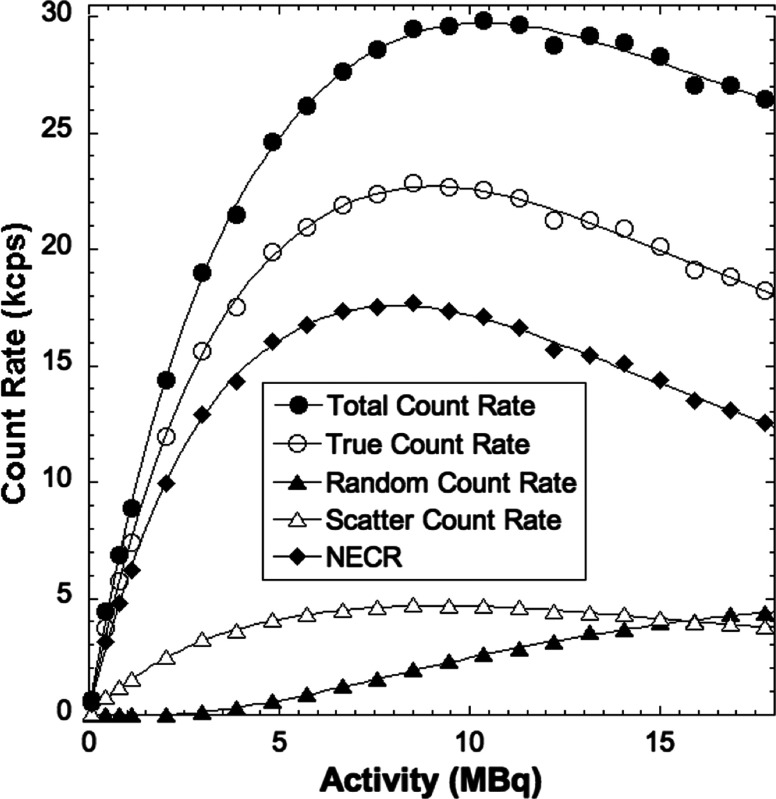
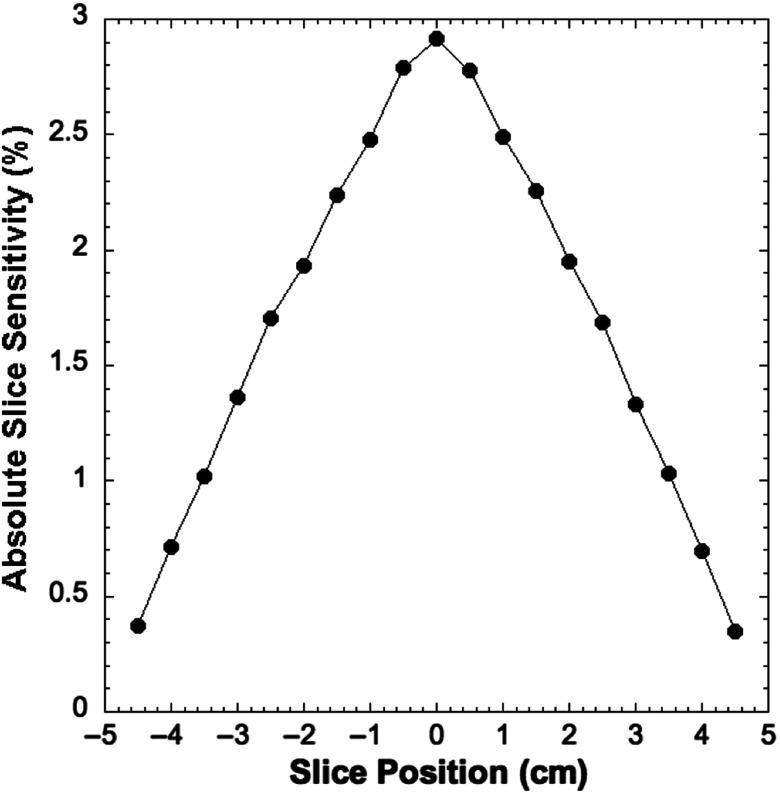
Table 1 shows the spatial resolution measured at the specified transaxial and axial positions in the PET scanner. The results are comparable to those reported for most preclinical PET scanners, but is notably reduced compared to the very high resolution system developed by Yang et al.36 Figure 6 shows results from the count rate performance testing. The peak NECR is 17.7 kcps at 8.5 MBq. The NECR at 10 MBq is 17 kcps. Figure 7 shows the absolute slice sensitivity as a function of position (peak sensitivity is 2.9%). System energy resolution is 16.5%; the scatter fraction is 17%. Figure 8 shows images of the NEMA NU 4-2008 quality assurance phantom. Results for uniformity measurements obtained from images of the uniform section of the phantom are shown in Table 2 (the maximum-to-mean ratio is 1.19; the minimum-to-mean ratio is 0.76). Tables 3 and 4 show the results from measurements of RC from the hot rod section of the phantom and measurements of SORs from the cold cylinder section, respectively. Figure 9 shows an image of the custom MRI phantom. Image homogeneity is 99% with a ghosting ratio of 0.0054. The SNR is 95; spatial resolution is . There were no detectable differences between the performance of the coil with or without the PET scanner present. Figure 10 shows MRI, PET, and coregistered images of the micro-hot-rod phantom. There were no discernable differences between PET images of the phantom in the extracted and inserted positions.
Table 1.
Report for spatial resolution measurements (FBP) [FWHM/full-width-at-tenth-maximum (mm)].
| 5 mm | 10 mm | 15 mm | 25 mm | 50 mm | |
|---|---|---|---|---|---|
| At axial FoV center | |||||
| Radial | 1.73/3.7 | 1.81/3.9 | 1.99/4.2 | 2.35/4.8 | 2.81/5.9 |
| Tangential | 1.70/3.3 | 1.72/3.4 | 1.75/3.7 | 1.78/3.9 | 1.78/4.0 |
| Axial | 1.72/3.8 | 1.78/4.1 | 1.80/4.0 | 1.83/4.3 | 1.84/4.5 |
| At ¼ axial FoV from center | |||||
| Radial | 1.70/3.8 | 1.80/3.7 | 1.96/4.3 | 2.37/4.9 | 2.88/5.8 |
| Tangential | 1.71/3.3 | 1.70/3.6 | 1.76/3.8 | 1.79/4.0 | 1.76/4.2 |
| Axial | 1.73/3.9 | 1.77/4.0 | 1.82/4.2 | 1.81/4.5 | 1.82/4.7 |
Fig. 6.
Count rate as a function of radioactivity in the rat-like phantom.
Fig. 7.
Sensitivity as a function of axial position8 PET images of the NEMA NU 4-2008 image quality phantom reconstructed with OSEM.
Fig. 8.
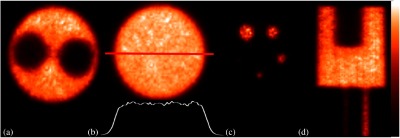
PET images of the NEMA NU 4-2008 image quality phantom reconstructed with OSEM. (a) Cold cylinder section, (b) uniform section (intensity profile through the center of the image is shown), (c) hot-rod section, and (d) coronal view of the PET image of the phantom.
Table 2.
Report for uniformity measurement () [ratio with mean].
| Mean | Maximum | Minimum | %STD | |
|---|---|---|---|---|
| Uniformity | 7.40 | 8.8 [1.19] | 5.6 [0.76] | 6.3 |
Table 3.
Report for RC measurements.
| Diam. | 1 mm | %STD | 2 mm | %STD | 3 mm | %STD | 4 mm | %STD | 5 mm | %STD |
|---|---|---|---|---|---|---|---|---|---|---|
| RC | 0.18 | 20.0 | 0.42 | 17.0 | 0.71 | 12.0 | 0.81 | 9.0 | 0.90 | 8.0 |
Table 4.
Report for accuracy of corrections measurements.
| Region | %SOR | %STD |
|---|---|---|
| Water-filled cylinder | 7.0 | 6.7 |
| Air-filled cylinder | 4.8 | 6.9 |
Fig. 9.
MRI image quality phantom. (a) Picture of the phantom showing sizes and separation of structures (dimensions in millimeters) and (b) image of the phantom.
Fig. 10.
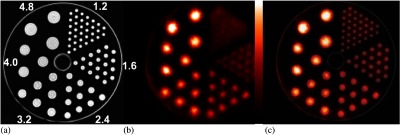
Images of the micro-hot-rod phantom with the PET-MRI insert in the inserted position. (a) MRI image (rod diameters in mm are shown), (b) PET image, and (c) registered MRI-PET image.
4. Discussion
Sequential PET/MRI systems have been constructed by either combining two clinical scanners for human imaging37,38 or by combining two preclinical scanners.39–41 In this investigation, we constructed and tested a sequential, preclinical PET/MRI system consisting of an MR-compatible, preclinical PET scanner constructed at West Virginia University combined with a specialized MRI coil designed for use with a clinical 3 T MRI scanner. Specifically, the MR-compatible PET scanner consists of a dodecagonal ring of cooled, SiPM-based detector modules. The MRI component of the system utilizes a 12 cm-diameter birdcage transmit/receive coil designed for use with a Siemens 3 T Verio scanner.
Results from NEMA NU 4-2008 testing of the PET component demonstrate that its performance is comparable to most existing preclinical scanners. For example, the spatial resolution (radial, tangential and axial) of the PET component of the WVU-PET/MRI is FWHM (FBP) at 5 mm from center (Table 1). These results compare well with other preclinical PET systems, which have reported spatial resolution ranging from FWHM to FWHM at 5 mm from center,2 and other PET scanners designed for use with MRIs.13–27 For example, the system constructed by Stortz et al.25 has a spatial resolution ranging from 1.17 mm (at scanner center) to 1.86 mm (15 mm from the scanner center). The PET-MRI insert developed by Mackewn et al.22 has reported spatial resolution of 2.2-mm FWHM 5 mm from the center of the FoV.
Figure 6 shows that the peak NECR is 17.7 kcps at 8.5 MBq, which is substantially lower than many preclinical PET scanners, whose NECRs range from 31 to 592 kcps (at 42.5 MBq to 254.0 MBq) for the rat-like phantom2 but similar to the peak NECR of 22.0 kcps at 48.1 MBq reported by Gonzalez et al. for a scanner designed for use with a 15.2 T MRI scanner.42 The lower count rate performance produced by our system is partly due to the use of an early version of SiPMs, which have a microcell recovery time of 131 ns, and increased signal rise and decay times caused by the total capacitance of SiPMs. Count rate performance is also affected by the fact that our current data acquisition system digitizes the analog readout signals from all the SiPMs in the scanner, not just the ones involved in a coincident event. Processing of this large volume of data increases system dead time, reducing count rate efficiency. The absolute slice sensitivity profile shown in Fig. 7 exhibits the typical distribution for a point source as a function of axial position in a PET scanner. The peak sensitivity of 2.9% is consistent with other preclinical systems (1.2% to 6.7%2) that use a comparable energy window (350 to 650 keV). The peak sensitivity is also similar to other preclinical PET scanners designed for use with MRI. For example, Stortz et al.25 reported a peak sensitivity of 2.2% for their pre-clinical MR-compatible PET scanner.
Analysis of the images of the NEMA NU 4-2008 image quality phantom (Fig. 8) yielded results comparable to other preclinical PET scanners. For example, the uniformity test results (Table 2) show that the maximum-to-mean and minimum-to-mean ratios of 1.19 and 0.76 (respectively) are in the range reported for small animal PET scanners (maximum-to-mean range 1.14 to 1.75 and minimum-to-mean range 0.47 to 0.81), as is the uniformity standard deviation (STD) (6.3%).2 These findings are due to the care taken in normalizing SiPM gain and the effectiveness of the gap correction scheme, which limits streaking artifacts produced by incomplete angular sampling. The RCs for the small rod section of the phantom (Table 3) are similar to those reported for other preclinical PET scanners.2 For example, the RC for the 5-mm-diameter rod (0.90) is comparable to that reported other systems (0.75 to 1.02). The RC for the 1-mm-diameter rod (0.18) compares well with other small animal PET scanners (ranging from 0.11 to 0.27).2 These findings are due to the relatively high spatial resolution capabilities of the scanner. Finally, the SORs for the water and air-filled cylinders, 7.0% and 4.8%, respectively (Table 4), are in the middle of the range reported for other preclinical scanners (1.2% to 36.9% for the water-filled cylinder and −0.6% to 26.7% for the air-filled cylinder).2 These results could potentially be improved by the implementation of a model-based Compton scatter correction method.
Performance of the transmit/receive MRI coil measured from images of the two phantoms (Fig. 9) compares favorably with other coils. Specifically, Herrmann et al.10 reported a spatial resolution of 0.2 mm for a dedicated rat head coil with a linearly polarized Litz volume resonator design. These results are a product of careful design of the coil, intended to maximize performance for use with small objects that produce reduced loading factors. Images of the micro-hot-rod phantom (Fig. 10) demonstrate the ability of the system to obtain good quality MR and PET images with no discernable artifacts. The fact that there is no apparent cross-modality interference is likely due to a several factors. First, the PET scanner was constructed using SiPMs, the performance of which is known to be unaffected by magnetic fields. Additionally, communications with the control and image reconstruction computers located outside of the shielded MRI scanner room are accomplished via nonconducting fiber optic cables. Thus, the known problem of introduction of external RF into the scanner room is avoided. RF noise interference from the electronics located in the PET scanner gantry is minimized by electrical shielding of the external surfaces of the scanner enclosure. Finally, the physical separation of the two components makes mutual interactions very unlikely.
5. Conclusions
In summary, a combined PET scanner and transmit/receive MRI coil designed for small animal imaging in a clinical 3 T MRI scanner was constructed and tested. The performance of the system is appropriate for the imaging of rats and perhaps, for some applications, mice. Thus, dual modality, preclinical imaging can be made available to researchers that do not have access to dedicated small animal MRI scanners by temporally making a clinical scanner capable of producing preclinical, multimodality images. Perhaps the most unique aspect of the system is its geometry. Unlike most comparable devices, the WVU-PET/MRI-insert physically separates the MRI coil from the PET scanner. The advantages to this geometry are the relative simplicity of the design, the lack of cross-modality interference, and the maximization of the imaging performance of both scanner components since no design compromises were necessary. While the benefits of a sequential scanner arrangement are demonstrated by the results of this investigation, there is at least one disadvantage, the inability to perform contemporaneous MRI and PET scans. Thus, this system is limited to applications that do not require simultaneity. Additionally, MR imaging of small rodents, especially mice, with this system may be challenging due to the limited spatial resolutions of the PET and MRI components. Finally, there are practical limitations to utilizing a clinical MRI system for scanning of small animals. Specifically, special considerations, such as isolation of the animal from the environment, will have to be made to safely transfer and scan the animals in a clinical environment. Furthermore, in most settings, economic considerations may limit utilization of the MRI for animal studies to off hours when there are limited clinical demands on the scanner. Continued refinement of the system includes application of MR image-derived, density maps for use in photon attenuation and Compton scatter correction, and modification of the PET event triggering system to improve count rate performance.
Acknowledgments
The authors thank Dr. Guangliang Ding, PhD, Department of Neurology, Henry Ford Hospital, Detroit, Michigan, for loan of the MRI quality assurance phantom. This work was supported in part by NIH/NIBIB (R01 EB007349).
Biography
Biographies for the authors are not available.
Disclosures
No conflicts of interest, financial or otherwise, are declared by the authors.
References
- 1.de Jong M., Mather S., Maina T., “Pre-clinical in vivo cancer, straightway to patients?” Q. J. Nucl. Med. Mol. Imaging 61(2), 145–152 (2017). [DOI] [PubMed] [Google Scholar]
- 2.Goertzen A. L., et al. , “NEMA NU 4-2008 comparison of pre-clinical PET imaging systems,” J. Nucl. Med. 53(8), 1300–1309 (2012). 10.2967/jnumed.111.099382 [DOI] [PMC free article] [PubMed] [Google Scholar]
- 3.Chatziioannou A. F., et al. , “Performance evaluation of microPET: a high-resolution lutetium oxyorthosilicate PET scanner for animal imaging,” J. Nucl. Med. 40(7), 1164–75 (1999). [PMC free article] [PubMed] [Google Scholar]
- 4.Rudin M., “MR microscopy on rats in vivo at 4.7 T using surface coils,” Magn. Reson. Med. 5(5), 443–448 (1987). 10.1002/(ISSN)1522-2594 [DOI] [PubMed] [Google Scholar]
- 5.Pentney R. J., et al. , “Small animal magnetic resonance imaging: a means of studying the development of structural pathologies in the rat brain,” Alcohol. Clin. Exp. Res. 17(6), 1301–1308 (1993). 10.1111/acer.1993.17.issue-6 [DOI] [PubMed] [Google Scholar]
- 6.Rehwald W. G., et al. , “Techniques for high-speed cardiac magnetic resonance imaging in rats and rabbits,” Magn. Reson. Med. 37(1), 124–130 (1997). 10.1002/(ISSN)1522-2594 [DOI] [PMC free article] [PubMed] [Google Scholar]
- 7.Zou J., et al. , “In vivo visualization of endolymphatic hydrops in guinea pigs: magnetic resonance imaging evaluation at 4.7 tesla,” Ann. Otol. Rhinol. Laryngol. 112(12), 1059–1065 (2003). 10.1177/000348940311201212 [DOI] [PubMed] [Google Scholar]
- 8.Henkelman R. M., van Heteren J. G., Bronskill M. J., “Small animal imaging with a clinical magnetic resonance imager,” Magn. Reson. Med. 4(1), 61–66 (1987). 10.1002/(ISSN)1522-2594 [DOI] [PubMed] [Google Scholar]
- 9.Krämer M., et al. , “Self-gated cardiac cine MRI of the rat on a clinical 3 T MRI system,” NMR Biomed. 28(2), 162–167 (2015). 10.1002/nbm.3234 [DOI] [PubMed] [Google Scholar]
- 10.Herrmann K. H., et al. , “Possibilities and limitations for high resolution small animal MRI on a clinical whole-body 3T scanner,” Magn. Reson. Mater. Phys. Biol. Med. 25(3), 233–244 (2012). 10.1007/s10334-011-0284-5 [DOI] [PubMed] [Google Scholar]
- 11.Ittrich H., et al. , “In vivo magnetic resonance imaging of iron oxide-labeled, arterially-injected mesenchymal stem cells in kidneys of rats with acute ischemic kidney injury: detection and monitoring at 3T,” J. Magn. Reson. Imaging 25(6), 1179–1191 (2007). 10.1002/(ISSN)1522-2586 [DOI] [PubMed] [Google Scholar]
- 12.Mayer D., et al. , “In vivo fiber tracking in the rat brain on a clinical 3T MRI system using a high strength insert gradient coil,” Neuroimage 35(3), 1077–1085 (2007). 10.1016/j.neuroimage.2007.01.006 [DOI] [PMC free article] [PubMed] [Google Scholar]
- 13.Raylman R. R., et al. , “Simultaneous MRI and PET imaging of a rat brain,” Phys. Med. Biol. 51(24), 6371–6379 (2006). 10.1088/0031-9155/51/24/006 [DOI] [PubMed] [Google Scholar]
- 14.Wu Y., et al. , “PET performance evaluation of an MR-compatible PET insert,” IEEE Trans. Nucl. Sci. 56(3), 574–580 (2009). 10.1109/TNS.2009.2015448 [DOI] [PMC free article] [PubMed] [Google Scholar]
- 15.Maramraju S. H., et al. , “Small animal simultaneous PET/MRI: initial experiences in a 9.4 T microMRI,” Phys. Med. Biol. 56(8), 2459–2480 (2011). 10.1088/0031-9155/56/8/009 [DOI] [PubMed] [Google Scholar]
- 16.Pichler B. J., et al. , “Performance test of an LSO-APD detector in a 7-T scanner for simultaneous PET/MRI,” J. Nucl. Med. 47(4), 639–647 (2006). [PubMed] [Google Scholar]
- 17.Gazioso R., et al. , “APD-based PET detector for simultaneous PET/MR imaging,” Nucl. Instrum. Methods Phys. Res. A 569, 301–305 (2006). 10.1016/j.nima.2006.08.121 [DOI] [Google Scholar]
- 18.Schulz V., et al. , “SiPM based pre-clinical PET/MR insert for a human 3T MR: first imaging experiments,” in IEEE Nuclear Science Symp. Conf. Record, pp. 4467–4469 (2011). 10.1109/NSSMIC.2011.6152496 [DOI] [Google Scholar]
- 19.Kwon S. I., et al. , “Development of small-animal PET prototype using silicon photomultiplier (SiPM): initial results of phantom and animal imaging studies,” J. Nucl. Med. 52(4), 572–579 (2011). 10.2967/jnumed.110.079707 [DOI] [PubMed] [Google Scholar]
- 20.Hong K. J., et al. , “A prototype MR insertable brain PET using tileable GAPD arrays,” Med. Phys. 40(4), 042503 (2013). 10.1118/1.4793754 [DOI] [PubMed] [Google Scholar]
- 21.Thompson C. J., et al. , “Development of a PET scanner for simultaneously imaging small animals with MRI and PET,” Sensors (Basel) 14(8), 14654–14671 (2014). 10.3390/s140814654 [DOI] [PMC free article] [PubMed] [Google Scholar]
- 22.Mackewn J. E., et al. , “PET performance evaluation of a re-clinical SiPM-based MR-compatible PET scanner,” IEEE Trans. Nucl. Sci. 62(3), 784–790 (2015). 10.1109/TNS.2015.2392560 [DOI] [Google Scholar]
- 23.Weissler B., et al. , “Digital pre-clinical PET/MRI insert and initial results,” IEEE Trans. Med. Imaging 34(11), 2258–2270 (2015). 10.1109/TMI.2015.2427993 [DOI] [PubMed] [Google Scholar]
- 24.Du J., et al. , “Characterization of large-area SiPM Array for PET applications,” IEEE Trans. Nucl. Sci. 63(1), 8–16 (2016). 10.1109/TNS.2015.2499726 [DOI] [PMC free article] [PubMed] [Google Scholar]
- 25.Stortz G., et al. , “Performance of a PET insert for high resolution small animal PET/MR imaging at 7T,” J. Nucl. Med. 59(3), 536–542 (2018). 10.2967/jnumed.116.187666 [DOI] [PubMed] [Google Scholar]
- 26.Yoon H. S., et al. , “Initial results of simultaneous PET/MRI experiments with an MRI-compatible silicon photomultiplier PET scanner,” J. Nucl. Med. 53(4), 608–614 (2012). 10.2967/jnumed.111.097501 [DOI] [PubMed] [Google Scholar]
- 27.Wehner J., et al. , “MR-compatibility assessment of the first preclinical PET-MRI insert equipped with digital silicon photomultipliers,” Phys. Med. Biol. 60(6), 2231–2255 (2015). 10.1088/0031-9155/60/6/2231 [DOI] [PubMed] [Google Scholar]
- 28.Raylman R. R., et al. , “A large area, silicon photomultiplier-based PET detector module,” Nucl. Instrum. Methods Phys. Res. A 735, 602–609 (2014). 10.1016/j.nima.2013.10.008 [DOI] [PMC free article] [PubMed] [Google Scholar]
- 29.Ahn S., et al. , “Gap compensation during PET image reconstruction by constrained, total variation minimization,” Med. Phys. 39(2), 589–602 (2012). 10.1118/1.3673775 [DOI] [PubMed] [Google Scholar]
- 30.Smith M. F., et al. , “Positron emission mammography with tomographic acquisition using dual planar detectors: initial evaluations,” Phys. Med. Biol. 49(11), 2437–2452 (2004). 10.1088/0031-9155/49/11/022 [DOI] [PubMed] [Google Scholar]
- 31.NEMA, “Performance measurements of small animal positron emission tomographs,” NEMA NU 4-2008, National Electrical Manufacturers Association, Rosslyn, Virginia: (2008). [Google Scholar]
- 32.Sorgenfrei B. L., Edelstein W. A., “Optimizing MRI signal-to-noise ratio for quadrature unmatched RF coils: two preamplifiers are better than one,” Magn. Reson. Med. 36(1), 104–110 (1996). 10.1002/(ISSN)1522-2594 [DOI] [PubMed] [Google Scholar]
- 33.Loening A. M., Gambhir S. S., “AMIDE: a free software tool for multimodality medical image analysis,” Mol. Imaging 2(3), 131–137 (2003). 10.1162/153535003322556877 [DOI] [PubMed] [Google Scholar]
- 34.Cabello J., Ziegler S. I., “Advances in PET/MR instrumentation and image reconstruction,” Br. J. Radiol. 91(1081), 20160363 (2018). 10.1259/bjr.20160363 [DOI] [PMC free article] [PubMed] [Google Scholar]
- 35.American College of Radiology, “Phantom test guidance for use of the small MRI phantom for the MRI accreditation program,” American College of Radiology, Reston, Virginia: (2018). [Google Scholar]
- 36.Yang Y., et al. , “A prototype high-resolution small-animal PET scanner dedicated to mouse brain imaging,” J. Nucl. Med. 57(7), 1130–1135 (2016). 10.2967/jnumed.115.165886 [DOI] [PMC free article] [PubMed] [Google Scholar]
- 37.Zaidi H., et al. , “Design and performance evaluation of a whole-body Ingenuity TF PET-MRI system,” Phys. Med. Biol. 56(10), 3091–3106 (2011). 10.1088/0031-9155/56/10/013 [DOI] [PMC free article] [PubMed] [Google Scholar]
- 38.Nakamoto R., et al. , “Comparison of PET/CT with sequential PET/MRI using an MR-compatible mobile PET system,” J. Nucl. Med. 59(5), 846–851 (2018). 10.2967/jnumed.117.197665 [DOI] [PubMed] [Google Scholar]
- 39.Vrigneaud J. M., et al. , “Initial performance evaluation of a preclinical PET scanner available as a clip-on assembly in a sequential PET/MRI system,” Phys. Med. Biol. 63(12), 125007 (2018). 10.1088/1361-6560/aac4f7 [DOI] [PubMed] [Google Scholar]
- 40.Nagy K., et al. , “Performance evaluation of the small-animal nanoScan PET/MRI system,” J. Nucl. Med. 54(10), 1825–1832 (2013). 10.2967/jnumed.112.119065 [DOI] [PubMed] [Google Scholar]
- 41.Schmid A., et al. , “Feasibility of sequential PET/MRI using a state-of-the-art small animal PET and a 1 T benchtop MRI,” Mol. Imaging Biol. 15(2), 155–165 (2013). 10.1007/s11307-012-0577-8 [DOI] [PubMed] [Google Scholar]
- 42.González A. J., et al. , “A PET design based on SiPM and monolithic LYSO crystals: performance evaluation,” IEEE Trans. Nucl. Sci. 63(5), 2471–2477 (2016). 10.1109/TNS.2016.2522179 [DOI] [Google Scholar]


