Abstract
Object.
The sella turcica usually appears partially empty in MR images obtained from patients with chronic elevation of intracranial pressure. The authors measured the size of the sella turcica to determine if enlargement of the pituitary fossa explains the partially empty sella associated with pseudotumor cerebri.
Methods.
The medical records from 2005 to 2011 of a single neuro-ophthalmologist were searched to identify consecutive patients with pseudotumor cerebri. Age-matched control patients were selected from the same practice. The sella turcica and pituitary gland were measured on sagittal T1-weighted MR images.
Results.
Measurements were obtained for 48 patients with pseudotumor cerebri and 48 controls. The cross-sectional area of the sella was 38% greater in the patients with pseudotumor cerebri, with only a slight reduction in mean pituitary gland size.
Conclusions.
Chronic elevation of intracranial pressure is associated with bony enlargement of the sella turcica. Enlargement of the sella turcica contributes to its partially empty appearance.
Keywords: pituitary gland, idiopathic intracranial hypertension, papilledema, intracranial pressure, skull base, partially empty sella
Neuroimaging frequently reveals a partially empty sella in patients with pseudotumor cerebri.1,6,9,15 Several theories have been advanced to explain this finding. One explanation is that compression or atrophy of the pituitary gland occurs from herniation of the subarachnoid space into the sella turcica.12 Another possibility is that elevated intracranial pressure causes expansion of the sella turcica. We compared the size of the sella turcica in patients with pseudotumor cerebri and in normal control subjects to determine if bony enlargement of the sella plays a role in the phenomenon of the partially empty sella.
Methods
The institutional review board at the University of California, San Francisco, approved this study. The medical records from 2005 to 2011 of a single neuro-ophthalmologist (J.C.H.) were searched to identify 50 consecutive patients with pseudotumor cerebri. Each patient met the revised diagnostic criteria for pseudotumor cerebri.3 A contrast-enhanced MR image showed no abnormality that might produce elevated intracranial pressure. Increased intracranial pressure was confirmed by lumbar puncture performed with each patient in the lateral decubitus position. Age-matched control patients were selected from the same clinical practice.
Among 50 patients with pseudotumor cerebri, the quality of the MR study was inadequate in 3; therefore, these 3 patients were replaced by another 3 patients for whom better images were available. There were only 2 males among the 50 patients. Given that sex differences might represent a confounding factor, these 2 males were excluded from analysis, leaving a final cohort of 48 females with pseudotumor cerebri.
Forty-eight age-matched female patients from the same practice served as controls. One of the control patients had inadequate imaging and was replaced by another control subject. The controls had diagnoses that would not affect the size of the sella turcica, such as optic neuritis, thyroid eye disease, ischemic optic neuropathy, and amaurosis fugax. None had signs or symptoms of increased intracranial pressure or any MRI findings that might affect the size of the sella turcica (for example, intracranial mass).
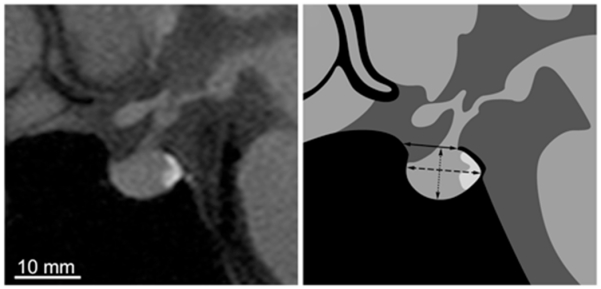
An electronic copy of the MR image reviewed at the time of each patient’s evaluation was obtained to measure the sella turcica. A scan of adequate quality was defined as a sagittal T1-weighted MR image showing boundaries of the sella turcica and containing the pituitary stalk. Imaging software (OsiriX) was used to outline the sella turcica on a single midline scan by tracing the boundary of the sphenoid sinus and dorsum sella (Fig. 1). The opening of the sella turcica was delineated by drawing a straight line from the anterior edge of the dorsum sella to the tuberculum sella. The cross-sectional area of the sella turcica was defined as the region beneath the opening. To measure the sella turcica depth, a perpendicular line was drawn from the opening to the bottom of the fossa. To measure sella turcica length, a line parallel to the opening was drawn from the most rostral to caudal point within the sella. The percentage of sella turcica filled by the pituitary was determined by tracing the contour of the gland and then dividing its area by the total sellar area.
Fig. 1.

Left: Midsagittal T1-weighted MR image of the sella turcica and pituitary gland from a control subject. Right: Drawing showing the dimensions that were measured to determine the opening (solid line), depth (dotted line), and length (dashed line) of the sella turcica. In this example, the sellar area = 70 mm2, opening = 8.4 mm, length = 11.4 mm, depth = 7.6 mm, and pituitary area = 64 mm2.
There was variation in the slice thickness and resolution of the MR images because imaging was performed at different facilities. For all subjects, the slice thickness was 3, 4, or 5 mm. There was no correlation between slice thickness and sellar size. To test the impact of slice thickness directly, a sagittal T1-weighted MR image was obtained at 2 and 5 mm in a subject with pseudotumor cerebri. Areal measurements of the sella turcica and pituitary gland performed on the 2- and the 5-mm images varied by 2%. This finding suggested that variation in slice thickness among subjects had only a minor impact on measurements.
To perform the measurements, all text was removed from the scans and they were viewed in random order. The person (S.E.K.) making the measurements was blinded to whether each image was from a patient with pseudotumor cerebri or a control subject. After the measurements were completed, the scan order was shuffled and the measurements were repeated a week later. The intraclass correlation coefficients for the measurements were 0.84 (sellar area), 0.79 (gland area), 0.61 (sellar opening), 0.70 (sellar length), and 0.76 (sellar depth). These values reflect excel· lent reproducibility for the area measurements and good reproducibility for the length measurements.7,8 The data reported are the averages of the 2 sets of measurements.
Results
Papilledema was present in 45 of the 48 patients at the time of MRI; 3 patients had optic atrophy. The patients ranged in age from 15 to 64 years, with a mean age of 35 ± 12 years. There was a mean weight of 99 ± 25 kg and a mean body mass index (BMI) of 37 ± 8.7 (severely obese). Their subarachnoid opening pressures ranged between 230 and 600 mm H2O, with a mean of 336 mm H2O. Symptoms of pseudotumor cerebri had been present for a median duration of 7.1 months when the MR image used for sellar measurements was obtained.
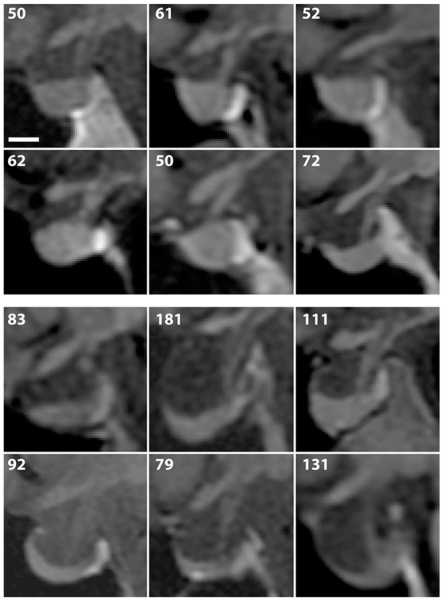
There was considerable variation in the appearance of the sella turcica among control subjects and the patients with pseudotumor cerebri (Fig. 2). However, it was evident by inspection that the pituitary gland tended to be small and crescent-shaped in patients with pseudotumor cerebri, making the sella look partially empty. The sella turcica also appeared physically enlarged.
Fig. 2.

Upper: Midsagittal T1-weighted MR images showing examples of the sella turcica in 6 control subjects. The number in the upper left of each image represents the sellar area in mm2. Lower: Midsagittal MR images obtained from 6 patients with pseudotumor cerebri, demonstrating variable enlargement and partially empty sellas. Bar = 5 mm.
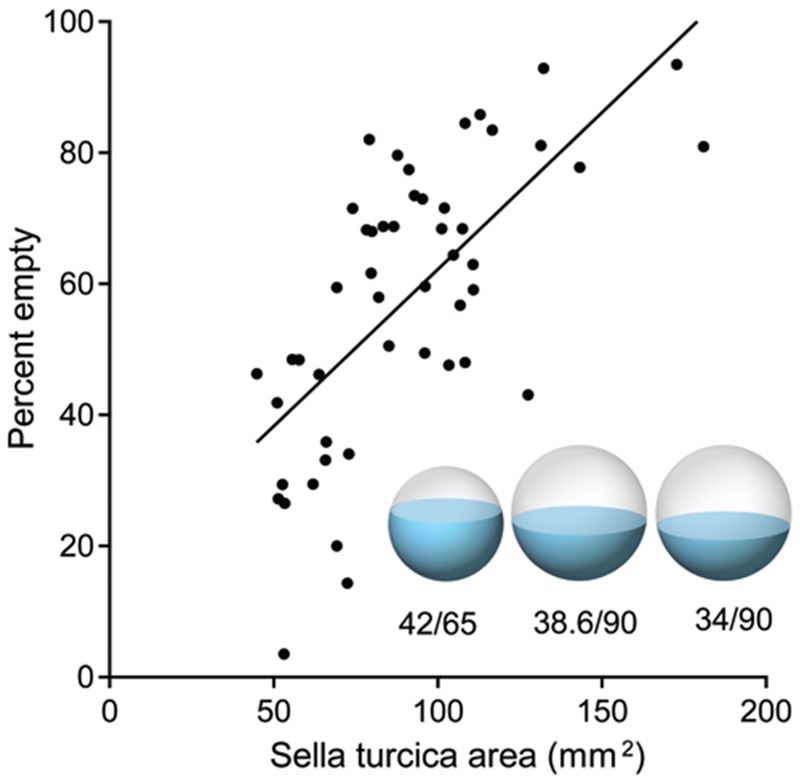
In control subjects, the median sellar area was 64 mm2 (interquartile distance 23 mm2) and the mean sellar area was 65 ± 16 mm2. In patients with pseudotumor cerebri, the median sellar area was 87 mm2 (interquartile distance 38 mm2) and the mean sellar area was 90 ± 30 mm2. Therefore, the mean sellar area was 38% greater in patients with pseudotumor cerebri than in controls (2-tailed t-test, p < 0.0001). The 95% confidence interval (82–99 mm2) for patients with pseudotumor cerebri did not overlap the interval (61–70 mm2) for control subjects. In patients with pseudotumor cerebri, there was a strong correlation between the area of the sella turcica and the percentage of the sella that was empty (Pearson’s correlation coefficient, r = 0.67, p < 0.001; Fig. 3). This correlation implies that the sella turcica appears partially empty because of bony enlargement of the pituitary fossa.
Fig. 3.

Scatter plot of sella turcica area versus percent empty sella for patients with pseudotumor cerebri. There is a correlation (r = 0.67), suggesting that the sella appears partially empty because it is enlarged. The spheres represent the mean sellar volume, and blue shading indicates pituitary gland volume. The left sphere depicts control subjects, with a mean sellar area of 65 mm2 and a mean gland area of 42 mm2. The middle sphere shows pseudotumor patients, with a mean sellar area of 90 mm2. The gland size is a prediction, which was made by calculating the cross-sectional area (38.6 mm2) that would result if the gland volume in pseudotumor patients remained equal to that in controls. The right sphere shows pseudotumor patients with their actually measured gland cross-sectional area (34 mm2).
In control subjects, the sella turcica had the following dimensions: opening = 9.3 ± 1.7 mm, length = 9.9 ± 1.5 mm, and depth = 7.1 ± 1.2 mm. In patients with pseudotumor cerebri, the corresponding dimensions were 9.9 ± 1.7 mm, 11.0 ± 1.6 mm, and 8.7 ± 2.2 mm. The sellar opening was increased by 6%, the sellar length by 11%, and the sellar depth by 23%.
The mean gland area was 42 ± 13 mm2 (95% CI 39–46 mm2) in controls and 34 ± 14 mm2 (95% CI 30–38 mm2) in patients with pseudotumor cerebri. The pituitary gland had a smaller midline cross-sectional area in patients with pseudotumor cerebri (2-tailed t-test, p < 0.05). However, as explained below, this small reduction in gland cross-sectional area does not necessarily signify a reduction in gland volume.
Discussion
In 1968 Kaufman documented 5 women with direct or indirect evidence of raised intracranial pressure and an “empty” sella turcica.4 He suggested that if the diaphragm sella is incompetent, “prolonged elevation of CSF pressure will lead to remodeling and enlargement of the sella turcica.” Subsequently, it was reported that the majority (85%) of patients with pseudotumor cerebri have a partially empty sella, with a gland/sella cross-sectional area ratio of 0.44 compared with 0.82 in controls.15 But no prior study has actually reported the physical size of the sella turcica in patients with pseudotumor cerebri to determine if enlargement of the pituitary fossa explains why the gland/sella ratio is decreased.
Our data showed a mean 38% increase in the sagittal cross-sectional area of the sella turcica in pseudotumor cerebri patients compared with control subjects. This difference in area corresponds to a 63% increase in volume if the sella is modeled as a spherical chamber. The larger the sella, the emptier it appears (Fig. 3). This correlation supports Kaufman’s hypothesis that the sella becomes enlarged by chronic elevation of intracranial pressure in patients with pseudotumor cerebri. Expansion occurs in all dimensions, but descent of the floor is most prominent.
Pressure from a growing pituitary tumor often causes expansion of the sella turcica. The bone of the floor is malleable, in part because it is extremely thin, measuring less than 1 mm.2,5,11 It is not unreasonable to suppose that elevated pressure exerted by cerebrospinal fluid, just as in the case of tumor, could cause expansion of the sella turcica. There is a precedent for remodeling of the sella turcica in response to an abnormal cerebrospinal fluid pressure gradient. In patients with chronic intracranial hypotension, the sella turcica actually becomes smaller in size.14
The primary goal in this study was to determine if the sella turcica becomes enlarged in patients with pseudotumor cerebri, but we were also interested in whether the pituitary gland becomes smaller. To address this question, the ideal approach would be to perform dedicated sellar imaging in each subject, using 1-mm slices and no gap between slices, followed by a volumetric reconstruction of the sella and the gland. Instead, we had to rely on cross-sectional areal measurements made from a single MR image passing through the middle of the sella. The pituitary gland appeared smaller in patients with pseudotumor cerebri (34 mm2) than in controls (42 mm2). It filled 38% (34/90 mm2) of the sella in pseudotumor cerebri patients and 65% (42/65 mm2) of the sella in controls.
It is important to note that even if the pituitary gland did not change in volume, it would fill a smaller fraction of the sella turcica in patients with pseudotumor merely as a result of sellar enlargement. In three dimensions, the gland forms a spherical segment, neglecting for a moment the concavity of the surface induced by pseudotumor cerebri. Keeping the gland’s spherical segment volume constant, we calculated that enlargement of the sella from a cross-sectional area of 65 mm2 to 90 mm2 would reduce the gland’s cross-sectional prohle from 42 to 38.6 mm2 (Fig. 3). In fact, the mean gland area in our pseudotumor cerebri population was 12% smaller (34 mm2) than the value (38.6 mm2) predicted by an assumption of no gland shrinkage. This result indicates that the mean gland size may be smaller in patients with pseudotumor cerebri, perhaps because of compression or atrophy, but the reduction is slight. The accuracy of this calculation is limited because the pituitary fossa is not actually spherical and the gland usually develops a concave upper profile in patients with pseudotumor cerebri.
The control subjects in this study were matched for sex and age, but not for weight. Therefore, we cannot exclude the possibility that excessive weight itself, rather than raised intracranial pressure, is responsible for enlargement of the sella turcica. We did not match the BMI of the patients and control subjects because severe obesity is relatively unusual among our clinic population; therefore, age- and BMI-matched control patients were not readily available. Moreover, obese patients without papilledema have slightly increased intracranial pressure, so the inclusion of such individuals as controls might have introduced a confounding factor.13
In some patients with pseudotumor cerebri, the sella appears nearly empty and it is a challenge even to identify a gland within the pituitary fossa. In such individuals, MRI seems to provide direct evidence that the pituitary gland has become reduced in size. However, the pituitary gland is more difficult to visualize with MRI when it becomes thinned and flattened against the floor of an enlarged sella, so its size may be underestimated. From our measurements, the partially empty sella in patients with pseudotumor cerebri appears to be mostly caused by enlargement of the bony sella, although there may be a small contribution from compression or atrophy of the pituitary gland. This explains why tests of pituitary function in patients with pseudotumor cerebri usually show no deficiency.10
Conclusions
Our results indicate that chronic elevation of intracranial pressure causes expansion of the pituitary fossa. Little or no reduction occurs in the size of the actual gland. Because the pituitary tissue becomes molded to the walls of a larger container, the sella turcica appears partially empty.
Acknowledgments
We thank Pratik Mukherjee and David Norman, Department of Neuroradiology, University of California, San Francisco, for their advice regarding interpretation of the neuroradiological data.
Disclosure
This work was supported by Grant Nos. EY10217 (J.C.H.) and EY02162 (Beckman Vision Center) from the National Eye Institute and by Research to Prevent Blindness.
Abbreviation used in this paper:
- BMI
body mass index
Footnotes
This paper was presented in abstract form at the 39th Annual Meeting of the North American Neuro-Ophthalmology Society held in Snowbird, Utah, on February 9–14, 2013, and is scheduled to be presented at the Annual Meeting of the American Academy of Ophthalmology held in New Orleans, Louisiana, on November 15–16, 2013.
References
- 1.Brodsky MC, Vaphiades M: Magnetic resonance imaging in pseudotumor cerebri. Ophthalmology 105:1686–1693, 1998 [DOI] [PubMed] [Google Scholar]
- 2.Davis PC, Hoffman JC Jr, Spencer T, Tindall GT, Braun IF MR imaging of pituitary adenoma: CT, clinical, and surgical correlation. AJR Am J Roentgenol 148:797–802, 1987 [DOI] [PubMed] [Google Scholar]
- 3.Friedman DI, Jacobson DM: Diagnostic criteria for idiopathic intracranial hypertension. Neurology 59:1492–1495, 2002 [DOI] [PubMed] [Google Scholar]
- 4.Kaufman B: The “empty” sella turcica—a manifestation of the intrasellar subarachnoid space. Radiology 90:931–941, 1968 [DOI] [PubMed] [Google Scholar]
- 5.Lazaridis N, Natsis K, Koebke J, Themelis C: Nasal, sellar, and sphenoid sinus measurements in relation to pituitary surgery. Clin Anat 23:629–636, 2010 [DOI] [PubMed] [Google Scholar]
- 6.Maralani PJ, Hassanlou M, Torres C, Chakraborty S, Kingstone M, Patel V, et al. : Accuracy of brain imaging in the diagnosis of idiopathic intracranial hypertension. Clin Radiol 67:656–663, 2012 [DOI] [PubMed] [Google Scholar]
- 7.Morey RA, Selgrade ES, Wagner HR II, Huettel SA, Wang L, McCarthy G: Scan-rescan reliability of subcortical brain volumes derived from automated segmentation. Hum Brain Mapp 31:1751–1762, 2010 [DOI] [PMC free article] [PubMed] [Google Scholar]
- 8.Nandigam RN, Chen YW, Gurol ME, Rosand J, Greenberg SM, Smith EE: Validation of intracranial area as a surrogate measure of intracranial volume when using clinical MRI. J Neuroimaging 17:74–77, 2007 [DOI] [PubMed] [Google Scholar]
- 9.Silbergleit R, Junck L, Gebarski SS, Hatfield MK: Idiopathic intracranial hypertension (pseudotumor cerebri): MR imaging. Radiology 170:207–209, 1989 [DOI] [PubMed] [Google Scholar]
- 10.Thurtell MJ, Bruce BB, Newman NJ, Biousse V: An update on idiopathic intracranial hypertension. Rev Neurol Dis 7:e56–e68, 2010 [PMC free article] [PubMed] [Google Scholar]
- 11.Weisberg LA, Numuguchi Y: Neuroimaging in neuroendocrine diseases. Neurol Clin 4:783–800, 1986 [PubMed] [Google Scholar]
- 12.Wessel K, Thron A, Linden D, Petersen D, Dichgans J: Pseudotumor cerebri: clinical and neuroradiological findings. Eur Arch Psychiatry Neurol Sci 237:54–60, 1987 [DOI] [PubMed] [Google Scholar]
- 13.Whiteley W, Al-Shahi R, Warlow CP, Zeidler M, Lueck CJ: CSF opening pressure: reference interval and the effect of body mass index. Neurology 67:1690–1691, 2006 [DOI] [PubMed] [Google Scholar]
- 14.Yoon MK, Parsa AT, Horton JC: Skull thickening, paranasal sinus expansion, and sella turcica shrinkage from chronic intracranial hypotension. Case report. J Neurosurg Pediatr 11: 667–672, 2013 [DOI] [PubMed] [Google Scholar]
- 15.Yuh WT, Zhu M, Taoka T, Quets JP, Maley JE, Muhonen MG, et al. : MR imaging of pituitary morphology in idiopathic intracranial hypertension. J Magn Reson Imaging 12:808–813, 2000 [DOI] [PubMed] [Google Scholar]


