

SUMMARY
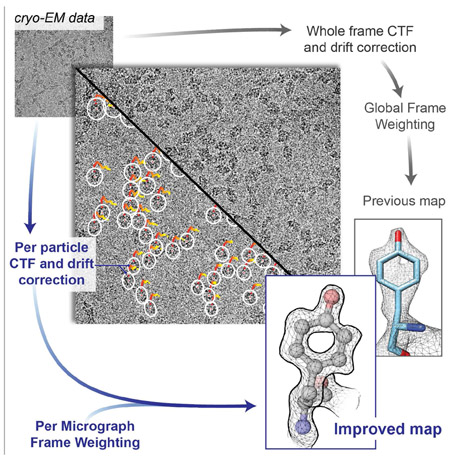
The advent of direct electron detectors has enabled the routine use of single particle cryo-EM approaches to determine structures of a variety of protein complexes at near-atomic resolution. Here, we report the development of methods to account for local variations in defocus and beam-induced drift, and the implementation of a data-driven dose compensation scheme that significantly improves the extraction of high-resolution information recorded during exposure of the specimen to the electron beam. These advances enable determination of a cryo-EM density map for β-galactosidase bound to the inhibitor PETG where the ordered regions are resolved at a level of detail seen in X-ray maps at ~ 1.5 Å resolution. Using this density map in conjunction with constrained molecular dynamics simulations provides a measure of the local flexibility of the non-covalently bound inhibitor and offers further opportunities for structure-guided inhibitor design.
Keywords: single particle cryo-EM, drift correction, radiation damage, drug discovery, high resolution protein structure
eTOC Blurb
Bartesaghi et al. report methods to account for radiation damage and local changes in defocus and image drift, enabling visualization of atomic resolution features in a cryo-EM density map of inhibitor-bound β-galactosidase, and measures of local flexibility of the bound inhibitor using constrained molecular dynamics simulations.
INTRODUCTION
Improvements in the detective quantum efficiency (DQE) of direct electron detectors combined with their ability to operate in movie mode, have created unique opportunities for the development of computational strategies in single-particle cryo-EM capable of achieving unprecedented resolutions. By harnessing the time-resolved information contained in movie frames, these techniques have managed to overcome fundamental resolution barriers inherent to imaging biological samples using high-energy electrons. There are three main areas where improvements in data processing have been made thus far: 1) strategies to account for beam-induced motion or stage-drift during the electron exposure (Abrishami et al., 2015; Bartesaghi et al., 2014; Brilot et al., 2012; Grant and Grigorieff, 2015; Rubinstein and Brubaker, 2015; Scheres, 2014; Zheng et al., 2017), 2) strategies to improve the accuracy of CTF estimation using data from individual frames (Bartesaghi et al., 2014; McMullan et al., 2015; Rohou and Grigorieff, 2015; Zhang, 2016), and 3) development of dose weighting schemes to compensate for radiation damage effects (Grant and Grigorieff, 2015; Rubinstein and Brubaker, 2015; Scheres, 2014; Zheng et al., 2017). Despite these advances, the accurate estimation of CTF parameters and alignment of movie frames on a per-particle basis remains a challenging problem due to the combination of poor signal-to-noise ratios (SNR) resulting from the low accumulated doses in each frame (typically below one electron per Å2), and the small image area occupied by single particles. In addition, the inability of existing dose compensation strategies to capture the highest resolution data recorded during the earliest part of the exposure remains a major resolution-limiting factor (Glaeser, 2016).
A second aspect of our work addresses the level of precision in determining the structures of ligands bound non-covalently to proteins. Of the 63 entries presently reported in the EM Data Bank of structures of protein complexes smaller than 1 MDa at resolutions better than 3.5 Å, 22 entries also report visualization of bound ligands (emdatabank.org). Interestingly, in almost all of these high resolution cryo-EM density maps that include densities for bound ligands, the latter densities are typically at lower resolution than in ordered regions of the protein. Establishing the most effective way of utilizing structural information from deposited density maps is critical when cryo-EM structures are used in the context of structure-guided drug design, especially when no comparable structures are available from X-ray crystallography. If the lower resolution of the bound inhibitor densities arises solely because of the lower overall map resolutions, one approach to achieve better ligand definition would be to improve the resolution of the overall map to resolutions much higher than 2 Å so that bound inhibitors could be visualized at resolutions in the range of ~ 2 Å – 2.5 Å, which are necessary for their use in rational drug design. Alternatively, if the resolution in cryo-EM density maps were limited primarily by intrinsic thermal flexibility of the non-covalently bound inhibitors, alternative computational approaches would need to be explored to extract useful additional structural information on the inhibitor for purposes of improving compound efficacy.
In the work presented here, we report the development of advanced image processing methods that enable us to further improve the resolution of the cryo-EM density map of β-galactosidase. We also take advantage of the improved resolution to extract additional information on the local flexibility of the bound inhibitor using molecular dynamics simulations.
RESULTS
Per-particle analysis and dose weighting
To evaluate whether map resolutions could indeed be improved further and to test their effect on improving ligand resolution, we carried out structural analysis of the enzyme β-galactosidase bound to the inhibitor PETG for which we had previously reported a structure at ~ 2.2 α resolution (Bartesaghi et al., 2015). The density for the inhibitor in this map is weaker than that of residues in the active site and only adequate to position it approximately in its binding site. To improve overall map resolution, we implemented an approach with three distinct elements: 1) a strategy for local, per-particle drift correction to follow the trajectory of individual particles throughout the exposure to the electron beam, 2) the use of local defocus estimation to track spatial CTF variations across the field of view, and most importantly, 3) the use of a data-driven dose compensation scheme that optimally weights the contribution of movie frames on a per micrograph basis. All underlying image alignment operations were carried out using a completely rewritten version of the program FREALIGN (Grigorieff, 2016) that uses a matched filter (McDonough and Whalen, 1995) to align particle images.
The use of methods for local drift correction combined with local CTF estimation provides assessment of the movement of each particle during the exposure in addition to a measure of the defocus and astigmatism variation across the image (Figures 1a-c). From these measurements, we derived a correlation score for every particle in every frame (an indicator of the quality of the match between the raw movie data and re-projections of the 3D reference), and carried out statistical analysis of the scores and their variances. Even though the individual measurements are noisy, we noticed that averaging score values across all particles in a micrograph (Figure 1d), consistently produced characteristic bell-shaped curves that peaked towards the early part of the exposure (where the SNR at high resolution is maximized), followed by a continuous decay towards the end of the exposure consistent with the onset of radiation damage (Baker et al., 2010). Interestingly, analysis of the average score distribution across all micrographs in the dataset showed a higher variance at the beginning of the exposure (Supplementary Figure 1a), revealing considerable variations in image quality during the early frames in contrast with the more systematic effects of radiation damage observed in later frames. For example, we noted that micrographs with large initial movements had lower scores during the early frames (Supplementary Figure 1b), compared to micrographs that had less drift at the beginning of the exposure. This is consistent with the fact that rapid specimen movement that is faster than the frame rate can result in blurring of the high-resolution information contained within a single frame. Taken together, these observations indicate that per-micrograph score averages are consistent indicators of image quality, and as such can be used to weight the contribution of individual frames allowing to more effectively capture the high-resolution information present within the exposure.
Figure 1. Per-particle drift movement and local CTF estimation.

a) Trajectories of individual particles from micrograph EMD-2984_0925 start at the center of the white ellipsoidal markers and range from red (first frame) to yellow (last frame). Defocus changes across the field of view are typically small and were encoded as follows to improve visualization: mean ellipse radius is proportional to the average defocus (DF1+DF2)/2 and ellipticity is proportional to the amount of astigmatism difference measured at the location of each particle with respect to the global astigmatism value. Scale bar is 50nm. b) Zoomed-in view of selected particles indicated by arrowheads in (a). c) Global drift trajectory obtained by averaging all local particle trajectories in this micrograph. d) Average FREALIGN score computed over all particles in each frame plotted as a function of the cumulative electron dose. High scores are shown in red and low scores in blue. e) Corresponding 2D weights showing the relative contribution of each frame to the weighted average as a function of spatial frequency (color scheme as in (d)).
Related to Supplementary Figure 1.
Resolution improvements with proposed correction scheme
To verify the effectiveness of each component in our processing strategy, we applied the local defocus, local drift and dose weighting strategies separately and individually assessed improvement in map quality for each step, with respect to a reconstruction obtained using global motion correction, global CTF estimation and the full exposure. Fourier Shell Correlation (FSC) values between half-maps provide an internally consistent measure to assess relative improvements in map quality achieved with each of these steps. Using this criterion, we show that there are measurable improvements in resolution of 0.07 Å, 0.09 Å, and 0.12 Å when we apply corrections for local defocus, local drift and dose weighting, respectively (Supplementary Figure 1c). The fact that changes observed in the FSCs are all above the highest resolution used for refinement (see Method Details), validates the use of this metric as a reliable indicator of map quality that is not prone to overfitting. The improvements are cumulative, and combining all three components resulted in a significantly improved density map with an overall resolution improvement of 0.4 Å (Figure 2, Supplementary Figure 1d and Video 1). The new map shows delineation of the contours for non-H atoms as well as clear density for side chains such as lysine and arginine that faithfully follow the kinks in the extended side chains.
Figure 2. Cryo-EM map and visualization of atomic resolution features.

a-b) Overview of β-galactosidase tetramer (a) and detailed view of asymmetric unit (b). c) Gallery of selected residues for each of the 20 amino acids showing delineation of the contours for non H-atoms as discrete, punctate features and clear density for side chains such as lysine and arginine that faithfully follow the kinks in the extended side chains.
Related to Supplementary Figures 1-4 and Video 1.
A qualitative approach to assessing map quality is shown in Supplementary Figure 2, where we show a side-by-side comparison of a 2Fo-Fc map of β-galactosidase computed from the X-ray structure reported at 1.7Å resolution (PDB ID 1DP0), and the present map. The new map compares favorably against the 1.7Å resolution X-ray structure, as evidenced by visualization of the density in a stretch of residues (451-457, Supplementary Figure 2a) and examples of the 20 amino acids (Supplementary Figure 2b). Comparison of cryo-EM maps (which are derived without any use of an atomic model) and 2Fo-Fc maps (derived using model phases) can lead to an underestimate of the resolution of the cryo-EM maps because knowledge of exact phase information from the model eliminates noise that is present when phases are obtained experimentally, as is the case with cryo-EM maps. To make a more meaningful comparison, we also show examples of X-ray crystallographic maps obtained using single-wavelength anomalous diffraction that only use experimental phase information and are not biased by phases derived from an atomic model. Inspection of density contours for non-H atoms in these maps shows that the highest resolution features observed in our new cryo-EM density map of β-galactosidase are at higher resolution than in the 1.8 Å map of sedolisin (Wlodawer et al., 2017), and compare favorably to those seen in the 1.5 Å electron density map of insulin (kindly provided by Dr. Alex Wlodawer; Supplementary Figure 3).
Next, we evaluated a variety of approaches to define the resolution of the map on a quantitative basis. Measures of resolution in cryo-EM maps typically involve the use of FSC plots, and we first provide some background to the different ways in which these plots are used. A commonly used FSC plot measures the self-consistency between two independent halves of the data and assigns the value at FSC of 0.143 as the nominal resolution (Rosenthal and Henderson, 2003). A different measure of map quality is to compute the FSC values between the map and the density calculated from the atomic model. The highest resolution where there is positive correlation could be construed as an upper limit of the information content present in the map, although the resolution at which the FSC has a value of 0.5 is generally used as an indication of map resolution. The map vs. model FSC plot is in principle a more absolute measure of resolution than the half-map FSC plots, but at high resolutions, there are factors that lead to differences between maps computed from atomic models and maps obtained from cryo-EM, including inaccuracies in the modelling of radiation damage effects and imprecisions in the determination of electron scattering factors (Grigorieff et al., 1996).
For both kinds of FSC plots, the mask used to pre-multiply the maps before computing the correlation values is an important factor that determines the profile of the FSC plot (Chen et al., 2013). Because the resolution is typically higher in the central and more ordered regions of the protein, a mask that includes the entire protein provides an average value that underestimates the resolution in the more ordered regions, while tighter shape masks that exclude the periphery of the protein provide a measure of the resolution of the more ordered regions. A particular and useful version of masking is to estimate local resolution in each sub-region of the map; programs such as RESMAP (Kucukelbir et al., 2014) or BLOCRES (Cardone et al., 2013) provide plots of this spatial variation in resolution. We estimated resolution of our map using all of these different measures. The half map FSC and the model vs. map FSC plots show values of ~1.9 Å (0.143-cutoff) and ~2.0 Å (0.5-cutoff) with masks that include the entire protein. Plots of the spatial variation of the FSC using BLOCRES show an average resolution of ~1.8 Å with values ranging from 2.2 Å to 1.4 Å across different regions of the protein (Supplementary Figure 1e), consistent with the visualization of distinctive atomic resolution features in the map.
Comparison with previous cryo-EM density maps
The density map presented in Figure 2 was obtained using the same data used to obtain the map we previously reported at 2.2 Å resolution (Bartesaghi et al 2015), publicly available in the EMPIAR database (entry 10061). Our original map was derived from ~ 40,000 particles, used whole-frame alignment and only an early portion of the exposure (frames 4-13) based on the determination that these frames had the greatest amount of high resolution information. More recently, Scheres and co-workers used the program RELION to obtain a 3D reconstruction from the same set of deposited images (Kimanius et al., 2016), but extracted almost three times as many particles (~110,000) from the same data set. They also applied a “particle-polishing” procedure (Scheres, 2014), which enables accounting for the movement of individual particles during exposure to the electron beam and implements a dose-weighting scheme using information derived from the relative contribution of each frame to the reconstruction. A direct comparison of the features observed in our earlier map and the map obtained by RELION (also at a reported resolution of 2.2 Å) is presented in Supplementary Figure 4, using the same panel of 20 amino acids presented in Figure 4 of (Bartesaghi et al., 2015) as a reference. There is no significant difference in the appearance of the two maps by this measure, which is reflective of the best-resolved regions of the map. However, model vs. map FSC plots (using an identical mask that includes the entire protein in both cases) shows an improvement in resolution of 0.2 Å in the RELION-derived map (Figure 3a). Factors contributing to the improvement of the RELION-derived map include the use of a much larger (~3x) particle stack, the corrections for local drift and relative weighting of frames present in the exposure, and potentially other aspects unique to the use of maximum likelihood methods during refinement and reconstruction (Cheng et al., 2015). Calculating FSC plots using the same mask as before shows that the resolution of the map we report here is improved by 0.5 Å compared to our previous map (Figure 3a). This quantitative improvement in resolution reported by the FSC curves of map vs. model is consistent with the enhanced appearance of the new density map as compared to the two earlier maps (Figure 3b).
Figure 4. Visualization of the active site at atomic resolution.

a) Overview of contoured cryo-EM map highlighting density for PETG (orange), Mg+ interacting residues (blue), and selected neighboring residues (purple). b) Density for the ligand and fitted coordinates showing features consistent with resolutions of ~ 3 Å - 3.5 Å. In panels (a) and (b), density shown for PETG is from the unsharpened map because sharpening of this region with the same B-factor as the rest of the protein leads to increased noise and artifacts due to its lower resolution. c) Density for residues in the active site interacting with Mg+ (green) and visualization of water molecules (highlighted in yellow). d) Close-up view of density map and fitted atomic model for selected active site residues showing delineation of atomic contours.
Related to Supplementary Video 1.
Figure 3. Comparison with density maps of β-galactosidase obtained from EMPIAR-10061.

a) FSC plots of map against atomic model for our original map (EMD-2984), the one obtained by Scheres and co-workers using RELION (EMD-4116) and the present map, showing resolution improvements compared with the original map of ~0.2 Å and ~0.5 Å1 (corresponding to 0.5-FSC cutoffs of ~2.6 Å, ~2.4 Å and ~2.1 Å, respectively). The mask used for the FSC calculations includes the entire protein and is available from the EMDB (entry EMD-4116). b) Side-by-side comparison of regions surrounding residues 957 (left) and 353 (right) from the three maps, showing corresponding improvements in map appearance.
Related to Supplementary Figure 4.
The highest resolution single-particle cryo-EM structure reported to date is that of glutamate dehydrogenase (GDH) at 1.8 Å resolution (Merk et al., 2016). While using a conservative mask that includes the entire β-galactosidase protein yields a similar nominal resolution, the present map displays features at significantly higher resolution in the ordered regions of the protein (Supplementary Figure 5). Besides the use of our improved image processing strategy, other factors that may have contributed to the improvement in resolution include the fact that β-galactosidase is larger in size (463kDa vs.334kDa), is more structurally homogeneous compared to the conformationally dynamic GDH, and the fact that more asymmetric units were used for the reconstruction (601,284 vs. 130,908 for GDH).
Quantitative evaluation of inhibitor flexibility
A major motivation in developing methods to improve the resolution of the density map of PETG-bound β-galactosidase was to test whether it could lead also to a significant improvement in resolution of the density for the non-covalently bound inhibitor. Unlike crystal structures that may promote more ordered arrangement of bound ligands, this example of an inhibitor bound to its protein target in the aqueous phase is closer to the physiological context of drug binding. However, as shown in Figure 4, despite the visualization of almost all residues in the active site of the enzyme (Figure 4a) at atomic resolution (Figures 4c-d), density for the inhibitor has features whose visual appearance is consistent with much lower resolutions in the range of ~ 3 Å - 3.5 Å (Figure 4b). This suggests that the PETG molecule is likely disordered relative to the rest of the nearby residues in the active site.
To gain more insights into the mode of PETG binding, we took advantage of the constraints provided by the cryo-EM density map to obtain a quantitative measure of inhibitor flexibility. Traditional molecular dynamics simulations carried out solely with the coordinates of the structure and force fields can be used to characterize the local fluctuation at each atomic position of the inhibitor. In this “unconstrained” mode of simulation, the median fluctuation for residues within 5 Å of the active site is ~ 0.39 Å, while median fluctuation for all atoms in PETG is slightly higher at ~ 0.42 Å (Figure 5a). Carrying out the same molecular dynamics simulation by restricting the range of conformational variation of the ligand to those that are allowed within the spread of the experimental cryo-EM density provides an estimate for the local flexibility that also takes the density map into account. These calculations show that the fluctuation amplitudes for residues within 5 Å of the binding site and atoms of PETG are lowered significantly, to distributions with median fluctuation values of ~ 0.18 Å and ~ 0.3 Å, respectively (Figure 5a). The reduction in fluctuation at specific atomic positions of the inhibitor with imposition of the constraint of the density map is not uniform (Figure 5b), providing further information on the relative flexibility of different parts of the non-covalently bound ligand.
Figure 5. Local fluctuation of atomic positions in inhibitor and surrounding active site residues measured by molecular dynamics simulations.

a) Mean fluctuation in the absence (Free) or presence of map constraints (EM constrained) for atomic positions in PETG (coral), and residues within a 5 Å distance (gray) of the inhibitor. Center crossbar indicates median; boxplot shows quartiles. *p < 0.05; **** p < 0.0001. b) Non-uniform reduction in the per-atom fluctuation in PETG inhibitor when measured in the presence of map constraints.
DISCUSSION
The cryo-EM “revolution” has been fueled in large measure by advances in detector technology and image processing methods (Kühlbrandt, 2014). Here, we show that further resolution improvements are possible with more advanced methods for data processing that make better use of high quality image data, making it possible to achieve atomic resolution cryo-EM structures. A central piece of our approach is the correction of drift and CTF on a per-particle basis. A variety of such strategies have been employed in the past (Abrishami et al., 2015; Grant and Grigorieff, 2015; Rubinstein and Brubaker, 2015; Scheres, 2014; Zhang, 2016; Zheng et al., 2017), but have generally yielded modest improvements in resolution due to the inherent difficulties of dealing with low SNR in small regions of electron micrograph frames. Combination of the incremental effects of local drift and CTF correction with our dose weighting strategy not only improves resolution, but more importantly, it provides a selftuning mechanism for optimally extracting high-resolution information present in the raw movie frames. In addition, the increased efficiency in extracting high resolution information implies that fewer molecular images can be used, thus accelerating the process of structure determination.
FSC-based methods for resolution estimation have been broadly used for cryo-EM structures over the past decade. However, this measure is dependent on the number of particles used to determine the structure and the masks applied to each half-map before computing the correlation. Also, at the resolution ranges relevant to the present discussion, there are systematic differences between atomic models and cryo-EM maps stemming from inaccuracies in the modeling of electron scattering factors and radiation damage effects. Thus, the conventionally used FSC measures may in some cases underestimate the true resolution of the cryo-EM maps, especially when there are significant variations in local resolution between different regions of the structure. Given that high resolution – and now atomic resolution – cryo-EM maps are becoming a reality, finding approaches to reliably compare resolution values between cryo-EM and X-ray crystallographic approaches will be very important for critical assessment of map quality.
Crystal structures of drug-target complexes are frequently used to identify sites on the drug molecules that can be modified to change specific aspects of the interactions by adding or removing functional groups. The differential measure of flexibility obtained by a combination of atomic resolution cryo-EM density maps and map-constrained simulations reveals the dynamic “footprint” of the binding site and could lead to additional opportunities for improving structure-guided drug discovery.
STAR METHODS
KEY RESOURCES TABLE
METHOD DETAILS
Data acquisition and movie processing
The cryo-EM density map described in this work was obtained from the 1539 movies comprising the publicly available EMPIAR entry 10061. Each movie contains 38 frames recorded every 0.2 s giving an accumulated dose of ~ 45 e−/Å2 and a total exposure time of 7.6 s. This same dataset was used to determine the previously reported 2.2 Å structure of β-galactosidase (Bartesaghi et al., 2015). Movies were aligned initially using the whole frame alignment technique described earlier (Bartesaghi et al., 2014) and CTF estimation was done with CTFFIND (Rohou and Grigorieff, 2015) using a frequency range for the defocus fit of 30-3.5 Å.
Single particle analysis
298,715 particles were picked automatically using a Gaussian disk of 80 Å in radius (using a less stringent peak thresholding criteria than that used to obtain the 2.2 Å structure), extracted using a binning factor of 8 corresponding to 2.55 Å per pixel, and subjected to 3D refinement in FREALIGN (Grigorieff, 2016). A bimodal distribution of FREALIGN scores was observed and only the 150,321 particles assigned to the lobe with the highest scores were kept for further processing. These particles were then re-extracted from the original micrographs using a binning factor of 2 equivalent to 0.64 Å per pixel (box size of 768×768 pixels), and subjected to an additional 8 rounds of local refinement. D2 symmetry was imposed throughout processing. The highest resolution information used during all stages of refinement carried out in FREALIGN was set to 2.8 Å. The resulting map, which uses the full 45 e−/Å2 exposure served as a starting point to evaluate the improvements from each of the image processing advances we introduce in the present work. The nominal resolution of this map is 2.3 Å (0.143-cutoff FSC criterion; Supplementary Figure 1c-d, blue curves), which is slightly lower than the previously reported 2.2 Å map which had fewer particles (~40,000) and only used a subset of the data (frames 4-13) to minimize loss of high-resolution information from image drift and radiation damage.
3D refinement and reconstruction
All refinement and reconstruction operations were done with a new version of FREALIGN that uses a matched filter to align particle images. This requires noise-whitening of the particle images based on the noise power spectrum, which is estimated in FREALIGN as the average power spectrum of the particle images outside a specified particle radius. The signal power in the images is estimated using the particle spectral signal-to-noise ratio derived from resolution statistics of the current best reconstruction (Sindelar and Grigorieff, 2012). For the matched filter, the signal in the reference projections is amplitude-scaled to match the predicted signal in the image to be aligned, and the projection direction and x,y translation is then adjusted to maximize the correlation coefficient between image and reference. Improvements to FREALIGN further include speed optimization by on-the-fly real-space image cropping and pixel binning through Fourier cropping where appropriate, as well as the use of processor-optimized libraries. The improved version of FREALIGN is part of cisTEM (www.cistem.org), a new image processing software for single particle averaging.
Per-particle frame alignment
To overcome the challenges of dealing with the very low SNR present in the small image area of single particle frames (Aguerrebere et al., 2016), we follow the movement of individual particles throughout the exposure using a strategy similar to the “particle-polishing” procedure (Scheres, 2014). Frames for each particle were extracted from the aligned micrographs (after whole-frame alignment), and weighted running averages for each particle were obtained and re-aligned to projections of the refined 3D model. This produced a set of noisy trajectories for the movement of each particle, which were then regularized using spatio-temporal smoothness constraints. The resulting alignments were used to update the running frame averages for each particle and were re-aligned once again to the 3D reference. Repeating this process until convergence (typically 10 iterations), resulted in the final assignment of local particle trajectories as shown in Figures 1a-c. Compared to the 2.3 Å map obtained using whole-frame alignment, resolution after doing per-particle drift correction using this approach improved by 0.09 Å, Supplementary Figure 1c (left).
To compute the running averages of frames we used Gaussian weights with a variance equivalent to 20% the number of frames in each movie, meaning that only the closest ~15 frames (7 before and 7 after) have non-zero contributions to each running average. Re-alignment of the running averages to the 3D reference was implemented using FREALIGN by only allowing translational movements while keeping particle orientations fixed at the values obtained during the initial 3D refinement. To regularize the local trajectories, we averaged the movement of nearby particles using weights drawn from a Gaussian distribution based on the distance between particles (variance of 16 nm), followed by fitting of cubic splines to the net particle trajectories obtained by composing the whole-frame movement with the local drift component. Application of this strategy to particles with lower molecular weight than β-galactosidase may require the use of Gaussians with wider variances, both for the computation of running frame averages and regularization of trajectories, in order to compensate for the reduction in image contrast produced by smaller-sized complexes.
Data-driven dose weighting
Correlation scores assigned to individual frames of every particle were averaged across each micrograph resulting in 1D score-exposure curves (Figure 1d). Corresponding 2D frequency weights (Figure 1e) were derived using the formula , where f denotes the frame number and s the spatial frequency. The dependency on the normalized score-averages, , was set to to prevent a few top scoring frames from dominating the average in the high-frequency regime, and the frequency modulation was set empirically to y(s) = e7,62s. For micrographs containing fewer than 10 particles the score averages were too noisy to be reliable, and instead the mean score-exposure curve obtained by averaging across all micrographs in the dataset was used for weighting (Supplementary Figure 1a). Compared to using the full unweighted 45 e−/Å 2 exposure to obtain the baseline 2.3 Å map, the improvement in map resolution using the proposed dose weighting scheme was 0.12 Å, Supplementary Figure 1c (middle).
Per-particle CTF estimation
Initial 3D refinement was carried out with the standard approach of using global defocus/astigmatism parameters for each micrograph estimated using CTFFIND. To account for spatial variations of the CTF within each image, defocus/astigmatism estimation was done on a per particle basis using a strategy similar to that implemented in GCTF (Zhang, 2016). At every particle position, weighted averages of power spectra of neighboring particles were obtained and subjected to CTF estimation using CTFFIND (option --amplitude-spectrum-input), resulting in a smooth distribution of CTF parameters, Figure 1a. Weights were derived from a Gaussian distribution based on the inter-particle distances using a variance of 32 nm. Compared to the 2.3 Å reconstruction that used per-micrograph defocus parameters, the use of local CTF measurements resulted in an improvement in resolution of 0.07 Å, Supplementary Figure 1c (right).
Final map and structure refinement
Combination of the local drift correction, dose weighting and local CTF estimation strategies resulted in an improved map that was iteratively refined in FREALIGN. A negative B-factor was applied to the final map followed by application of a soft shape mask obtained by thresholding the unsharpened density map followed by apodization. Coordinates of one beta-galactosidase protomer with 2 sodium ions, 2 magnesium ions and a 2-phenylethyl 1-thio-beta-D-galactopyranoside extracted from the 2.2 Å resolution structure (Chain A of PDB ID 5A1A) was fitted onto the new cryo-EM map. The backbone of the starting model was manually adjusted in COOT followed by five cycles of real space refinement in PHENIX (Zwart et al., 2008). About 400 water molecules were then modeled at peaks of protein-masked density above 2.0 r.m.s.d. and with distance to protein atom between 2.5 and 3.5 Å. About 600 additional water molecules were placed manually. D2 symmetry was applied on the protomer to generate the whole tetramer of beta-galactosidase. Water molecules at interface of protomers were manually edited to avoid interatomic clashes. Gln, Asn and His sidechains were automatically flipped using MOLPROBITY’s Reduce (Chen et al., 2010) and then manually checked. Finally, three cycles of real space refinement were performed for the whole tetramer in PHENIX.
Flexibility analysis of protein structures
The refined tetramer structure of β-galactosidase was simulated using the AMBER package (Case et al., 2016) to examine conformational flexibility of the system. The map-restrained self-guided Langevin dynamics (MapSGLD) (Wu et al., 2013) was used to apply map restraints of the following form:
| (1) |
Which correlates atomic mass, ma, with the normalized map density at the atom position, . The restraint constant, cmap, sets the strength of the map-restraint. The units of ma and cmap are g/mol and kcal/g, respectively. Equation (1) produces an energy landscape in the shape of the density distribution, , for every restrained atom, a. It induces atoms to move to positions of lower energy, or of higher density. The restraint constant is set to cmap = 0.1 kcal/g. The map restraint coupled with the AMBER ff14SB force field (Maier et al., 2015), as well as the generalized Born solvation model (Gotz et al., 2012), makes the desired structure the global minimum. An improved conformational sampling method, self-guided Langevin dynamics via generalized Langevin equation (SGLD-GLE) (Wu et al., 2016), was applied to achieve enhanced conformational sampling while maintaining the correct canonical ensemble distribution. The local averaging time and the guiding factor were 0.2 ps and 1, respectively. The MapSGLD simulations were 1 ns in length with a time step of 1 fs. The conformations were saved every 10 ps for post simulation analysis. AMBER trajectory post analysis was done with Cpptraj (Roe and Cheatham, 2013). Fluctuations of residues and atoms were averaged over the four copies of the tetramer. Statistical differences between groups were calculated with the Wilcoxon rank sum test, and p-values were adjusted for multiple comparisons with the Bonferroni correction. Correlation between mean fluctuation values for unconstrained versus EM-constrained PETG atoms was evaluated using Kendall’s tau.
Generation of figures
Figures of map density and coordinates were created in UCSF Chimera (Pettersen et al., 2004) and Maxon Cinema4D, except for the individual residue images from the 2.2 Å cryo-EM map, which were created in UCSF Chimera. For the images created in Maxon Cinema4D, the coordinates were imported using the Cinema4D plugin Embedded Python Molecular Viewer (ePMV) (Johnson et al., 2011).
Supplementary Video 1. Visualization of atomic resolution features in cryo-EM map of β-galactosidase bound to PETG inhibitor. Related to Figures 2 and 3.
Sequence of screenshots obtained using the program COOT showing the quality of the map across different regions of the protein and comparison of residues for each of the 20-amino acids selected from the new map and from the previously published 2.2 Å map.
Supplementary Material
| REAGENT or RESOURCE | SOURCE | IDENTIFIER |
|---|---|---|
| Deposited Data | ||
| Sharpened map of β-galactosidase bound to PETG |
This paper | EMD: 7770 |
| Model of β-galactosidase bound to PETG | This paper | PDB: 6CVM |
| Software and Algorithms | ||
| FREALIGN | Grigorieff et al., 2016 | http://grigoriefflab.janelia.org/frealign |
| CTFFIND4 | Rohou and Grigorieff, 2015 | http://grigoriefflab.janelia.org/ctf |
| BLOCRES | Cardone et al., 2013 | https://lsbr.niams.nih.gov/bsoft/programs/blocres.html |
| PHENIX | Adams et al., 2010 | http://www.phenix-online.org |
| COOT | Emsley et al., 2010 | http://www2.mrc-lmb.cam.ac.uk/personal/pemsley/coot |
| MOLPROBITY | Chen et al., 2010 | http://molprobity.biochem.duke.edu |
| AMBER | Case et al., 2016 | http://ambermd.org |
| CPPTRAJ | Roe et al., 2013 | https://github.com/Amber-MD/cpptraj |
| UCSF Chimera | Goddard et al., 2007 | https://www.cgl.ucsf.edu/chimera |
| ePMV | Johnson et al., 2011 | http://epmv.scripps.edu |
HIGHLIGHTS.
Improved methods for tracking particle movement during the electron exposure
Atomic resolution cryo-EM map of inhibitor bound β-galactosidase enzyme
Delineation of spherical contours of non-hydrogen atoms and visualization of active site
Quantitative evaluation of inhibitor flexibility using constrained molecular dynamics simulations
ACKNOWLEDGEMENTS
This research was supported by funds from the Center for Cancer Research, National Cancer Institute, NIH, Bethesda, MD and utilized the high-performance computational capabilities of the Biowulf Linux cluster at the National Institutes of Health, Bethesda, MD (http://biowulf.nih.gov). We thank Dr. Alex Wlodawer for providing the anomalous scattering maps of sedolisin and insulin. We dedicate this work to the memory of our colleague Dr. Soojay Banerjee, who sadly passed away during the final stages of the preparation of this manuscript.
Footnotes
Publisher's Disclaimer: This is a PDF file of an unedited manuscript that has been accepted for publication. As a service to our customers we are providing this early version of the manuscript. The manuscript will undergo copyediting, typesetting, and review of the resulting proof before it is published in its final citable form. Please note that during the production process errors may be discovered which could affect the content, and all legal disclaimers that apply to the journal pertain.
DECLARATION OF INTERESTS
The authors declare no competing interests.
REFERENCES
- Abrishami V, Vargas J, Li X, Cheng Y, Marabini R, Sorzano C, Oscar S, and Carazo JM (2015). Alignment of direct detection device micrographs using a robust Optical Flow approach. Journal of Structural Biology 189, 163–176. [DOI] [PubMed] [Google Scholar]
- Aguerrebere C, Delbracio M, Bartesaghi A, and Sapiro G (2016). Fundamental Limits in Multi-Image Alignment. IEEE Transactions on Signal Processing 64, 5707–5722. [Google Scholar]
- Baker LA, Smith EA, Bueler SA, and Rubinstein JL (2010). The resolution dependence of optimal exposures in liquid nitrogen temperature electron cryomicroscopy of catalase crystals. Journal of Structural Biology 169, 431–437. [DOI] [PubMed] [Google Scholar]
- Bartesaghi A, Matthies D, Banerjee S, Merk A, and Subramaniam S (2014). Structure of β-galactosidase at 3.2-Å resolution obtained by cryo-electron microscopy. Proceedings of the National Academy of Sciences 111, 11709–11714. [DOI] [PMC free article] [PubMed] [Google Scholar]
- Bartesaghi A, Merk A, Banerjee S, Matthies D, Wu X, Milne JL, and Subramaniam S (2015). 2.2 A resolution cryo-EM structure of beta-galactosidase in complex with a cell-permeant inhibitor. Science (New York, NY) 348, 1147–1151. [DOI] [PMC free article] [PubMed] [Google Scholar]
- Brilot AF, Chen JZ, Cheng A, Harrison SCPJ, Potter CS, Carragher B, Henderson R, and Grigorieff N (2012). Beam-induced motion of vitrified specimen on holey carbon film. Journal of Structural Biology 177, 630–637. [DOI] [PMC free article] [PubMed] [Google Scholar]
- Cardone G, Heymann JB, and Alasdair SC (2013). One number does not fit all: mapping local variations in resolution in cryo-EM reconstructions. Journal of Structural Biology 184, 226–236. [DOI] [PMC free article] [PubMed] [Google Scholar]
- Case DA, Betz RM, Botello-Smith W, and Cerutti DS (2016). AMBER 2016, University of California, San Francisco. [Google Scholar]
- Chen S, McMullan G, Faruqi AR, Murshudov GN, Short JM, Scheres SH, and Henderson R (2013). High-resolution noise substitution to measure overfitting and validate resolution in 3D structure determination by single particle electron cryomicroscopy. Ultramicroscopy 135, 24–35. [DOI] [PMC free article] [PubMed] [Google Scholar]
- Chen VB, Arendall WB, Headd JJ, Keedy DA, Immormino RM, Kapral GJ, Murray LW, Richardson JS, and Richardson DC (2010). MolProbity: all-atom structure validation for macromolecular crystallography. Acta Crystallographica Section D Biological Crystallography 66, 12–21. [DOI] [PMC free article] [PubMed] [Google Scholar]
- Cheng Y, Grigorieff N, Penczek PA, and Walz T (2015). A primer to single-particle cryo-electron microscopy. Cell 161, 438–449. [DOI] [PMC free article] [PubMed] [Google Scholar]
- Glaeser RM (2016). How good can cryo-EM become? Nature Methods 13, 28–32. [DOI] [PubMed] [Google Scholar]
- Gotz AW, Williamson MJ, Xu D, and Poole D (2012). Routine Microsecond Molecular Dynamics Simulations with AMBER on GPUs. 1. Generalized Born. Journal of Chemical Theory and Computation 8, 1542–1555. [DOI] [PMC free article] [PubMed] [Google Scholar]
- Grant T, and Grigorieff N (2015). Measuring the optimal exposure for single particle cryo-EM using a 2.6 Å reconstruction of rotavirus VP6. eLife 4, e06980. [DOI] [PMC free article] [PubMed] [Google Scholar]
- Grigorieff N (2016). Frealign: An Exploratory Tool for Single-Particle Cryo-EM. Methods in Enzymology 579, 191–226. [DOI] [PMC free article] [PubMed] [Google Scholar]
- Grigorieff N, Ceska TA, Downing KH, Baldwin JM, and Henderson R (1996). Electron-crystallographic refinement of the structure of bacteriorhodopsin. J Mol Biol 259, 393–421. [DOI] [PubMed] [Google Scholar]
- Johnson GT, Autin L, Goodsell DS, Sanner MF, and Olson AJ (2011). ePMV Embeds Molecular Modeling into Professional Animation Software Environments. Structure 19, 293–303. [DOI] [PMC free article] [PubMed] [Google Scholar]
- Kimanius D, Forsberg BO, Scheres SH, and Lindahl E (2016). Accelerated cryo-EM structure determination with parallelisation using GPUs in RELION-2. Elife 5. [DOI] [PMC free article] [PubMed] [Google Scholar]
- Kucukelbir A, Sigworth FJ, and Tagare HD (2014). Quantifying the local resolution of cryo-EM density maps. Nat Methods 11, 63–65. [DOI] [PMC free article] [PubMed] [Google Scholar]
- Kühlbrandt W (2014). Cryo-EM enters a new era. Elife 3, e03678. [DOI] [PMC free article] [PubMed] [Google Scholar]
- Maier JA, Martinez C, Kasavajhala K, Wickstrom L, Hauser KE, and Simmerling C (2015). ff14SB: Improving the Accuracy of Protein Side Chain and Backbone Parameters from ff99SB. Journal of Chemical Theory and Computation 11, 3696–3713. [DOI] [PMC free article] [PubMed] [Google Scholar]
- McDonough RN, and Whalen AD (1995). Detection of signals in noise, 2nd edn (San Diego: Academic Press; ). [Google Scholar]
- McMullan G, Vinothkumar KR, and Henderson R (2015). Thon rings from amorphous ice and implications of beam-induced Brownian motion in single particle electron cryo-microscopy. Ultramicroscopy 158, 26–32. [DOI] [PMC free article] [PubMed] [Google Scholar]
- Merk A, Bartesaghi A, Banerjee S, Falconieri V, Rao P, Davis MI, Pragani R, Boxer MB, Earl LA, Milne JL, et al. (2016). Breaking Cryo-EM Resolution Barriers to Facilitate Drug Discovery. Cell 165, 1698–1707. [DOI] [PMC free article] [PubMed] [Google Scholar]
- Pettersen EF, Goddard TD, Huang CC, Couch GS, Greenblatt DM, Meng EC, and Ferrin TE (2004). UCSF Chimera--a visualization system for exploratory research and analysis. Journal of Computational Chemistry 25, 1605–1612. [DOI] [PubMed] [Google Scholar]
- Roe DR, and Cheatham TE (2013). PTRAJ and CPPTRAJ: Software for Processing and Analysis of Molecular Dynamics Trajectory Data. Journal of Chemical Theory and Computation 9, 3084–3095. [DOI] [PubMed] [Google Scholar]
- Rohou A, and Grigorieff N (2015). CTFFIND4: Fast and accurate defocus estimation from electron micrographs. Journal of Structural Biology 192, 216–221. [DOI] [PMC free article] [PubMed] [Google Scholar]
- Rosenthal PB, and Henderson R (2003). Optimal determination of particle orientation, absolute hand, and contrast loss in single-particle electron cryomicroscopy. J Mol Biol 333, 721–745. [DOI] [PubMed] [Google Scholar]
- Rubinstein JL, and Brubaker MA (2015). Alignment of cryo-EM movies of individual particles by optimization of image translations. Journal of Structural Biology 192, 188–195. [DOI] [PubMed] [Google Scholar]
- Scheres SH (2014). Beam-induced motion correction for sub-megadalton cryo-EM particles. eLife 3, e03665. [DOI] [PMC free article] [PubMed] [Google Scholar]
- Sindelar CV, and Grigorieff N (2012). Optimal noise reduction in 3D reconstructions of single particles using a volume-normalized filter. Journal of Structural Biology 180, 26–38. [DOI] [PMC free article] [PubMed] [Google Scholar]
- Wlodawer A, Li M, and Dauter Z (2017). High-Resolution Cryo-EM maps and models: a Christallographer's Perspective. Structure In press. [DOI] [PMC free article] [PubMed] [Google Scholar]
- Wu X, Brooks BR, and Vanden-Eijnden E (2016). Self-guided Langevin dynamics via generalized Langevin equation. Journal of computational chemistry 37, 595–601. [DOI] [PMC free article] [PubMed] [Google Scholar]
- Wu X, Subramaniam S, Case DA, Wu KW, and Brooks BR (2013). Targeted conformational search with map-restrained self-guided Langevin dynamics: Application to flexible fitting into electron microscopic density maps. Journal of Structural Biology 183, 429–440. [DOI] [PMC free article] [PubMed] [Google Scholar]
- Zhang K (2016). Gctf: Real-time CTF determination and correction. Journal of Structural Biology 193, 1–12. [DOI] [PMC free article] [PubMed] [Google Scholar]
- Zheng SQ, Palovcak E, Armache J-P, Verba KA, Cheng Y, and Agard DA (2017). MotionCor2: anisotropic correction of beam-induced motion for improved cryo-electron microscopy. Nature Methods 14, 331–332. [DOI] [PMC free article] [PubMed] [Google Scholar]
- Zwart PH, Afonine PV, Grosse-Kunstleve RW, Hung L-W, Ioerger TR, McCoy AJ, McKee E, Moriarty NW, Read RJ, Sacchettini JC, et al. (2008). Automated structure solution with the PHENIX suite. Methods in Molecular Biology 426, 419–435. [DOI] [PubMed] [Google Scholar]
Associated Data
This section collects any data citations, data availability statements, or supplementary materials included in this article.