

Abstract
Insomnia is a worldwide problem with substantial deleterious health effects. Twin studies have shown a heritable basis for various sleep-related traits, including insomnia, but robust genetic risk variants have just recently begun to be identified. We conducted genome-wide association studies (GWAS) of soldiers in the Army Study To Assess Risk and Resilience in Servicemembers (STARRS). GWAS were carried out separately for each ancestral group (EUR, AFR, LAT) using logistic regression for each of the STARRS component studies (including 3,237 cases and 14,414 controls), and then meta-analysis was conducted across studies and ancestral groups. Heritability (SNP-based) for lifetime insomnia disorder was significant (h2g=0.115, p=1.78×10⁻⁴ in EUR). A meta-analysis including three ancestral groups and three study cohorts revealed a genome-wide significant locus on Chr 7 (q11.22) (top SNP rs186736700, OR = 0.607, p = 4.88×10⁻⁹) and a genome-wide significant gene-based association (p = 7.61×10⁻⁷) in EUR for RFX3 on Chr 9. Polygenic risk for sleeplessness/insomnia severity in UK Biobank was significantly positively associated with likelihood of insomnia disorder in STARRS. Genetic contributions to insomnia disorder in STARRS were significantly positively correlated with major depressive disorder (rg = 0.44, se = 0.22, p = 0.047) and type 2 diabetes (rg = 0.43, se = 0.20, p = 0.037), and negatively with morningness chronotype (rg = −0.34, se = 0.17, p = 0.039) and subjective well-being (rg = −0.59, se = 0.23, p = 0.009) in external datasets. Insomnia associated loci may contribute to the genetic risk underlying a range of health conditions including psychiatric disorders and metabolic disease.
INTRODUCTION
Insomnia is highly prevalent, affecting 10–20% of adults in the United States1 and worldwide.2 The prevalence of insomnia is even higher (~25–50%) among military veterans, for whom it is frequently associated with mental health complications and functional impairment.3–5 At the population level, insomnia is an important contributor to poor perceived health and disability, and healthcare utilization.1, 6 Furthermore, chronic insomnia is associated with a multitude of adverse long-term health outcomes, including cardiovascular and metabolic disturbances (such as type 2 diabetes) as well as myriad mental health problems, including posttraumatic stress disorder (PTSD) and suicide.7–11
Twin studies show that there is a heritable basis to sleep characteristics and insomnia.12–16 Whereas there have been several recent genome-wide association studies (GWAS) for usual sleep duration,17, 18 including a now-replicated locus at PAX8,19 specific genetic risk variants for insomnia are just now being identified at genome-wide significance.20–22 Given the tremendous variability in causes of insomnia as a symptom, as well as heterogeneity in insomnia as a disorder, it is important to fully specify the phenotype(s) under consideration in insomnia studies. Better understanding of the molecular bases for insomnia will be critical for the development of new treatments.23–25 These efforts will benefit from careful consideration of the heterogeneity in insomnia at the phenotypic levels in different groups (e.g., causes of insomnia in young versus older cohorts) with the expectation that genetic risk factors may differ across populations.
The purpose of the present study is to use GWAS to elucidate the genetic architecture of insomnia. To achieve this aim we employed survey and genome-wide genetic data from the Army Study To Assess Risk and Resilience in Servicemembers (STARRS) to determine the association between insomnia disorder (approximating DSM-5 criteria) and specific genetic risk variants. In so doing, we also looked for consistency of our results with those of a large recently published study of sleep disturbance traits in the UK Biobank that included insomnia symptoms21 and an even more recently published analysis of a largely overlapping UK Biobank sample where a different phenotyping algorithm was used to assign case-control status based on insomnia symptoms.22 We also determined the extent to which a polygenic risk score for insomnia severity, derived from the largest UK Biobank sample currently available (http://www.nealelab.is/blog/2017/7/19/rapid-gwas-of-thousands-of-phenotypes-for-337000-samples-in-the-uk-biobank), was significantly associated with insomnia disorder in STARRS. Lastly, we determined the heritability of insomnia disorder in this generally young and mostly male sample, and explored its genetic relationship to other mental and physical health related phenotypes by referencing other publicly available GWAS data for those traits.26
METHODS
Subjects
Information in detail about the design and methodology of STARRS can be obtained in our prior report.27 Each of the participating institutions approved the human subjects and data protection procedures used in the study. As described below, the analyses presented here involved two large components of STARRS.
New Soldier Study (NSS)
New soldiers took part in the NSS at the beginning of their basic training, which took place between April 2011 and November 2012 at one of three Army installations. 39,784 soldiers completed a computerized self-administered questionnaire (SAQ, described below) and, of these, 33,088 (83.2%) gave blood samples for DNA. The first half of the cohort had samples selected to enrich for probable cases of PTSD, suicidality, generalized anxiety disorder, and major depression; and controls with none of these disorders were also selected) (NSS1; N = 7,999). A subset of samples from the second half of the cohort was subsequently selected for genotyping to include cases of PTSD, suicidal behaviors and controls (NSS2; N = 2,835).
Pre/Post Deployment Survey (PPDS)
US Army soldiers from three Brigade Combat Teams (BCTs) participated in the PPDS (N = 7,927 eligible soldiers were genotyped) which began in the first quarter of 2012. The data included in this report were collected at baseline (T0) 4–6weeks prior to deployment to Afghanistan.
Demographics
The population, sex and age composition of our analyzed samples are shown in Table 1. As expected, the PPDS subjects were older than the new Army recruits in the NSS. Lifetime prevalence estimates (with standard errors) of insomnia disorder are also shown.
Table 1.
Study participants (by ancestry) and sex and age distributions in the samples
| NSS1 | NSS2 | PPDS | ||||
|---|---|---|---|---|---|---|
| N | % with Insomnia Disorder | N | % with Insomnia Disorder | N | % with Insomnia Disorder | |
| Population | ||||||
| European American | 4756 | 16.51% | 1817 | 19.54% | 4900 | 23.61% |
| African American | 1371 | 10.07% | 406 | 10.84% | 902 | 16.85% |
| Latino American | 1447 | 13.41% | 498 | 19.08% | 1554 | 20.4% |
| Sex (% male) | 81.4% | 77.8% | 92.8% | |||
| Age, yrs (SD) | 21.0 (3.3) | 20.3 (3.2) | 26.0 (5.9) | |||
Measures
One of the Composite International Diagnostic Interview screening scales (CIDI-SC)28 was used to determine criteria for major depression. The reliable and valid Brief Insomnia Questionnaire 29 was used to approximate DSM-5 criteria (which differ immaterially from DSM-IV criteria) for Insomnia Disorder. The stem question for insomnia was “Did you ever in your life have insomnia - that is, problems either getting to sleep, staying asleep, waking too early, or feeling so tired even after a full night’s sleep that it interfered with your daytime activities?” Respondents who answered yes were asked “Did you ever in your life have a whole month or longer when you had insomnia at least three nights a week?” Respondents who answered yes were asked 5 questions introduced with “Think of a typical month when your insomnia was worst. During that month, how much did your insomnia interfere with your daytime functioning in the following ways”: (1) daytime fatigue, sleepiness, or low motivation, (2) headaches, upset stomach, diarrhea or constipation, (3) moodiness (irritability, nerves, worry, or depression), (4) reduced performance at work or school, and (5) accident proneness. Insomnia Disorder was defined as at least one month of insomnia and reporting of at least “Some of the Time” on one or more of these five symptom items. Controls were defined as failing to meet the definition of Insomnia Disorder.
DNA Genotyping, Imputation and Population Stratification Adjustment
Detailed information on genotyping, genotype imputation, population assignment and principal component analysis for population stratification adjustment are included in our previous report30 and in Supplementary Materials. Whole blood samples were shipped to Rutgers University Cell & DNA Repository (RUCDR), where they were frozen for later DNA extraction using standard methods. NSS1 and PPDS samples were genotyped using the Illumina OmniExpress + Exome array with additional custom content (N SNP = 967,537). NSS2 samples were genotyped on the Illumina PsychChip (N SNP = 571,054; 477,757 SNPs overlap with OmniExpress + Exome array).
Relatedness testing was carried out with PLINK v1.9031, 32 and pairs of subjects with π of >0.2 were identified, randomly retaining one member of each relative pair. We used a two-step pre-phasing/imputation approach for genotype imputation, with reference to the 1000 Genomes Project multi-ethnic panel (August 2012 phase 1 integrated release; 2,186 phased haplotypes with 40,318,245 variants). We removed SNPs that were not present in the 1000 Genomes Project reference panel, had non-matching alleles to 1000 Genome Project reference, or had ambiguous, unresolvable alleles (AT/GC SNPs with minor allele frequency [MAF] > 0.1). For the Illumina OmniExpress array 664,457 SNPs and for the Illumina PsychChip 360,704 SNPs entered the imputation procedure.
Given the ancestral heterogeneity of the STARRS subjects, samples were assigned into major population groups (European [EUR], African [AFR] or Latino [LAT]) (see Supplementary Materials; also see 30). An Asian [ASI] group that was too small for separate analysis was excluded. PCs within each population group were then obtained for population stratification adjustment (see also Supplementary Figures 1–3). For quality control (QC) purposes we kept autosomal SNPs with missing rate < 0.05; kept samples with individual-wise missing rate < 0.02; and kept SNPs with missing rate < 0.02. After QC, we merged our study samples with HapMap3 samples. We kept SNPs with minor allele frequency (MAF) > 0.05 and LD pruned at R2 > 0.05. In order to avoid long range LD structure from interfering with the PCA analysis, we excluded SNPs in the MHC region (Chr 6:25–35Mb) and Chr 8 inversion (Chr 8:7–13Mb).
Statistical Analysis
We used LD score regression (LDSR)33 and GCTA34 with imputed data (modified from 35, 36) to estimate the proportion of variance in insomnia explained by common SNPs (i.e., SNP-heritability, h2g). We estimated h2g of insomnia in EUR with linear mixed models implemented in GCTA software, adjusted for 10 PCs and study.
We used PLINK v1.9031, 32 to conduct genome-wide association tests for insomnia disorder on imputed SNP dosage with logistic regression adjusted for age, sex, and the top 10 within-population principal components (PCs). We also conducted sensitivity analyses adjusting for lifetime major depressive disorder, of which insomnia is a common symptom. We filtered out SNPs with MAF < 0.01 or imputation quality score (INFO) < 0.6, and performed HWE tests for the top SNPs from the association analysis.
GWAS was conducted in the three studies (NSS1, NSS2 and PPDS) separately within each of the three ancestral groups (EUR, AFR, LAT) and then meta-analyzed within ancestry group across studies, and then across ancestral groups and studies. We report fixed-effects models as our primary analysis in the Results. Meta-analysis was conducted using an inverse variance-weighted fixed effects model in PLINK. A p-value < 5 × 10⁻⁸ was used as the threshold for genome-wide significance whereas results at p-value < 1 × 10⁻⁶ are reported as genome-wide suggestive.
We used LDSR33 implemented on LD Hub (http://ldsc.broadinstitute.org)26 to test the genetic correlation between insomnia disorder and several other traits in European samples using publicly available meta-analytic GWAS for two sleep phenotypes (morningness and sleep duration),20 two mental disorders frequently comorbid with insomnia (major depression and bipolar disorder),37, 38 a personality trait frequently associated with insomnia (neuroticism),39 and subjective well-being.40 We also extended this inquiry to two physical traits that have been frequently epidemiologically associated with insomnia, namely Type 2 diabetes41 and coronary artery disease.42
We performed gene-based tests and pathway analysis using software MAGMA43 and FUMA.44 The gene-based test can provide association tests for each gene (N = 18,194) by aggregating the SNPs within the gene region and the pathway analysis can identify enriched association signals of insomnia disorder in gene sets aggregated in biological pathways. We used the final meta-analysis in EUR samples and the 1000 Genomes Project European LD reference for this analysis. For the gene-based analysis, we used a combined mean and top SNP association model. We used curated pathways and GO terms obtained from MsigDB with a total of 10894 pathways. The significance level after Bonferroni correction according to the genes or pathways tested is 0.05/18194 = 2.75×10⁻⁶ for the gene-based tests and 0.05/10894 = 4.59×10⁻⁶ for the pathway analysis. Additional analyses for functional eQTLs were conducted using the Broad GTEx database (https://www.gtexportal.org).45
RESULTS
SNP-based heritability of Insomnia Disorder
We estimated SNP-based heritability (h2g) using GCTA.34 We found significant h2g estimates of 0.115 (se 0.033) for insomnia disorder from the EUR meta-analysis across studies (p = 1.78 ×10⁻⁴). With LDSR,33 which uses GWAS summary statistics and often provides a lower estimate of heritability than GCTA, we found a significant h2g estimate of 0.078 (se 0.026, p = 0.003). This latter estimate is similar to the most recently available LDSR-derived heritability estimate from N = 336,965 EUR individuals for the continuous insomnia symptoms (never/sometimes/usually) variable in UK Biobank (h2g = 0.061, se = 0.0037, p = 5.15 ×10−62) (https://nealelab.github.io/UKBB_ldsc/index.html; last updated 9-20-2017). (All estimates reported above are on the observed scale; estimates for insomnia disorder on the liability scale are all higher, given a population prevalence of 0.10 or higher.)
Genome-wide Association Analyses
Within-Ancestry Cross-Study Meta-analyses
EUR ancestry
In the meta-analysis of EUR ancestry individuals across the three studies we observed several genome-wide significant SNPs on Chr7 (q11.22) (top SNP rs147549871, OR = 0.538, p = 4.90×10⁻⁹) in an intergenic region (Supplementary Figure 4), and several genome-wide suggestive SNPs on Chr 9 (top SNP rs7855172, OR = 0.72, p = 9.54×10⁻⁸) in RFX3. These and other genome-wide suggestive loci are shown in Table 2a.
Table 2a.
NSS1, NSS2 and PPDS GWAS Ancestry-Specific Results for Insomnia Disorder at genome-wide significance p < 5 × 10⁻⁸ (in bold) and suggestive results at p < 10−6 in Soldiers of European Ancestry
| Chr | BP | SNP | A1 | A2 | MAF | p-value | OR | Gene |
|---|---|---|---|---|---|---|---|---|
| 4 | 61,349,132 | rs55710816 | A | G | 0.04809 | 9.36E-07 | 0.70 | intergenic |
| 4 | 150,822,110 | rs56676520 | A | T | 0.07021 | 9.20E-07 | 1.50 | EST CN411885 |
| 4 | 150,822,180 | rs72965338 | A | G | 0.06822 | 9.82E-07 | 0.67 | EST CN411885 |
| 5 | 119,118,370 | chr5-119118370-D | I5 | D | 0.3152 | 2.66E-07 | 0.82 | EST BE896471 |
| 7 | 67,799,556 | rs142587679 | A | T | 0.01476 | 1.03E-08 | 1.82 | |
| 7 | 67,799,600 | rs147549871 | T | G | 0.01411 | 4.90E-09 | 0.54 | |
| 7 | 67,820,045 | rs186736700 | A | C | 0.01966 | 1.81E-08 | 0.60 | |
| 7 | 67,832,096 | rs117920677 | T | C | 0.01728 | 1.04E-07 | 1.66 | |
| 7 | 67,915,285 | rs60353720 | A | C | 0.2557 | 4.80E-07 | 1.22 | |
| 9 | 3,229,630 | rs628884 | A | T | 0.1172 | 4.52E-07 | 1.34 | RFX3 |
| 9 | 3,233,835 | chr9-3233835-D | I2 | D | 0.1264 | 2.54E-07 | 1.37 | RFX3 |
| 9 | 3,234,232 | rs577389 | C | G | 0.1187 | 1.58E-07 | 1.38 | RFX3 |
| 9 | 3,234,246 | rs577434 | T | C | 0.1188 | 1.58E-07 | 1.38 | RFX3 |
| 9 | 3,239,284 | rs16916157 | A | C | 0.08846 | 9.95E-08 | 1.39 | RFX3 |
| 9 | 3,242,236 | rs488534 | A | G | 0.07875 | 8.64E-07 | 0.73 | RFX3 |
| 9 | 3,242,394 | rs653080 | C | G | 0.0788 | 8.10E-07 | 1.37 | RFX3 |
| 9 | 3,244,009 | chr9-3244009-I | I2 | D | 0.09904 | 3.19E-07 | 1.35 | RFX3 |
| 9 | 3,244,165 | rs111796799 | C | G | 0.1014 | 2.24E-07 | 0.74 | RFX3 |
| 9 | 3,245,080 | rs7869158 | C | G | 0.1054 | 2.45E-07 | 0.74 | RFX3 |
| 9 | 3,245,127 | rs7855172 | A | G | 0.07337 | 9.54E-08 | 0.72 | RFX3 |
| 9 | 3,245,605 | rs589085 | T | G | 0.09302 | 2.08E-07 | 1.38 | RFX3 |
| 9 | 3,245,672 | rs528224 | A | T | 0.1149 | 2.58E-07 | 0.74 | RFX3 |
| 12 | 45,833,755 | rs74081827 | A | G | 0.03869 | 6.86E-07 | 1.66 | ANO6 |
| 13 | 67,376,132 | chr13-67376132-I | I5 | D | 0.03019 | 7.32E-07 | 1.99 | PCDH9 |
Highlighted bold: genome-wide significant (p < 5×10⁻⁸)
MAF = Minor allele frequency.
All SNPs in this table were imputed.
To test whether the SNPs identified as associated with insomnia were better accounted for by major depression, which frequently has insomnia as a prominent symptom, we conducted the meta-analyses of our largest ancestral group (EUR) across the three studies also adjusting for lifetime major depressive disorder (MDD). These analyses resulted in only very modest attenuation of the GWAS signals associated with insomnia disorder, with multiple SNPs on Chr7 (q11.22) remaining genome-wide significant (top SNP rs147549871, OR = 0.536, p = 1.91×10⁻⁸).
AFR ancestry
In the meta-analysis of AFR ancestry individuals across the three studies we observed a genome-wide significant SNP on Chr 12 (rs7138947, OR = 3.15, p = 1.92×10⁻⁸) in NTF3 (Supplementary Figure 5), and a genome-wide suggestive SNP on Chr 3 (rs185334926, OR = 4.38, p = 4.70×10⁻⁷) in CACNA1D (Supplementary Figure 6). These and other genome-wide suggestive loci are shown in Table 2b.
Table 2b.
NSS1, NSS2 and PPDS GWAS Ancestry-Specific Results for Insomnia Disorder at genome-wide significance p < 5×10⁻⁸ (in bold) and suggestive results at p < 10−6 in Soldiers of African Ancestry
| Chr | BP | SNP | A1 | A2 | MAF | p-value | OR | Gene |
|---|---|---|---|---|---|---|---|---|
| 3 | 53,767,889 | rs185334926 | T | C | 0.01031 | 4.70E-07 | 4.38 | CACNA1D |
| 4 | 12,352,522 | rs111858442 | A | G | 0.01012 | 4.24E-07 | 0.44 | intergenic |
| 4 | 80,435,046 | rs58777020 | T | C | 0.01002 | 6.25E-07 | 2.84 | LINC00989 |
| 4 | 142,518,082 | chr4-142518082-I | I2 | D | 0.01001 | 9.11E-07 | 2.88 | IL15 |
| 4 | 168,926,494 | rs190721506 | A | C | 0.02951 | 7.04E-07 | 0.18 | RP11-310I9.1 |
| 8 | 48,770,702 | rs7003908 | A | C | 0.3285 | 4.63E-07 | 0.64 | PRKDC* |
| 12 | 5,618,948 | rs7138947 | A | C | 0.09706 | 1.92E-08 | 3.15 | NTF3 |
| 14 | 40,369,086 | rs148431766 | T | C | 0.04516 | 1.70E-07 | 0.48 | |
| 16 | 7,917,912 | rs4078004 | C | G | 0.1178 | 3.77E-08 | 0.35 | CTD-2535I10.1** |
| 16 | 7,955,134 | rs34670506 | T | C | 0.1417 | 2.31E-08 | 0.37 | CTD-2535I10.1** |
| 18 | 71,552,804 | rs76941679 | T | G | 0.01442 | 2.57E-07 | 0.44 | g7907.t1* |
| 19 | 52,603,402 | rs56701754 | T | C | 0.03339 | 4.36E-07 | 0.59 | ZNF616, ZNF841 |
| 19 | 52,604,302 | rs73578849 | A | G | 0.05593 | 2.93E-07 | 0.58 | ZNF616, ZNF841 |
| 19 | 52,607,777 | rs73571238 | C | G | 0.05213 | 5.05E-07 | 0.58 | ZNF616, ZNF841 |
genotyped SNP; all other SNPs in this table were imputed
predicted gene
Highlighted bold: genome-wide significant (p < 5×10⁻⁸)
MAF = Minor allele frequency
LAT ancestry
In the meta-analysis of LAT ancestry individuals across the three studies we observed a genome-wide suggestive SNP on Chr 9 (rs35796756, OR = 2.89, p = 8.33×10⁻⁷) in the intronic region of DEC1. Additional genome-wide suggestive loci are shown in Table 2c.
Table 2c.
NSS1, NSS2 and PPDS GWAS Ancestry-Specific Results for Insomnia Disorder with suggestive results at p < 10−6 in Soldiers of Latino Ancestry
| Chr | BP | SNP | A1 | A2 | p-value | MAF | OR | Gene |
|---|---|---|---|---|---|---|---|---|
| 2 | 129,733,260 | rs11678417 | A | G | 8.46E-07 | 0.09372 | 1.71 | intergenic |
| 2 | 129,744,344 | rs13013037 | A | G | 6.74E-07 | 0.1073 | 1.68 | intergenic |
| 4 | 177,070,382 | chr4-177070382-I | I2 | D | 9.23E-07 | 0.02678 | 2.85 | WDR17 |
| 4 | 177,070,739 | rs6838194 | A | G | 9.10E-07 | 0.02694 | 0.35 | WDR17 |
| 4 | 177,071,506 | rs7356435 | A | G | 8.75E-07 | 0.02701 | 0.35 | WDR17 |
| 4 | 177,072,545 | rs6826405 | T | C | 8.30E-07 | 0.02697 | 2.86 | WDR17 |
| 4 | 177,072,560 | rs6826418 | T | C | 8.29E-07 | 0.02697 | 2.86 | WDR17 |
| 4 | 177,076,247 | rs10012282 | T | C | 6.71E-07 | 0.02723 | 0.35 | WDR17 |
| 4 | 185,083,206 | rs72699704 | A | G | 2.36E-07 | 0.155 | 1.67 | ENPP6 |
| 4 | 185,087,970 | rs72699711 | T | C | 4.94E-07 | 0.1234 | 1.69 | ENPP6 |
| 6 | 3,915,183 | rs9503800 | T | C | 6.49E-07 | 0.185 | 1.54 | RP1-140K8.2 |
| 6 | 3,915,406 | rs9503802 | T | C | 9.27E-07 | 0.1841 | 0.65 | RP1-140K8.2 |
| 6 | 3,915,450 | rs9503803 | C | G | 8.41E-07 | 0.1841 | 1.53 | RP1-140K8.2 |
| 6 | 3,915,489 | rs9503804 | A | G | 6.17E-07 | 0.1845 | 1.54 | RP1-140K8.2 |
| 6 | 3,915,755 | rs58091956 | T | C | 5.42E-07 | 0.1842 | 1.55 | RP1-140K8.2 |
| 6 | 3,915,819 | rs9503805 | A | G | 6.04E-07 | 0.1842 | 0.65 | RP1-140K8.2 |
| 6 | 3,916,060 | rs58048000 | A | G | 5.45E-07 | 0.185 | 1.54 | RP1-140K8.2 |
| 6 | 3,916,151 | rs60302355 | C | G | 5.95E-07 | 0.1841 | 1.54 | RP1-140K8.2 |
| 6 | 3,916,182 | rs58239759 | A | G | 5.44E-07 | 0.1849 | 1.54 | RP1-140K8.2 |
| 6 | 3,916,207 | rs55995704 | C | G | 5.44E-07 | 0.1849 | 1.54 | RP1-140K8.2 |
| 6 | 3,916,251 | rs11752830 | T | C | 5.27E-07 | 0.1849 | 1.55 | RP1-140K8.2 |
| 6 | 3,916,296 | rs57213389 | A | T | 5.37E-07 | 0.1849 | 0.65 | RP1-140K8.2 |
| 6 | 3,916,713 | rs9503806 | T | C | 5.24E-07 | 0.1852 | 0.65 | |
| 6 | 3,916,741 | rs9503807 | T | C | 5.23E-07 | 0.1852 | 0.65 | |
| 6 | 3,916,858 | rs9503808 | A | G | 5.21E-07 | 0.1852 | 1.55 | |
| 6 | 3,917,007 | rs9503809 | C | G | 5.03E-07 | 0.1849 | 0.65 | |
| 6 | 3,917,217 | rs9502090 | T | C | 5.04E-07 | 0.1852 | 0.65 | |
| 6 | 3,917,344 | rs9502091 | C | G | 4.10E-07 | 0.1846 | 1.55 | |
| 6 | 3,917,519 | rs9503813 | T | C | 4.96E-07 | 0.1853 | 1.55 | |
| 6 | 3,917,622 | rs9502092 | C | G | 4.92E-07 | 0.1853 | 1.55 | |
| 6 | 3,917,690 | rs6915403 | C | G | 4.91E-07 | 0.1853 | 1.55 | |
| 6 | 3,917,918 | rs6914617 | A | G | 4.81E-07 | 0.1857 | 0.65 | |
| 6 | 3,918,004 | rs6899585 | A | G | 6.32E-07 | 0.186 | 1.54 | |
| 6 | 3,918,537 | rs9503815 | A | G | 5.33E-07 | 0.1834 | 1.55 | |
| 6 | 3,918,554 | rs145045254 | T | C | 8.64E-07 | 0.1766 | 0.64 | |
| 6 | 3,919,135 | rs6905890 | A | G | 5.34E-07 | 0.1867 | 1.54 | |
| 6 | 3,919,215 | rs6925458 | T | G | 2.90E-07 | 0.1868 | 0.64 | * |
| 6 | 3,919,380 | rs6926967 | T | C | 1.65E-07 | 0.2002 | 0.64 | RP1-140K8.5 |
| 6 | 3,919,394 | rs6910820 | T | C | 1.69E-07 | 0.2003 | 1.56 | |
| 6 | 3,919,504 | rs6927256 | A | C | 1.68E-07 | 0.2003 | 0.64 | BX105115 |
| 6 | 3,919,560 | rs6906656 | A | G | 1.45E-07 | 0.2006 | 1.57 | |
| 6 | 3,919,714 | rs4959896 | T | C | 1.70E-07 | 0.2002 | 0.64 | |
| 6 | 3,920,536 | rs9503816 | A | G | 4.44E-07 | 0.2015 | 1.54 | |
| 6 | 3,920,619 | rs9503817 | T | C | 1.63E-07 | 0.1983 | 0.64 | |
| 9 | 118,117,399 | rs35796756 | A | G | 8.33E-07 | 0.01636 | 2.89 | DEC1 |
| 16 | 86,420,361 | rs1687657 | T | G | 2.90E-07 | 0.06825 | 2.34 | LINC00917 |
MAF = Minor allele frequency
SNP genotyped; all other SNPs were imputed
Summary statistics for all the top SNPs across ancestral groups are shown in Supplementary Tables 3a–5c.
Trans-Ethnic Cross-Study Meta-Analysis
Several SNPs in a region on Chr7 (q11.22) (top SNP rs186736700, OR = 0.607, p= 4.88×10⁻⁹) were genome-wide significantly associated with insomnia disorder in the pan-ancestral meta-analysis across the 3 studies (Table 3 and Figures 1 and 2). Polygenic risk scores derived from insomnia disorder in NSS1+NSS2 were significantly associated with insomnia disorder in PPDS (optimal p-value cutoff = 0.05, R2 = 0.00028, p = 0.0048, N SNPS = 41,566).
Table 3.
NSS1, NSS2 and PPDS GWAS Trans-Ethnic Meta-analysis Results for Insomnia Disorder at genome-wide significance p < 5×10⁻⁸ (in bold) and suggestive results p < 10−6
| CHR | BP | SNP | A1 | A2 | MAF | P-value | OR | Gene |
|---|---|---|---|---|---|---|---|---|
| 2 | 5,693,308 | chr2-5693308-D | I2 | D | 0.02341 | 9.80E-07 | 0.60 | AC107057.1 |
| 4 | 12,352,522 | rs111858442 | A | G | 0.0102 | 4.24E-07 | 0.44 | - |
| 4 | 80,435,046 | rs58777020 | T | C | 0.0101 | 6.25E-07 | 2.84 | LINC00989 |
| 4 | 142,518,082 | chr4-142518082-I | I2 | D | 0.0100 | 9.11E-07 | 2.88 | |
| 7 | 67,799,556 | rs142587679 | A | T | 0.01476 | 1.39E-08 | 1.75 | - |
| 7 | 67,799,600 | rs147549871 | T | G | 0.01411 | 8.76E-09 | 0.56 | |
| 7 | 67,820,045 | rs186736700 | A | C | 0.01966 | 4.88E-09 | 0.61 | - |
| 7 | 67,832,096 | rs117920677 | T | C | 0.01728 | 3.57E-08 | 1.65 | - |
| 14 | 22,325,242 | chr14-22325242-I | I2 | D | 0.02614 | 2.96E-07 | 1.48 | TRAV8-3 |
| 14 | 48,149,514 | rs76049381 | C | G | 0.1388 | 3.06E-07 | 1.23 | MDGA2 |
| 14 | 48,159,954 | chr14-48159954-D | D | I3 | 0.1374 | 3.98E-07 | 1.23 | MDGA2 |
| 14 | 48,161,473 | rs8003717 | T | C | 0.1411 | 7.38E-07 | 0.82 | MDGA2* |
BP: 2009 (GRCh37/hg19) Assembly
Highlighted bold: genome-wide significant (p < 5×10⁻⁸)
MAF = Minor Allele Frequency
SNP genotyped; all other SNPs were imputed
Figure 1.
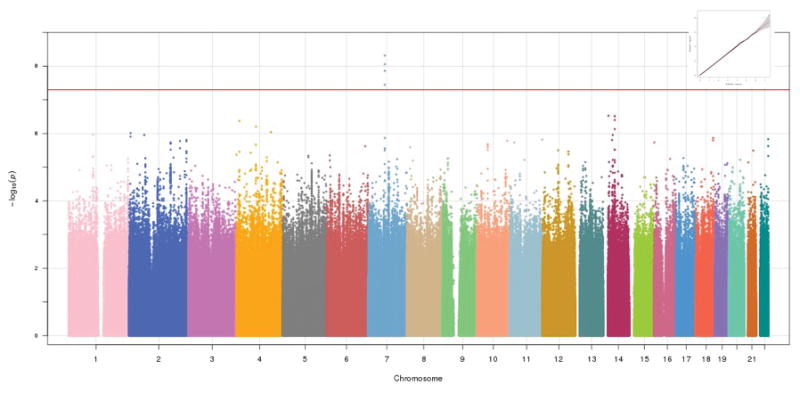
Manhattan plot (and Q-Q plot, inset) of NSS1, NSS2, and PPDS trans-ethnic meta-analysis genome-wide association study (GWAS)
Figure 2.

Locus-zoom plot showing region on Chr 7 containing the genome-wide significant markers in the NSS1, NSS2, and PPDS trans-ethnic meta-analysis
Comparison with UK Biobank Sleep Disturbance and Insomnia Symptom GWAS Findings
We did not observe in our EUR data any association between SNPs recently significantly associated with insomnia in UK Biobank GWASs of sleep disturbance traits21 or insomnia complaints22. However, in our trans-ethnic meta-analysis, we observed nominal association of the UK Biobank genome-wide significant or suggestive results for sleep duration21 including rs1380703 on Chr 2 (p = 0.032; where the longer sleep duration effect allele in the UK Biobank Study is associated with greater odds of insomnia in our study), and rs1456031 (p = 0.036) and rs10953765 (p = 0.051) on Chr 7 (where the shorter sleep duration effect allele in the UK Biobank Study is associated with greater odds of insomnia in our study).
Gene-based and Pathway Analysis
There are 2 significant genes identified via genome-wide gene-association study (GWGAS) with MAGMA after Bonferroni correction for multiple testing. RFX3 (Regulatory Factor X3; gene ID 5591), on chromosome 9, with a p-value = 7.61×10⁻⁷ obtained by aggregating 738 SNPs in the region. C1orf100 (chromosome 1 open reading frame 100; gene ID 200159), on chromosome 1, with a p-value = 1.8×10⁻⁶. We list the top 10 genes with the most significant p-values from NSS and PPDS EUR samples in Supplementary Table 1. There is no overlap of these genes in our EUR group with those significantly associated with insomnia complaints in the UK Biobank study that also used MAGMA.22 However, one of our top two most significant (p = 6.85E-05) genes, RFX3 (Figure 3 and Supplementary Table 6), was nominally associated (p = 0.002) with UK Biobank insomnia severity.22
Figure 3.

Manhattan plot (and Q-Q plot, inset) of NSS1, NSS2, and PPDS combined dataset genome-wide gene-association study (GWGAS)
The pathway enrichment analysis did not identify any significant pathway. We listed the top 10 pathways from NSS and PPDS European samples meta-analyses in Supplementary Table 7.
Genetic Correlations
LDSR
Insomnia disorder was significantly – and positively – genetically correlated with major depressive disorder (rg = 0.44, se = 0.22, p = 0.047) and type 2 diabetes (rg = 0.43, se = 0.20, p = 0.037), but not with bipolar disorder (rg = −0.21, se = 0.22, p = 0.35), neuroticism (rg = 0.280, se = 0.32, p = 0.38), sleep duration (rg = −0.045, se = 0.181, p = 0.80), body mass index (rg = 0.051, se = 0.125, p = 0.68), or coronary artery disease (rg = 0.016, se = 0.158, p = 0.92). Insomnia disorder was also significantly negatively genetically correlated with morningness chronotype (rg = −0.34, se = 0.17, p = 0.039) and subjective well-being (rg = −0.588, se = 0.23, p = 0.009) (Table 4). These correlations were uncorrected for multiple tests.
Table 4.
LDSR determination of genetic correlation in EUR subjects of Insomnia Disorder with other traits (from external study meta-analyses with PubMed ID [PMID] shown)
| Phenotype | PMID | rg | SE (rg) | p |
|---|---|---|---|---|
| Major depressive disorder | 22472876 | 0.44 | 0.22 | 0.047 |
| Bipolar disorder | 21926972 | −0.21 | 0.22 | 0.351 |
| Neuroticism | 24828478 | 0.28 | 0.32 | 0.380 |
| Sleep Duration | 27494321 | −0.05 | 0.18 | 0.802 |
| Body Mass Index | 20935630 | 0.05 | 0.13 | 0.683 |
| Coronary Artery Disease | 26343387 | 0.02 | 0.16 | 0.917 |
| Type 2 Diabetes | 22885922 | 0.43 | 0.20 | 0.037 |
| Chronotype (Morningness) | 27494321 | −0.34 | 0.17 | 0.039 |
| Subjective Well Being | 27089181 | −0.59 | 0.23 | 0.0091 |
| Insomnia | 27992416 | 0.31 | 0.15 | 0.046 |
UK Biobank Insomnia Sleep Disturbance
We calculated genetic correlations in Europeans between our insomnia disorder and UK Biobank sleep disturbance phenotypes.21 We found that insomnia disorder in our study and insomnia in the UK Biobank study were significantly genetically correlated (rg = 0.305 (se 0.153), p = 0.046) (Table 4). Neither UK Biobank sleep duration nor excessive daytime sleepiness phenotypes were significantly genetically correlated with insomnia disorder in our study.
We also determined the extent to which the most recently available UK Biobank polygenic risk score (PRS) for insomnia – derived from their continuous sleeplessness/insomnia severity variable, phenotype #1200 in the UK Biobank GWAS Manifest (https://docs.google.com/spreadsheets/d/1b3oGI2lUt57BcuHttWaZotQcI0-mBRPyZihz87Ms_No/edit#gid=1209628142) -- was associated with insomnia disorder in the STARRS dataset. Results are shown in Supplementary Figure 7 where it can be seen that the UKBiobank PRS for sleepless/insomnia was significantly associated with STARRS insomnia disorder, with the strongest association seen at a p-value threshold of p = 0.1 with OR = 1.09 [95% CI 1.04–1.14] involving 75,123 SNPs.
DISCUSSION
Insomnia is associated with substantial deleterious effects on mental and physical health and quality of life.1, 6 This study is one of the largest GWAS of a phenotype approximating DSM-5 insomnia disorder conducted to date. As anticipated by twin studies, we confirmed evidence of significant heritability of insomnia disorder using genotype data. Furthermore, consistent with the observation from twin studies that insomnia and major depression share common genetic variance,46 using LDSR we found evidence in our EUR samples of a strong and statistically significant positive genetic correlation between insomnia in our study and major depression based on GWAS summary statistics from the Psychiatric Genomics Consortium.37 Nonetheless, the genetic association with insomnia is distinct and not explained fully by MDD since covarying for lifetime MDD had only a modest impact on the strength of this association. We also found evidence of a strong and statistically significant positive genetic correlation between insomnia in our study and type 2 diabetes.41 This latter finding, which was also seen in recent UK Biobank analyses,22 suggests that at least some of the phenotypic association (or “risk”) of insomnia and type 2 diabetes is accounted for by shared genetic factors. Interestingly, a recent publication from the CHARGE consortium documented a genetic correlation between sleep duration and type 2 diabetes, although it was longer sleep duration that was associated with increased type 2 diabetes risk.47 We also found a strong negative genetic correlation between insomnia disorder and subjective well-being, a finding that may speak to shared diatheses for the strong relationship between sleep disturbance and reduced quality of life.
Our strongest association with insomnia disorder, with a haploblock on Chr 7 (q11.22) located in an intergenic region, is approximately 1MB away from the nearest gene (TYW1). Nearby on Chr 7 (q11.22) is also AUTS2, a gene previously associated with alcohol consumption,48 disorders of which are frequently complicated by insomnia.49 Among the other regions implicated in our study are several potentially interesting candidate genes and/or eQTLs with links to brain development and sleep related phenotypes. RFX3, identified as statistically significant in our GWGAS, is a transcription factor involved in development of brain white matter tracts including corpus callosum50 and thalamocortical tract.50, 51 Of potential interest, the thalamocortical tract serves an essential function to coordinate oscillating electrical signals across the brain during sleep.52 RFX3 (which, it should be noted, was also a gene nominally associated with insomnia complaints in the UK BIobank GWGAS)22 was identified in the Broad GTEx database as an eQTL associated with the expression of CARM1P1, a nearby gene on chromosome 9. This indicates the associated SNPs may be functional, but could perhaps act on genes other than RFX3. NTF3 is a neurotrophic factor involved in cortical development53 and synaptogenesis.54 DEC1 is a circadian clock modulator previously shown to be induced by sleep deprivation.55, 56 A genetic homologue of DEC1, DEC2 has been linked to short sleep phenotypes in humans and model organisms57. ANO6 is a membrane bound, non-selective cation channel. The insomnia associated SNP rs74081827 on Chr 12 (p = 6.86E-07) is located within the 3′ UTR of this gene and is an eQTL associated with ANO6 expression. Of potential interest, a similar gene on Chr 19, ANO8 was identified in the gene-based analysis (Table S1), and elsewhere on Chr 12, ANO2 is immediately adjacent to NTF3 that harbors an insomnia associated SNP among AFR subjects. CACNA1D is an L-type calcium channel gene, previously associated with a variety of other conditions including bipolar disorder58, 59 (itself almost invariably associated with sleep disturbance) and cardiometabolic disease.60 A functionally similar L-type calcium channel gene, CACNA1C was previously linked with sleep latency,18 and both CACNA1C and CACNA1D were reported in a genomic pathway analyses to contribute to sleep duration.61 In addition, the T-type calcium channel gene CACNA1I, previously associated with schizophrenia, mediates sleep spindles, a thalamocortical oscillation in stage 2 sleep that also appears to be an endophenotype of schizophrenia.62 Of note, however, our pathway analyses did not highlight a role for calcium channel genes overall.
Our study differs methodologically in several important ways from the recent UK Biobank Studies of sleep disturbance traits21 and insomnia complaints, respectively.22 The former used a one-question phenotype for insomnia symptoms (“Do you have trouble falling asleep at night or do you wake up in the middle of the night” with responses “never/rarely,” “sometimes,” “usually,” and “prefer not to answer”) and dichotomized individuals into controls “never/rarely’” versus cases “usually,” with the middle category (“sometimes”) excluded. It did not specify a time frame (i.e., recent versus remote) or duration, nor did it ascertain the extent to which the insomnia symptoms were associated with disability or distress. Our study more closely approximated lifetime DSM-5 insomnia disorder criteria (without ruling out other sleep disorders or other causes of insomnia) in requiring a specific number and type of symptoms over a minimal duration. In this regard, our phenotype is more similar to the other recent UK Biobank publication that used insomnia complaints to categorize patients as cases or controls,22 but the questions used to arrive at this determination are quite different from our study, making attempts at true replication impossible. In the general population, women suffer insomnia at higher rates than men and onset is often associated with physical problems of aging. Accordingly, insomnia has higher prevalence in older adults, and especially women. These are two groups that are underrepresented in the STARRS samples that consist primarily of young men, but overrepresented in the UK Biobank sample.63 Similarly, the UK Biobank subjects tend to be healthier than the general population, 63 whereas STARRS insomnia subjects are enriched for risk of psychiatric disorders. As such, in important ways, our results are not directly comparable to these other recent analyses. Whereas the several genetic risk loci shared across studies and the finding of a significant genetic correlation for insomnia across studies likely speak to the common genetic features, the newly reported loci revealed in our study of an earlier onset, younger population may confer risk for distinct features of insomnia.
Our results should be interpreted in light of several additional limitations. First, samples sizes – especially within ancestral groups – are insufficiently powered to detect many loci of modest effect. Second, the insomnia disorder phenotype is defined on the basis of self-report only. Accordingly, we are unable to distinguish between different types or causes of insomnia. Third, our sample is mostly male. It may be that the genetic factors influencing insomnia vary by sex, but we lacked the power to test this hypothesis. Fourth, the present study of insomnia disorder constitutes analysis of a secondary trait (i.e., it was not the basis for initial ascertainment and selection of subjects for genotyping) and is therefore subject to possible bias or imprecision in the estimated effect sizes.64 Fifth, the publicly available external GWAS datasets to which we had access consisted solely of individuals of European descent, and therefore the conclusions we have drawn regarding genetic correlations may not generalize to other ancestry groups.
In summary, this set of genome-wide association studies confirms the heritability of insomnia and reveals candidate risk loci. We also find evidence of genetic correlation between insomnia disorder and other psychiatric (e.g., major depressive disorder) and physical (e.g., type 2 diabetes) disorders, suggesting a shared genetic diathesis for these commonly co-occurring phenotypes that recapitulates similar conclusions from prior twin46 and GWAS47 studies, respectively. Additionally, several of the variants identified rest comfortably among loci and pathways already known to be related to sleep and circadian rhythms. Taken together, these results provide insights into the possible molecular bases for insomnia and related conditions and may inform the development of novel therapeutic targets.23–25
Supplementary Material
Acknowledgments
Funding:
Army STARRS was sponsored by the Department of the Army and funded under cooperative agreement number U01MH087981 (2009–2015) with the National Institutes of Health, National Institute of Mental Health (NIH/NIMH). Subsequently, STARRS-LS was sponsored and funded by the Department of Defense (USUHS grant number HU0001-15-2-0004). The contents are solely the responsibility of the authors and do not necessarily represent the views of the Department of Health and Human Services, NIMH, the Department of the Army, or the Department of Defense.
The Army STARRS Team consists of:
Co-Principal Investigators: Robert J. Ursano, MD (Uniformed Services University of the Health Sciences) and Murray B. Stein, MD, MPH (University of California San Diego and VA San Diego Healthcare System)
Site Principal Investigators: Steven Heeringa, PhD (University of Michigan), James Wagner, PhD (University of Michigan) and Ronald C. Kessler, PhD (Harvard Medical School)
Army liaison/consultant: Kenneth Cox, MD, MPH (USAPHC (Provisional))
Other team members: Pablo A. Aliaga, MS (Uniformed Services University of the Health Sciences); COL David M. Benedek, MD (Uniformed Services University of the Health Sciences); Susan Borja, PhD (NIMH); Tianxi Cai, ScD (Harvard School of Public Health); Laura Campbell-Sills, PhD (University of California San Diego); Carol S. Fullerton, PhD (Uniformed Services University of the Health Sciences); Nancy Gebler, MA (University of Michigan); Robert K. Gifford, PhD (Uniformed Services University of the Health Sciences); Paul E. Hurwitz, MPH (Uniformed Services University of the Health Sciences); Kevin Jensen, PhD (Yale University); Kristen Jepsen, PhD (University of California San Diego); Tzu-Cheg Kao, PhD (Uniformed Services University of the Health Sciences); Lisa Lewandowski-Romps, PhD (University of Michigan); Holly Herberman Mash, PhD (Uniformed Services University of the Health Sciences); James E. McCarroll, PhD, MPH (Uniformed Services University of the Health Sciences); Colter Mitchell, PhD (University of Michigan); James A. Naifeh, PhD (Uniformed Services University of the Health Sciences); Tsz Hin Hinz Ng, MPH (Uniformed Services University of the Health Sciences); Caroline Nievergelt, PhD (University of California San Diego); Nancy A. Sampson, BA (Harvard Medical School); CDR Patcho Santiago, MD, MPH (Uniformed Services University of the Health Sciences); Ronen Segman, MD (Hadassah University Hospital, Israel); Alan M. Zaslavsky, PhD (Harvard Medical School); and Lei Zhang, MD (Uniformed Services University of the Health Sciences).
Footnotes
Supplementary information is available at the Molecular Psychiatry website
Access to Data and Data Analysis:
Murray B. Stein MD, MPH had full access to all the data in the study and takes responsibility for the integrity of the data and the accuracy of the data analysis. Drs. Stein, Chen, Jain, McCarthy, and Ripke, as well as Ms. He and Ms. Sun, conducted and are jointly responsible for the data analysis.
CONFLICT OF INTEREST
Dr. Stein has in the past three years been a consultant for Actelion, Aptinyx, Dart Neuroscience, Healthcare Management Technologies, Janssen, Neurocrine Biosciences, Oxeia Biopharmaceuticals, Pfizer, and Resilience Therapeutics. Dr. Stein owns founders shares and stock options in Resilience Therapeutics and has stock options in Oxeia Biopharmaceticals. Dr. Smoller is an unpaid member of the Scientific Advisory Board of PsyBrain, Inc. In the past three years, Dr. Kessler has been a consultant for Hoffman-La Roche, Inc., Johnson & Johnson Wellness and Prevention, and Sanofi-Aventis Groupe. Dr. Kessler has served on advisory boards for Mensante Corporation, Plus One Health Management, Lake Nona Institute, and U.S. Preventive Medicine. Dr. Kessler owns 25% share in DataStat, Inc. The remaining authors report nothing to disclose.
References
- 1.Roth T, Coulouvrat C, Hajak G, Lakoma MD, Sampson NA, Shahly V, et al. Prevalence and perceived health associated with insomnia based on DSM-IV-TR; International Statistical Classification of Diseases and Related Health Problems, Tenth Revision; and Research Diagnostic Criteria/International Classification of Sleep Disorders, Second Edition criteria: results from the America Insomnia Survey. Biol Psychiatry. 2011;69(6):592–600. doi: 10.1016/j.biopsych.2010.10.023. [DOI] [PubMed] [Google Scholar]
- 2.Cunnington D, Junge MF, Fernando AT. Insomnia: prevalence, consequences and effective treatment. Med J Aust. 2013;199(8):S36–40. doi: 10.5694/mja13.10718. [DOI] [PubMed] [Google Scholar]
- 3.Bramoweth AD, Germain A. Deployment-related insomnia in military personnel and veterans. Curr Psychiatry Rep. 2013;15(10):401. doi: 10.1007/s11920-013-0401-4. [DOI] [PMC free article] [PubMed] [Google Scholar]
- 4.Taylor DJ, Pruiksma KE, Hale WJ, Kelly K, Maurer D, Peterson AL, et al. Prevalence, Correlates, and Predictors of Insomnia in the US Army prior to Deployment. Sleep. 2016;39(10):1795–1806. doi: 10.5665/sleep.6156. [DOI] [PMC free article] [PubMed] [Google Scholar]
- 5.Krystal JH, Pietrzak RH, Rosenheck RA, Cramer JA, Vessicchio J, Jones KM, et al. Sleep disturbance in chronic military-related PTSD: clinical impact and response to adjunctive risperidone in the Veterans Affairs cooperative study #504. J Clin Psychiatry. 2016;77(4):483–491. doi: 10.4088/JCP.14m09585. [DOI] [PubMed] [Google Scholar]
- 6.Morin CM, Drake CL, Harvey AG, Krystal AD, Manber R, Riemann D, et al. Insomnia disorder. Nat Rev Dis Primers. 2015;1:15026. doi: 10.1038/nrdp.2015.26. [DOI] [PubMed] [Google Scholar]
- 7.Jackson CL, Redline S, Emmons KM. Sleep as a potential fundamental contributor to disparities in cardiovascular health. Annu Rev Public Health. 2015;36:417–440. doi: 10.1146/annurev-publhealth-031914-122838. [DOI] [PMC free article] [PubMed] [Google Scholar]
- 8.Anothaisintawee T, Reutrakul S, Van Cauter E, Thakkinstian A. Sleep disturbances compared to traditional risk factors for diabetes development: Systematic review and meta-analysis. Sleep Med Rev. 2016;30:11–24. doi: 10.1016/j.smrv.2015.10.002. [DOI] [PubMed] [Google Scholar]
- 9.Fernandez-Mendoza J, Vgontzas AN. Insomnia and its impact on physical and mental health. Curr Psychiatry Rep. 2013;15(12):418. doi: 10.1007/s11920-013-0418-8. [DOI] [PMC free article] [PubMed] [Google Scholar]
- 10.Wentworth BA, Stein MB, Redwine LS, Xue Y, Taub PR, Clopton P, et al. Post-traumatic stress disorder: a fast track to premature cardiovascular disease? Cardiol Rev. 2013;21(1):16–22. doi: 10.1097/CRD.0b013e318265343b. [DOI] [PubMed] [Google Scholar]
- 11.Pollard HB, Shivakumar C, Starr J, Eidelman O, Jacobowitz DM, Dalgard CL, et al. “Soldier’s Heart”: A Genetic Basis for Elevated Cardiovascular Disease Risk Associated with Post-traumatic Stress Disorder. Front Mol Neurosci. 2016;9:87. doi: 10.3389/fnmol.2016.00087. [DOI] [PMC free article] [PubMed] [Google Scholar]
- 12.Wing YK, Zhang J, Lam SP, Li SX, Tang NL, Lai KY, et al. Familial aggregation and heritability of insomnia in a community-based study. Sleep Med. 2012;13(8):985–990. doi: 10.1016/j.sleep.2012.04.013. [DOI] [PubMed] [Google Scholar]
- 13.Heath AC, Kendler KS, Eaves LJ, Martin NG. Evidence for genetic influences on sleep disturbance and sleep pattern in twins. Sleep. 1990;13(4):318–335. doi: 10.1093/sleep/13.4.318. [DOI] [PubMed] [Google Scholar]
- 14.Hublin C, Partinen M, Koskenvuo M, Kaprio J. Heritability and mortality risk of insomnia-related symptoms: a genetic epidemiologic study in a population-based twin cohort. Sleep. 2011;34(7):957–964. doi: 10.5665/SLEEP.1136. [DOI] [PMC free article] [PubMed] [Google Scholar]
- 15.Drake CL, Friedman NP, Wright KP, Jr, Roth T. Sleep reactivity and insomnia: genetic and environmental influences. Sleep. 2011;34(9):1179–1188. doi: 10.5665/SLEEP.1234. [DOI] [PMC free article] [PubMed] [Google Scholar]
- 16.Lind MJ, Aggen SH, Kirkpatrick RM, Kendler KS, Amstadter AB. A Longitudinal Twin Study of Insomnia Symptoms in Adults. Sleep. 2015;38(9):1423–1430. doi: 10.5665/sleep.4982. [DOI] [PMC free article] [PubMed] [Google Scholar]
- 17.Scheinfeldt LB, Gharani N, Kasper RS, Schmidlen TJ, Gordon ES, Jarvis JP, et al. Using the Coriell Personalized Medicine Collaborative Data to conduct a genome-wide association study of sleep duration. Am J Med Genet B Neuropsychiatr Genet. 2015;168(8):697–705. doi: 10.1002/ajmg.b.32362. [DOI] [PMC free article] [PubMed] [Google Scholar]
- 18.Byrne EM, Gehrman PR, Medland SE, Nyholt DR, Heath AC, Madden PA, et al. A genome-wide association study of sleep habits and insomnia. Am J Med Genet B Neuropsychiatr Genet. 2013;162B(5):439–451. doi: 10.1002/ajmg.b.32168. [DOI] [PMC free article] [PubMed] [Google Scholar]
- 19.Gottlieb DJ, Hek K, Chen TH, Watson NF, Eiriksdottir G, Byrne EM, et al. Novel loci associated with usual sleep duration: the CHARGE Consortium Genome-Wide Association Study. Mol Psychiatry. 2015;20(10):1232–1239. doi: 10.1038/mp.2014.133. [DOI] [PMC free article] [PubMed] [Google Scholar]
- 20.Jones SE, Tyrrell J, Wood AR, Beaumont RN, Ruth KS, Tuke MA, et al. Genome-Wide Association Analyses in 128,266 Individuals Identifies New Morningness and Sleep Duration Loci. PLoS Genet. 2016;12(8):e1006125. doi: 10.1371/journal.pgen.1006125. [DOI] [PMC free article] [PubMed] [Google Scholar]
- 21.Lane JM, Liang J, Vlasac I, Anderson SG, Bechtold DA, Bowden J, et al. Genome-wide association analyses of sleep disturbance traits identify new loci and highlight shared genetics with neuropsychiatric and metabolic traits. Nat Genet. 2017;49(2):274–281. doi: 10.1038/ng.3749. [DOI] [PMC free article] [PubMed] [Google Scholar]
- 22.Hammerschlag AR, Stringer S, de Leeuw CA, Sniekers S, Taskesen E, Watanabe K, et al. Genome-wide association analysis of insomnia complaints identifies risk genes and genetic overlap with psychiatric and metabolic traits. Nat Genet. 2017 doi: 10.1038/ng.3888. Epub ahead of print. [DOI] [PMC free article] [PubMed] [Google Scholar]
- 23.Van Someren EJ, Cirelli C, Dijk DJ, Van Cauter E, Schwartz S, Chee MW. Disrupted Sleep: From Molecules to Cognition. J Neurosci. 2015;35(41):13889–13895. doi: 10.1523/JNEUROSCI.2592-15.2015. [DOI] [PMC free article] [PubMed] [Google Scholar]
- 24.Gehrman PR, Keenan BT, Byrne EM, Pack AI. Genetics of Sleep Disorders. Psychiatr Clin North Am. 2015;38(4):667–681. doi: 10.1016/j.psc.2015.07.004. [DOI] [PubMed] [Google Scholar]
- 25.Lind MJ, Gehrman PR. Genetic Pathways to Insomnia. Brain Sci. 2016;6(4) doi: 10.3390/brainsci6040064. [DOI] [PMC free article] [PubMed] [Google Scholar]
- 26.Zheng J, Erzurumluoglu AM, Elsworth BL, Kemp JP, Howe L, Haycock PC, et al. LD Hub: a centralized database and web interface to perform LD score regression that maximizes the potential of summary level GWAS data for SNP heritability and genetic correlation analysis. Bioinformatics. 2017;33(2):272–279. doi: 10.1093/bioinformatics/btw613. [DOI] [PMC free article] [PubMed] [Google Scholar]
- 27.Ursano RJ, Colpe LJ, Heeringa SG, Kessler RC, Schoenbaum M, Stein MB, et al. The Army study to assess risk and resilience in servicemembers (Army STARRS) Psychiatry. 2014;77(2):107–119. doi: 10.1521/psyc.2014.77.2.107. [DOI] [PMC free article] [PubMed] [Google Scholar]
- 28.Kessler RC, Ustun TB. The World Mental Health (WMH) Survey Initiative Version of the World Health Organization (WHO) Composite International Diagnostic Interview (CIDI) Int J Methods Psychiatr Res. 2004;13(2):93–121. doi: 10.1002/mpr.168. [DOI] [PMC free article] [PubMed] [Google Scholar]
- 29.Kessler RC, Coulouvrat C, Hajak G, Lakoma MD, Roth T, Sampson N, et al. Reliability and validity of the brief insomnia questionnaire in the America insomnia survey. Sleep. 2010;33(11):1539–1549. [PMC free article] [PubMed] [Google Scholar]
- 30.Stein MB, Chen CY, Ursano RJ, Cai T, Gelernter J, Heeringa SG, et al. Genome-wide Association Studies of Posttraumatic Stress Disorder in 2 Cohorts of US Army Soldiers. JAMA Psychiatry. 2016;73(7):695–704. doi: 10.1001/jamapsychiatry.2016.0350. [DOI] [PMC free article] [PubMed] [Google Scholar]
- 31.Purcell S, Neale B, Todd-Brown K, Thomas L, Ferreira MA, Bender D, et al. PLINK: a tool set for whole-genome association and population-based linkage analyses. Am J Hum Genet. 2007;81(3):559–575. doi: 10.1086/519795. [DOI] [PMC free article] [PubMed] [Google Scholar]
- 32.Chang CC, Chow CC, Tellier LC, Vattikuti S, Purcell SM, Lee JJ. Second-generation PLINK: rising to the challenge of larger and richer datasets. Gigascience. 2015;4:7. doi: 10.1186/s13742-015-0047-8. [DOI] [PMC free article] [PubMed] [Google Scholar]
- 33.Bulik-Sullivan B, Finucane HK, Anttila V, Gusev A, Day FR, Loh PR, et al. An atlas of genetic correlations across human diseases and traits. Nat Genet. 2015;47(11):1236–1241. doi: 10.1038/ng.3406. [DOI] [PMC free article] [PubMed] [Google Scholar]
- 34.Yang J, Lee SH, Goddard ME, Visscher PM. GCTA: a tool for genome-wide complex trait analysis. Am J Hum Genet. 2011;88(1):76–82. doi: 10.1016/j.ajhg.2010.11.011. [DOI] [PMC free article] [PubMed] [Google Scholar]
- 35.Yang J, Bakshi A, Zhu Z, Hemani G, Vinkhuyzen AA, Lee SH, et al. Genetic variance estimation with imputed variants finds negligible missing heritability for human height and body mass index. Nat Genet. 2015;47(10):1114–1120. doi: 10.1038/ng.3390. [DOI] [PMC free article] [PubMed] [Google Scholar]
- 36.Chen MH, Pan TL, Li CT, Lin WC, Chen YS, Lee YC, et al. Risk of stroke among patients with post-traumatic stress disorder: nationwide longitudinal study. Br J Psychiatry. 2015;206(4):302–307. doi: 10.1192/bjp.bp.113.143610. [DOI] [PubMed] [Google Scholar]
- 37.Major Depressive Disorder Working Group of the Psychiatric GC. Ripke S, Wray NR, Lewis CM, Hamilton SP, Weissman MM, et al. A mega-analysis of genome-wide association studies for major depressive disorder. Mol Psychiatry. 2013;18(4):497–511. doi: 10.1038/mp.2012.21. [DOI] [PMC free article] [PubMed] [Google Scholar]
- 38.Psychiatric GCBDWG. Large-scale genome-wide association analysis of bipolar disorder identifies a new susceptibility locus near ODZ4. Nat Genet. 2011;43(10):977–983. doi: 10.1038/ng.943. [DOI] [PMC free article] [PubMed] [Google Scholar]
- 39.van den Berg SM, de Moor MH, McGue M, Pettersson E, Terracciano A, Verweij KJ, et al. Harmonization of Neuroticism and Extraversion phenotypes across inventories and cohorts in the Genetics of Personality Consortium: an application of Item Response Theory. Behav Genet. 2014;44(4):295–313. doi: 10.1007/s10519-014-9654-x. [DOI] [PMC free article] [PubMed] [Google Scholar]
- 40.Okbay A, Baselmans BM, De Neve JE, Turley P, Nivard MG, Fontana MA, et al. Genetic variants associated with subjective well-being, depressive symptoms, and neuroticism identified through genome-wide analyses. Nat Genet. 2016;48(6):624–633. doi: 10.1038/ng.3552. [DOI] [PMC free article] [PubMed] [Google Scholar]
- 41.Morris AP, Voight BF, Teslovich TM, Ferreira T, Segre AV, Steinthorsdottir V, et al. Large-scale association analysis provides insights into the genetic architecture and pathophysiology of type 2 diabetes. Nat Genet. 2012;44(9):981–990. doi: 10.1038/ng.2383. [DOI] [PMC free article] [PubMed] [Google Scholar]
- 42.Nikpay M, Goel A, Won HH, Hall LM, Willenborg C, Kanoni S, et al. A comprehensive 1,000 Genomes-based genome-wide association meta-analysis of coronary artery disease. Nat Genet. 2015;47(10):1121–1130. doi: 10.1038/ng.3396. [DOI] [PMC free article] [PubMed] [Google Scholar]
- 43.de Leeuw CA, Mooij JM, Heskes T, Posthuma D. MAGMA: generalized gene-set analysis of GWAS data. PLoS Comput Biol. 2015;11(4):e1004219. doi: 10.1371/journal.pcbi.1004219. [DOI] [PMC free article] [PubMed] [Google Scholar]
- 44.Watanabe K, Taskesen E, van Bochoven A, Posthuma D. FUMA: Functional mapping and annotation of genetic associations. bioRxiv. 2017 doi: 10.1038/s41467-017-01261-5. [DOI] [PMC free article] [PubMed] [Google Scholar]
- 45.Consortium GT. The Genotype-Tissue Expression (GTEx) project. Nat Genet. 2013;45(6):580–585. doi: 10.1038/ng.2653. [DOI] [PMC free article] [PubMed] [Google Scholar]
- 46.Lind MJ, Hawn SE, Sheerin CM, Aggen SH, Kirkpatrick RM, Kendler KS, et al. An examination of the etiologic overlap between the genetic and environmental influences on insomnia and common psychopathology. Depress Anxiety. 2017;34(5):453–462. doi: 10.1002/da.22587. [DOI] [PMC free article] [PubMed] [Google Scholar]
- 47.Byrne EM, Gehrman PR, Trzaskowski M, Tiemeier H, Pack AI. Genetic Correlation Analysis Suggests Association between Increased Self-Reported Sleep Duration in Adults and Schizophrenia and Type 2 Diabetes. Sleep. 2016;39(10):1853–1857. doi: 10.5665/sleep.6168. [DOI] [PMC free article] [PubMed] [Google Scholar]
- 48.Schumann G, Coin LJ, Lourdusamy A, Charoen P, Berger KH, Stacey D, et al. Genome-wide association and genetic functional studies identify autism susceptibility candidate 2 gene (AUTS2) in the regulation of alcohol consumption. Proc Natl Acad Sci U S A. 2011;108(17):7119–7124. doi: 10.1073/pnas.1017288108. [DOI] [PMC free article] [PubMed] [Google Scholar]
- 49.Chaudhary NS, Kampman KM, Kranzler HR, Grandner MA, Debbarma S, Chakravorty S. Insomnia in alcohol dependent subjects is associated with greater psychosocial problem severity. Addict Behav. 2015;50:165–172. doi: 10.1016/j.addbeh.2015.06.021. [DOI] [PMC free article] [PubMed] [Google Scholar]
- 50.Benadiba C, Magnani D, Niquille M, Morle L, Valloton D, Nawabi H, et al. The ciliogenic transcription factor RFX3 regulates early midline distribution of guidepost neurons required for corpus callosum development. PLoS Genet. 2012;8(3):e1002606. doi: 10.1371/journal.pgen.1002606. [DOI] [PMC free article] [PubMed] [Google Scholar]
- 51.Magnani D, Morle L, Hasenpusch-Theil K, Paschaki M, Jacoby M, Schurmans S, et al. The ciliogenic transcription factor Rfx3 is required for the formation of the thalamocortical tract by regulating the patterning of prethalamus and ventral telencephalon. Hum Mol Genet. 2015;24(9):2578–2593. doi: 10.1093/hmg/ddv021. [DOI] [PubMed] [Google Scholar]
- 52.Contreras D, Destexhe A, Sejnowski TJ, Steriade M. Control of spatiotemporal coherence of a thalamic oscillation by corticothalamic feedback. Science. 1996;274(5288):771–774. doi: 10.1126/science.274.5288.771. [DOI] [PubMed] [Google Scholar]
- 53.Seuntjens E, Nityanandam A, Miquelajauregui A, Debruyn J, Stryjewska A, Goebbels S, et al. Sip1 regulates sequential fate decisions by feedback signaling from postmitotic neurons to progenitors. Nat Neurosci. 2009;12(11):1373–1380. doi: 10.1038/nn.2409. [DOI] [PubMed] [Google Scholar]
- 54.Wan G, Gomez-Casati ME, Gigliello AR, Liberman MC, Corfas G. Neurotrophin-3 regulates ribbon synapse density in the cochlea and induces synapse regeneration after acoustic trauma. Elife. 2014;3 doi: 10.7554/eLife.03564. [DOI] [PMC free article] [PubMed] [Google Scholar]
- 55.Moller-Levet CS, Archer SN, Bucca G, Laing EE, Slak A, Kabiljo R, et al. Effects of insufficient sleep on circadian rhythmicity and expression amplitude of the human blood transcriptome. Proc Natl Acad Sci U S A. 2013;110(12):E1132–1141. doi: 10.1073/pnas.1217154110. [DOI] [PMC free article] [PubMed] [Google Scholar]
- 56.Kato Y, Kawamoto T, Fujimoto K, Noshiro M. DEC1/STRA13/SHARP2 and DEC2/SHARP1 coordinate physiological processes, including circadian rhythms in response to environmental stimuli. Curr Top Dev Biol. 2014;110:339–372. doi: 10.1016/B978-0-12-405943-6.00010-5. [DOI] [PubMed] [Google Scholar]
- 57.He Y, Jones CR, Fujiki N, Xu Y, Guo B, Holder JL, Jr, et al. The transcriptional repressor DEC2 regulates sleep length in mammals. Science. 2009;325(5942):866–870. doi: 10.1126/science.1174443. [DOI] [PMC free article] [PubMed] [Google Scholar]
- 58.Pinggera A, Striessnig J. Cav 1. 3 (CACNA1D) L-type Ca2+ channel dysfunction in CNS disorders. J Physiol. 2016;594(20):5839–5849. doi: 10.1113/JP270672. [DOI] [PMC free article] [PubMed] [Google Scholar]
- 59.Ross J, Gedvilaite E, Badner JA, Erdman C, Baird L, Matsunami N, et al. A Rare Variant in CACNA1D Segregates with 7 Bipolar I Disorder Cases in a Large Pedigree. Mol Neuropsychiatry. 2016;2(3):145–150. doi: 10.1159/000448041. [DOI] [PMC free article] [PubMed] [Google Scholar]
- 60.Amare AT, Schubert KO, Klingler-Hoffmann M, Cohen-Woods S, Baune BT. The genetic overlap between mood disorders and cardiometabolic diseases: a systematic review of genome wide and candidate gene studies. Transl Psychiatry. 2017;7(1):e1007. doi: 10.1038/tp.2016.261. [DOI] [PMC free article] [PubMed] [Google Scholar]
- 61.Ollila HM, Kettunen J, Pietilainen O, Aho V, Silander K, Kronholm E, et al. Genome-wide association study of sleep duration in the Finnish population. J Sleep Res. 2014;23(6):609–618. doi: 10.1111/jsr.12175. [DOI] [PubMed] [Google Scholar]
- 62.Manoach DS, Pan JQ, Purcell SM, Stickgold R. Reduced Sleep Spindles in Schizophrenia: A Treatable Endophenotype That Links Risk Genes to Impaired Cognition? Biol Psychiatry. 2016;80(8):599–608. doi: 10.1016/j.biopsych.2015.10.003. [DOI] [PMC free article] [PubMed] [Google Scholar]
- 63.Fry A, Littlejohns TJ, Sudlow C, Doherty N, Adamska L, Sprosen T, et al. Comparison of Sociodemographic and Health-Related Characteristics of UK Biobank Participants with the General Population. Am J Epidemiol. 2017 doi: 10.1093/aje/kwx246. Epub ahead of print. [DOI] [PMC free article] [PubMed] [Google Scholar]
- 64.Yung G, Lin X. Validity of using ad hoc methods to analyze secondary traits in case-control association studies. Genet Epidemiol. 2016;40(8):732–743. doi: 10.1002/gepi.21994. [DOI] [PMC free article] [PubMed] [Google Scholar]
Associated Data
This section collects any data citations, data availability statements, or supplementary materials included in this article.