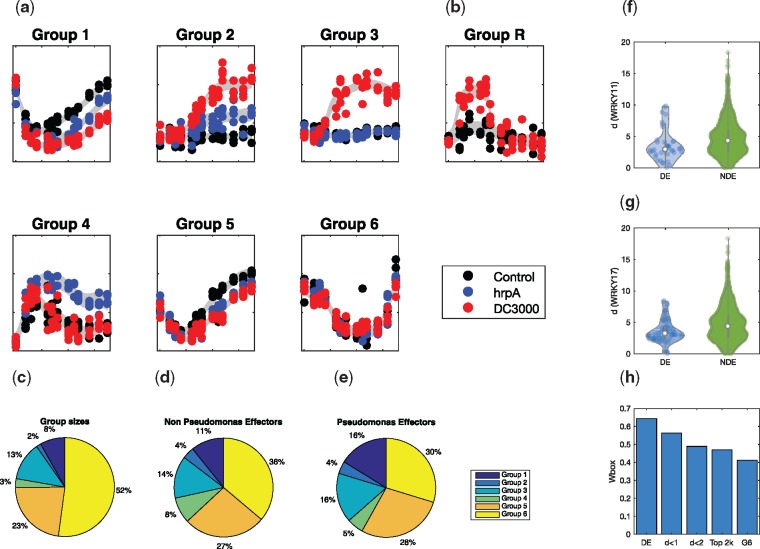
Fig. 2.
Branching processes were fitted to the three Arabidopsis time series, with hyperparameters optimized to MAP values, and the BIC used to select optimal branching structure. (a) Example expression profile plots for each of the different classes of branching. (b) Example expression profile of a branch-recombinant structure within the dataset. (c) The prevalence of each of the six groups within the dataset, compared to the breakdown of non-Pseudomonas effector targets (d), and Pseudomonas-effector targets show a clear enrichment of effector genes (e). (f, g) The Euclidean distance of branching times of genes from that of WRKY11/17 is statistically lower in genes that are DE in WRKY11/17 knockouts versus those that are NDE, indicating that perturbation times are predictive of direct and indirect targets of WRKY11/17. (h) The prevalence of Wbox motifs decreases amongst sets of genes whose branch times are increasingly distant from WRKY11

