Abstract
Motivation
Molecular interactions have widely been modelled as networks. The local wiring patterns around molecules in molecular networks are linked with their biological functions. However, networks model only pairwise interactions between molecules and cannot explicitly and directly capture the higher-order molecular organization, such as protein complexes and pathways. Hence, we ask if hypergraphs (hypernetworks), that directly capture entire complexes and pathways along with protein–protein interactions (PPIs), carry additional functional information beyond what can be uncovered from networks of pairwise molecular interactions. The mathematical formalism of a hypergraph has long been known, but not often used in studying molecular networks due to the lack of sophisticated algorithms for mining the underlying biological information hidden in the wiring patterns of molecular systems modelled as hypernetworks.
Results
We propose a new, multi-scale, protein interaction hypernetwork model that utilizes hypergraphs to capture different scales of protein organization, including PPIs, protein complexes and pathways. In analogy to graphlets, we introduce hypergraphlets, small, connected, non-isomorphic, induced sub-hypergraphs of a hypergraph, to quantify the local wiring patterns of these multi-scale molecular hypergraphs and to mine them for new biological information. We apply them to model the multi-scale protein networks of bakers yeast and human and show that the higher-order molecular organization captured by these hypergraphs is strongly related to the underlying biology. Importantly, we demonstrate that our new models and data mining tools reveal different, but complementary biological information compared with classical PPI networks. We apply our hypergraphlets to successfully predict biological functions of uncharacterized proteins.
Availability and implementation
Code and data are available online at http://www0.cs.ucl.ac.uk/staff/natasa/hypergraphlets.
1 Introduction
Deciphering the complex patterns of interactions between macromolecules in a cell is of crucial importance. Graph theory offers mathematical abstractions to represent and study molecular interactions. Simple graphs (also called networks) have been widely used to model the interactions between pairs of molecules. For instance, in protein–protein interaction (PPI) networks, each node represents a protein and each edge connects a pair of proteins that can bind to each other (Ito et al., 2001; Rolland et al., 2014; Stelzl et al., 2005; Uetz et al., 2000). Exact comparison of networks is a hard problem due to the NP completeness of the underlying subgraph isomorphism problem (Cook, 1971). Thus, simple heuristics have been used to study PPI and other molecular networks, such as degree distribution and centralities (Mason and Verwoerd, 2007). Graphlets quantify the local topology of a network. They are small, non-isomorphic, induced subgraphs of a larger network, which precisely characterize the local wiring patterns around each node (Pržulj, 2007; Pržulj et al., 2004). Graphlets and their statistics have since been used to compare biological networks (Yaveroğlu et al., 2014), to uncover their functional organization (Milenkovic and Pržulj, 2008; Pržulj, 2007; Pržulj et al., 2004; Yaveroğlu et al., 2014), to guide network alignment algorithms (Kuchaiev et al., 2010; Malod-Dognin and Pržulj, 2015) or to relate the wiring patterns of genes in these networks with their biological functions (Davis et al., 2015; Milenkovic and Pržulj, 2008; Yaveroğlu et al., 2014).
However, in biological systems, molecules do not interact solely in a pairwise fashion. Hence, simple graphs do not capture the multi-scale organization of these systems (Klamt et al., 2009; Lacroix et al., 2008). In the example in Figure 1, we observe that the simple graph representation, on the right, of the system on the left blurs the higher-order organization of the system. Given only the network representation on the right, one might, for instance, falsely assume that the nodes b, c and d form a complex of three elements, while it is true that b and d form a complex, b and c form a complex, and c, d and e form a complex.
Fig. 1.
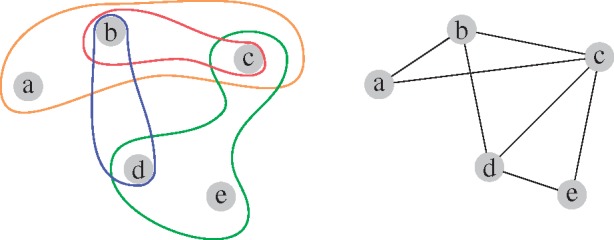
Illustration of a system with higher-order interactions (left) and its simple graphical representation (right)
A solution to overcome this limitation is to model a molecular system using hypergraphs. A hypergraph is defined by a set of nodes, V, and a set of edges, E, called hyperedges, where each hyperedge corresponds to a set of interacting nodes of any size (Berge, 1973). This means that a simple graph is a special case of a hypergraph in which all hyperedges are sets of two nodes. The representation of the system in Figure 1 (left) is a hypergraph. To analyse data modelled as hypergraphs, it is necessary to develop methods to mine the structure of hypergraphs. A number of simple measures from graph theory have already been extended to hypergraphs, e.g. the clustering coefficient (Estrada and Rodríguez-Velázquez, 2006), degree distribution (Latapy et al., 2008) and centralities (Estrada and Rodríguez-Velázquez, 2006; Pearcy et al., 2014). Approaches such as percolation and random walks (Bellaachia and Al-Dhelaan, 2013; Pearcy et al., 2016) have also been extended to study hypergraphs. Hypergraphs have also been used for learning tasks, such as clustering and nodes classification (Pelillo, 2013; Tian et al., 2009). However, hypergraphs lack more advanced descriptors of local topology. Hence, we introduce hypergraphlets, an extension of graphlets to hypernetworks.
We investigate biological hypernetworks in which nodes are proteins and hyperedges capture PPIs, protein complexes or signalling pathways. A protein complex connects two or more proteins that bind together. A pathway connects together any number of proteins whose interactions, including (but not limited to) PPIs, leads to a certain product or change in a cell. The main aim is to check if the topology of these hypernetwork representations of the data carries biological information that goes beyond the information that can be obtained from PPI networks. We use hypergraphlets in this investigation.
2 Contributions
We motivate studying the higher-order molecular interactions as models that capture additional and different biological information than the widely studied PPI networks. We introduce hypergraphlets as a new tool that unveils the pioneering observation of the close link between the multi-scale molecular organization and biological function and that can serve as an underlying methodology for many new tools that will be developed to further study the multi-scale organization of molecular systems.
We analyse the hypergraph representation of protein interactions of yeast Saccharomyces cerevisiae and human and show that proteins that are similarly wired in a hypernetwork, independently of their location in the hypernetwork, tend to have similar biological functions. Also, we use the canonical correlation analysis (CCA) (Hardoon et al., 2004) to correlate hypergraphlets around proteins in these networks with their biological functions. The results confirm the link between the local wiring patterns of the multi-scale molecular organization of the cell and biological functions. We use these findings to predict biological functions of uncharacterized proteins from the wiring patterns of the multi-scale molecular organization. We validate our predictions in the literature.
3 Materials and methods
3.1 Data
We consider six different networks across two species, human and baker’s yeast. For each species, we consider the PPI network and two hypernetworks corresponding to protein complexes and biological pathways. In all networks, nodes correspond to proteins. In a PPI network, an edge between two proteins represents a physical interaction. Depending on the hypernetwork considered, a hyperedge represents either a protein complex or a biological pathway. These data are used jointly to build hypernetworks capturing multi-scale organization of proteins in a cell, as detailed in Section 3.5.
The PPI data is obtained from the BioGRID database (Chatr-Aryamontri et al., 2017) (version 3.4.145). Both pathways hypernetworks come from the Reactome database (Fabregat et al., 2016) (accessed in April 2017). The human protein complexes are downloaded from the CORUM database (Ruepp et al., 2007, 2009) (in May 2017), while the yeast protein complexes are collected from the CYC2008 database (Pu et al., 2009) (last updated in 2009). Table 1 gives an overview of the sizes of the datasets.
Table 1.
Sizes of the data
| Database | No. of proteins | No. of (hyper-) interactions | |
|---|---|---|---|
| CORUM | 3145 | 2138 | |
| Human | Reactome | 9466 | 1461 |
| PPI | 16 008 | 216 865 | |
| Reactome | 1465 | 400 | |
| Yeast | Cyc2008 | 1607 | 406 |
| PPI | 5931 | 87 225 |
To investigate the links between networks and biological functions, we collect gene annotations from the Gene Ontology (GO) Consortium database (Blake et al., 2015) (downloaded at the end of January 2017). For each protein, we keep only the most specific annotations that are experimentally derived. We separate the annotations based on the three categories: biological process (BP), molecular function (MF) and cellular component (CC).
3.2 Hypergraphlets: the local topology of hypergraphs
We define hypergraphlets as small, connected, non-isomorphic, induced sub-hypergraphs of larger hypergraphs. Berge (1973) defines an induced sub-hypergraph of a hypergraph on a set of nodes as the hypergraph HA with set of nodes A and set of unique hyperedges
| (1) |
Note that with this definition, hyperedges containing only one node exist for each node. With this definition, an induced hypergraph is simple, i.e. it has no duplicated edges.
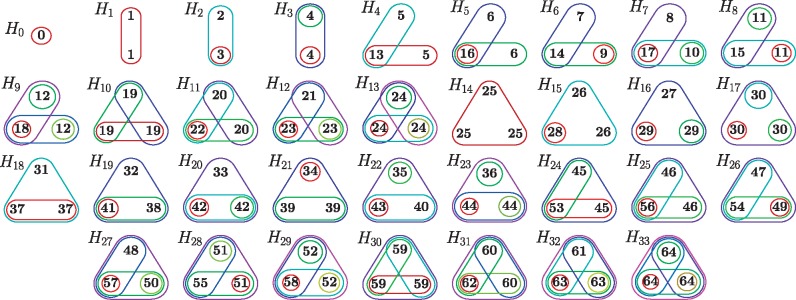
Within a given hypergraph, automorphic nodes are nodes whose labels can be exchanged without changing adjacency relationships. Formally these nodes can be mapped to each other by an automorphism, which is an isomorphism of a hypergraph with itself. An isomorphism is a mapping of nodes of the hypergraph that preserves the adjacency of the nodes (Bondy and Murty, 1976). A set of automorphic nodes form what is called an orbit. Here, we consider all 1- to 4-node hypergraphlets, which contain a total of 6369 different orbits. For 5-node hypergraphlets, we estimate that there are more than a hundred thousands orbits, hence we restrict ourselves to 4-node hypergraphlets. In Figure 2, we illustrate all 65 orbits that occur in the 1- to 3-node hypergraphlets.
Fig. 2.
Illustration of all 1- to 3-node hypergraphlets (H0 to H33) and the 65 orbits. Each closed set corresponds to a hyperedge and each node is represented by an integer between 0 and 64 corresponding to the orbit it belongs to
Analogous to graphlets, we use hypergraphlet orbits to quantify the wiring patterns around each node in a hypergraph. For each orbit i in hypergraphlet h, we define the ith hypergraphlet degree of a node in the hypergraph H as the number of hypergraphlet orbits i that the node touches.
For each node in a hypergraph, we compute all 6369 hypergraphlet degrees resulting in a 6369-dimensional vector where entry i corresponds to the ith hypergraphlet degree of the node. We term this vector capturing the local wiring around a node the hypergraphlet degree vector (HDV).
Considering a hypergraph with n nodes, with maximal hyperedge of size l and with maximal degree of a node d, where the degree of a node corresponds to the number of hyperedges that contain it, an upper bound on the complexity of counting all 1- to k-node hypergraphlets is .
Lugo-Martinez and Radivojac (2017) introduced an alternative definition of hypergraphlets in the context of binary classification problems. They define kernels based on their definition of hypergraphlets and use support vector machines to classify the proteins. The key difference with our definition of hypergraphlets is that they do not consider the hypergraphlets of a hypergraph as induced sub-hypergraphs, thus ignoring some overlaps between hyperedges (Lugo-Martinez and Radivojac, 2017). In particular, in the first step, they ignore all hyperedges containing more than four nodes. Instead, hyperedges with more than four nodes are taken into consideration independently in the second step, which decomposes a hyperedge of size n > 4 into the subsets of four nodes. Hence, with their definition and counting process, an important part of the topology of the hypernetwork is overlooked and therefore topological information is lost, which motivates our redefinition that is also a direct extension of the definition of graphlets for simple graphs. However, we could not compare the two approaches, as their implementation is not publicly available and they recently agreed with us that their definition needed to be changed to alleviate these issues (personal communication).
3.3 Topological distance
We define a distance measure to compare the wiring patterns of two nodes in a hypernetwork (or network, depending on the model considered) as follows. Consider a set of proteins and let M be the matrix representing our data where row i corresponds to the HDV (or GDV) of protein pi. Then, we define the distance, δ, between two proteins pi and pj as
| (2) |
where K corresponds to the set of orbits considered, Mik denotes the entry of M on the ith row and kth column and σk denotes the standard deviation of the distribution of the kth hypergraphlet (or graphlet) orbit degree across our set of data value. Note that to reduce the impact of very large orbit counts, we apply to M an element-wise log transformation.
3.4 Linking local structure to function
We explore two ways to evaluate the link between the local structure of a molecular network and the biological functions of its molecules. First, we cluster the nodes based on the similarity of their wiring patterns defined in Section 3.3, and we do the enrichment analysis of the resulting clusters (Section 3.4.1). Second, we use CCA to test if biological functions tend to be characterized by specific wiring patterns (Section 3.4.2).
3.4.1 Cluster enrichment
We cluster proteins that are similarly wired in a graph or a hypergraph as measured by distance δ [see Equation (2)] and test if the proteins within the same cluster share GO functions.
Clusters are obtained by using k-means method (Hartigan and Wong, 1979) based on the distance defined in Equation (2). For each of various numbers of clusters, k, we run the clustering algorithm 20 times to account for the randomness in the k-means algorithm. For each clustering, we compute the enrichment of clusters in biological annotations for each GO category with correction for multiple hypothesis testing (Benjamini and Hochberg, 1995). We consider a cluster enriched if at least one GO annotation is significantly enriched in the cluster (P-value ). For each value of k, we also compute the average of sum of squared error (SSE) and the normalized mutual information (NMI) (Vinh et al., 2010) considering all 20 repeats. SSE gives a measure of how close proteins within a cluster are on average according to our similarity measure, while NMI evaluates the stability of the clustering across the 20 runs, i.e. if proteins are consistently clustered together or apart. Then, we use ‘the elbow’ analysis of the SSE and NMI with respect to k to choose the optimal number of clusters. For the resulting number of clusters, we select the clustering giving the highest percentage enrichment across the 20 runs of k-means for each GO category. We test the significance of the enrichment with random permutation tests: we keep the same number and size of clusters and randomly assign proteins to each cluster and measure the enrichments of the resulting clusters. We repeat this process 1000 times and compute the significance.
To see whether the two models, networks and hypernetworks, harbour the same or different but complementary biological information, at least to the extent that it can be uncovered by the proposed methodologies, we measured adjusted mutual information (AMI) (Vinh et al., 2010) of the clusters and Jaccard Index (JI) (Jaccard, 1912) of the enriched annotations in the clusters. AMI is a variation of mutual information (MI) used to compare two clusterings. It measures if any pair of proteins is consistently clustered together or apart in both clusterings adjusting for chance. The JI gives a measure of the overlap between the two sets of GO annotations.
3.4.2 Canonical correlation analysis
CCA is used to infer correlations between two sets of features, X and Y. Consider features and over the same elements. Then CCA will identify K pairs , called canonical variates, of linear combinations of features of X and of features of Y, with , such that the correlations of and are maximal over all k. Each canonical variate is associated a score corresponding to the correlation between its two linear combinations.
In our case, the elements are proteins, the first set of features corresponds to the wiring patterns of proteins in networks or hypernetworks, and the second to the biological functions of proteins from GO. As mentioned above, each protein (node) has a GDV from the PPI network and an HDV from the hypernetwork. Hence, we have two matrices of topological features where entries (i, j) correspond to the jth orbit degree of protein i. Also, we associate to each protein three vectors of GO annotations, one for each of the categories: BP, MF and CC. In each of these vectors, an entry is equal to 1 if the gene is annotated with the corresponding GO term, and 0 otherwise. Hence, we form three matrices of biological features, where entries (i, j) correspond to the presence or absence of GO annotation j for protein i.
We compute CCA for each combination of topological features and biological annotations to uncover topology–function relationships in the data.
3.5 Summary of the analysis
As stated above, our main aim is to examine if modelling the higher order of molecular organization harbours additional biological information and to demonstrate that the wiring patterns of biological hypernetworks are strongly linked to the underlying biology.
We compute vectors containing topological information around proteins in the molecular networks: we use graphlets on PPI networks and hypergraphlets on hypergraphs, as described above. To validate our approach, we focus on parts of PPI networks that we know are rich in biological information: protein complexes and pathways. Clearly, not all proteins in a PPI network belong to complexes, or pathways (illustrated in Fig. 3). Hence to validate our method, we consider four sets of proteins: those belonging to pathways in human (human–pathways), those belonging to pathways in yeast (yeast–pathways), those belonging to complexes in human (human–complexes) and those belonging to complexes in yeast (yeast–complexes). For each protein in each of these sets, we have two topological signatures: one from the standard graphlets counted on the entire PPI network and one from the hypergraphlet counts in the hypergraph (HG) that we constructed by using only protein complexes (and equivalently pathways). That is, in an HG, nodes are proteins and each hyperedge represent a protein complex (or pathway) and contains the proteins that belongs to the complex (pathway). For each protein, we also have three biological signatures corresponding to the three levels of GO annotations: BP, MF and CC. We use these as input into the methods described in Sections 3.4.1 and 3.4.2. The results of these validations are presented in Sections 4.1.1 and 4.1.2.
Fig. 3.
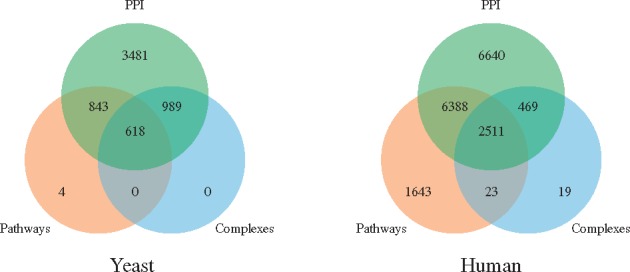
The overlaps of the protein sets of baker’s yeast (left) and human (right). Left: 3481 proteins participate in PPIs only, 843 in PPIs and pathways, 618 in PPIs, pathways and complexes, 989 in PPIs and complexes, while 4 are in pathways only. Right: 6640 proteins participate in PPIs only, 6388 in PPIs and pathways, 2511 in PPIs, pathways and complexes, 469 in PPIs and complexes, 23 in complexes and pathways, while 1643 are in pathways only and 19 in complexes only
The reason for doing these validations on the sets of data for which we know that they are very enriched in biological information (i.e. pathways and complexes) is to demonstrate that our new model and method can correctly identify the biological information. After these validations of the methodology, we use it to perform the analysis of multi-scale protein interaction network data of yeast and human and uncover new biological information. In particular, for each species, we construct a hypergraph that contains all of its PPIs, all of its protein complexes and all of its pathways; i.e. nodes are proteins and hyperedges correspond to PPIs, protein complexes and pathways. The results of analysing these hypergraphs with our methods are presented in Section 4.2.
4 Results & discussion
4.1 Validation of our methodology
4.1.1 Enrichment analysis
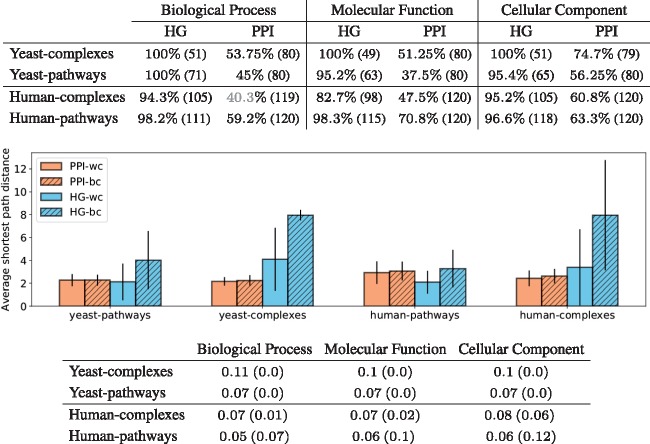
Having computed the topological vectors from both network models (PPI and HG) for each protein of each of the four sets of proteins described in Section 3.5 (human–pathways, human–complexes, yeast–pathways and yeast–complexes), we apply the methodology detailed in Section 3.4.1 to investigate if similarly wired proteins have similar functions. Interestingly, the percentage of enriched clusters is relatively stable as we increase the number of clusters. Hence, any partitioning of the proteins based on the local wiring patterns in a network, quantified by using graphlets or hypergraphlets, captures the underlying biological information (see Fig. 4). This underlines the crucial role played by the way proteins interact in determining protein function without any information about their sequence, or interacting partners. Furthermore, when examining the clusterings obtained at a specific number of clusters, k (see Section 3.4.1 for details on how k is chosen), we observe that the enrichments (top table in Fig. 5) are all statistically significant, except for the one in grey. Importantly, clusters obtained from HG models are more enriched than those obtained from PPI networks. This result validates the relevance of our HG modelling in capturing the underlying biological information and underlines the potential of hypergraphlets for mining molecular hypernetworks.
Fig. 4.
The panels give the average percentage of clusters enriched with respect to the total number of clusters for yeast–complexes (left) and yeast–pathways (right), the standard deviation is not represented to avoid overcrowding the panels. The colours represent the models from which the clustering is obtained: HG in blue and PPI in orange. The type of line represents the category of GO annotations: BP are full lines, MF are dashed lines and CC are dotted line. The black vertical lines signal the number of clusters selected from the set of NMI and SSE curves according to the procedure described in Section 3.4.1
Fig. 5.
The top table presents the maximum enrichment measured across clusterings obtained with the ‘optimal’ number of clusters (80 for yeast and 120 for human). The number in parenthesis is the number of non-empty clusters. The colour indicates the statistical significance of the maximum enrichment with respect to random permutation tests: black indicates a significant value, grey a non-significant one. The middle panel gives, for each type of model (HG in blue and PPI in orange), the average of the shortest path lengths within the clusters (wc) and between clusters (bc) of the best clustering obtained for GO–BP annotations. The results are similar for other GO categories and are not presented here due to space limitations. The bottom table presents the results of comparing the obtained clusterings. We use the HG clustering as baseline and compute the AMI between the clusterings and the JI (in parenthesis) between the sets of enriched GO terms
To further investigate the clusterings, we compute for each the average shortest path distances, in the corresponding (hyper-)network, between pairs of proteins belonging to the same clusters (‘within-clusters’) and between pairs of proteins which are in different clusters (‘between-clusters’; see middle panel in Fig. 5). We observe a larger gap between within-cluster and between-clusters average shortest path lengths for clustering obtained from higher-order molecular organization than from clusterings obtained from PPI networks. Hence, proteins that are topologically similar in the HG model in addition to sharing biological functions tend to be at shorter distance from each other. This result is consistent with the literature on ‘guilt by associations’, which predicts protein functions from their neighbourhoods in molecular networks (Vazquez et al., 2003).
Finally, we observe that the clusterings obtained from the PPI model are different from those obtained from the HG model both in terms of GO annotations that are enriched and in terms of clustered proteins (see bottom table in Fig. 5). This is because a JI close to 0 means that the sets of the enriched GO terms in the PPI and HG clusterings tend not to overlap. Also, AMI scores below 0.1 mean that pairs of proteins belonging to the same clusters in one clustering are typically in different clusters in the other clustering. This demonstrates that modelling the interactomes by hypergraphs will uncover new biological information that cannot be uncovered from the analysis of PPI networks. Also, it demonstrates the complementarity of the two representations and that the two are capturing different underlying biological information.
4.1.2 Canonical correlation analysis
We investigate the existence of specific topology-function links, i.e. the connection between specific hypergraphlets (or graphlets) and GO annotations by using CCA described in Section 3.4.2. We apply it on the same PPI and HG of yeast and human used in the clustering and enrichment analysis (Section 4.1.1): for each set of proteins, we compute the CCA between the topology-containing vectors of each of the associated models (PPI and HG) and the vector of GO annotations for each category (BP, MF and CC). Due to space limitations, we present only the results obtained for yeast and GO–BP annotations. We obtain similar results in all other cases and the discussion below holds for them as well.
We observe that each model has a number of canonical variates with correlation close to 1 (Fig. 6), which indicates a strong topology–function relationship in these data that was previously highlighted in the context of economic network data (Yaveroğlu et al., 2014). In particular, this means that some functions are strongly linked to specific wiring patterns and thus, local topology can potentially be used for predicting protein functions. For that purpose, hypergraphlets of HGs have a strong advantage over graphlets of PPI networks in the number of canonical variates with a score close to 1, which is 3 to 13 times more variates with HGs. This is also expected, since we chose our hypernetworks to model already function rich parts of molecular networks, protein complexes and pathways, and it validates our methodology.
Fig. 6.
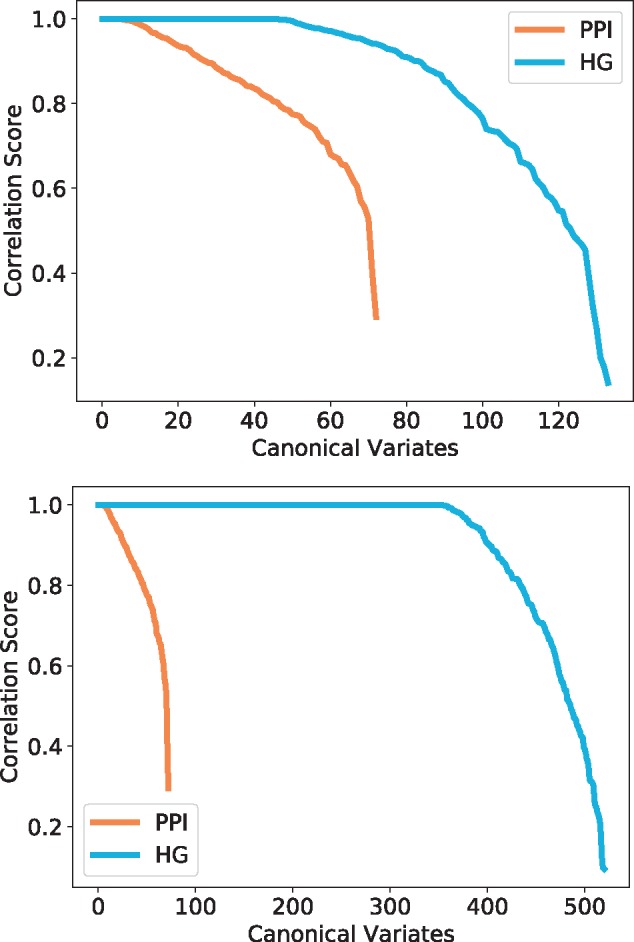
Canonical correlation score distribution for yeast–complexes (top) and yeast–pathways (bottom). The canonical variates represented are all statistically significant (P-value ) and are sorted by correlation score. The colours represent the model and the topological signatures from which the canonical variates are obtained: HG in blue and PPI in orange
In Figure 7, we take a closer look at the most significant CCA variate. The variate score of 1.0 links a linear combination of GO annotations to a linear combination of hypergraphlets orbits. For instance, this means that a gene annotated with positive regulation of barrier spectrum assembly (GO: 0010973) will likely have a relatively large orbit degree in the hypernetwork. Why these specific orbits are linked to these functions is a question that is outside of the scope of this study and that needs to be further investigated. We find that the GO terms identified here are also biologically coherent: each of the GO–BP terms denoted in blue text in Figure 7 is annotating at least one protein conjointly with at least one other annotation, that is also denoted in blue text in Figure 7, according to QuickGO search engine (Binns et al., 2009). Furthermore, the only remaining annotation, cell cycle arrest (GO: 0007050), has been linked to the MAPK pathway in the literature (Pumiglia and Decker, 1997), as have been most of the other terms (Gustin et al., 1998; Madhani and Fink, 1998). Hence, the entire set of GO annotations presented in Figure 7 is biologically coherent, which validates the relevance of the canonical variate and of our hypergraph-based methodology in capturing functional information.
Fig. 7.
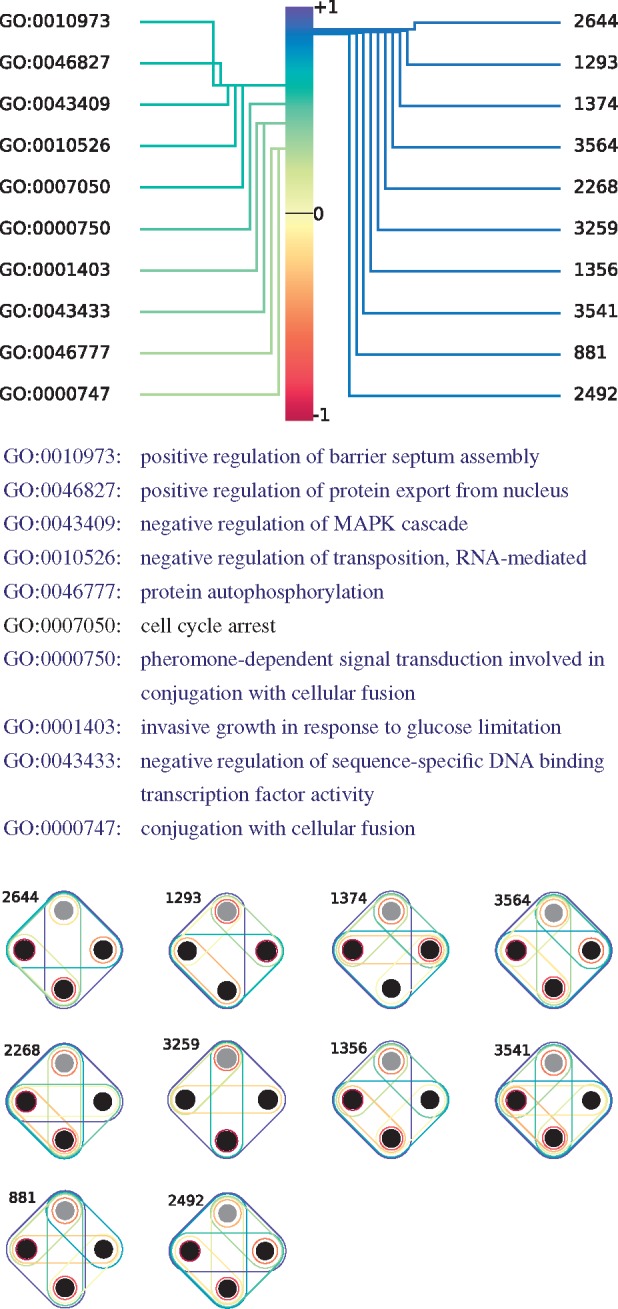
The most significant CCA variate between HDVs of the proteins of yeast–pathways and their GO-BP annotations. The correlation score between the linear combination of annotations and the linear combination of hypergraphlet orbits is 1. The annotations (orbits) illustrated above correspond to the 10 that have the highest Pearson’s correlation scores with respect to the linear combinations of annotations (orbits). Each GO term in blue font is annotating at least one protein conjointly with at least one other annotation that is also denoted in blue font, according to QuickGO ontology search engine (Binns et al., 2009)
4.2 Analysing multi-scale molecular organization
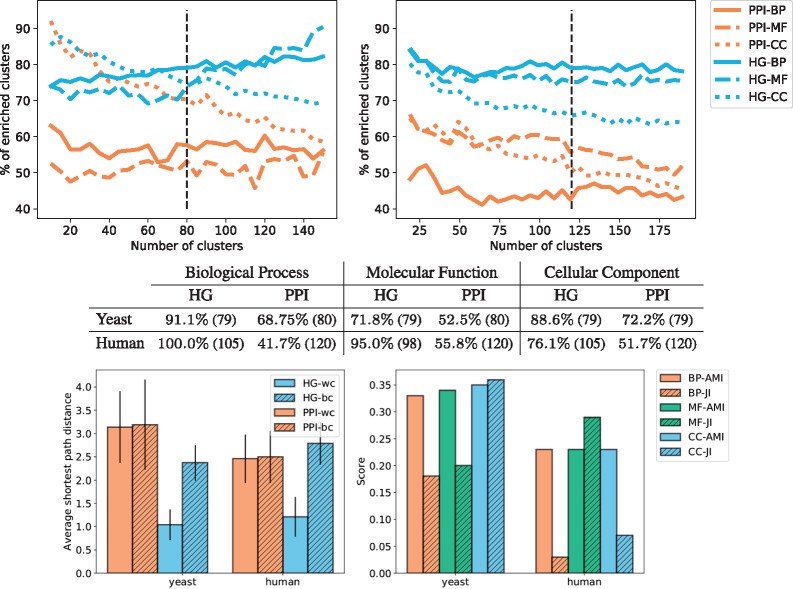
To explicitly capture the multi-scale organization of protein interactions, we model them by a hypernetwork containing all PPIs, all protein complexes and all biological pathways as hyperedges (detailed in Section 3.5). To assess if the wiring patterns in our new HG model capture the biological functions of proteins, we do the clustering and enrichment analysis (Section 3.4.1), as well as the CCA (Section 3.4.2) on these hypernetworks of baker’s yeast and human. We compare the results with those that we obtain by applying the same methodologies to PPI networks. In these unifying HG models of multi-scale molecular organization, we observe that clusterings of the proteins based on their topological vectors in a network, obtained by using graphlets or hypergraphlets, capture the underlying biological information (see the top panels of Fig. 8). Furthermore, the clusters obtained from the hypernetwork topology lead to higher enrichments in GO–BP, GO–MF and GO–CC annotations. This shows that our newly proposed model, regardless of the choice of the total number of clusters, k, captures more protein biological function in its topology than the standard PPI networks.
Fig. 8.
The top panels give the average percentages of clusters enriched with respect to the total number of clusters for yeast (left) and human (right), the standard deviation is not represented to avoid overcrowding the panels. The colours represent the models from which the clustering is obtained: HG in blue and PPI in orange. The type of line represents the category of GO annotations: BP are full lines, MF are dashed lines and CC are dotted lines. The black vertical lines denote the number of clusters selected from the set of NMI and SSE curves according to the procedure described in Section 3.4.1. The middle table presents the maximum enrichment measured across clusterings obtained with the ‘optimal’ number of clusters (denoted by the black vertical lines in the top panels). The number in parenthesis is the number of non-empty clusters. All enrichments are significant. The bottom left panel gives, for each type of model (HG in blue and PPI in orange), the average of the shortest path lengths within the clusters (wc) and between clusters (bc) of the best clustering obtained for GO-BP annotations. The results are similar for other GO categories and are not presented here due to space limitations. The bottom right panel represents the results of the comparison of the obtained clusterings. We use the HG clustering as baseline and compute the AMI between the clusterings and the JI between the sets of enriched GO terms
When choosing the number of clusters, k, according to the criteria detailed in Section 3.4.1, we observe that all enrichments are statistically significant and that the HG models allow for an increase of over 15% in the number of enriched clusters when compared with the PPI networks. This finding underlines the link between multi-scale interaction patterns and biological functions. Interestingly, when investigating the clusters, we observe that a majority of the proteins in the non-enriched clusters only have reported PPIs, but not any pathways or complexes that they belong to. This is true for 59% of the proteins in the HG model of yeast and 38% of the proteins in the HG model of human. This might be due to incompleteness of the pathways and protein complexes data. Our results indicate that when more complete data on complexes and pathways becomes available, our methodology will be able to extract additional biological information.
We observe that proteins clustered using topological features derived from representations of multi-scale molecular organization tend to also be closer in terms of shortest path distances compared with those obtained by clusterings based on the topology of PPI networks (see bottom left panel in Fig. 8). Interestingly, most proteins clustered together in the HG models are direct neighbours or second neighbours. Hence, the fact that we obtain enriched biological functions in those clusters is consistent with empirical evidences showing that 70–80% of interacting proteins share at least one function. Those evidences were the motivation for the majority rule used in the literature for functional prediction (Vazquez et al., 2003).
Finally, we observe that the clusterings obtained from the PPI models are different from those obtained from the HG models both in terms of GO annotations that are enriched, with a JI below 0.25, and in terms of similarity of clusters, with an AMI below 0.35 (see bottom right panel in Fig. 8). This confirms that our multi-scale model is not equivalent to the standard PPI network and uncover additional biological information complementary to that of the PPI network.
Using CCA (Section 3.4.2), we observe that each model has high scoring canonical variates, which indicates that some functions are strongly linked to specific wiring patterns (see Fig. 9). For that purpose, hypergraphlets of our new HG models have an advantage over graphlets of PPI networks in the number of canonical variates with high correlation score: it has over 300 canonical variates with score greater than 0.9 compared with only 10 for PPI networks. This indicates that the HG model’s local wiring patterns are more correlated with the underlying biology that those of the PPI networks.
Fig. 9.
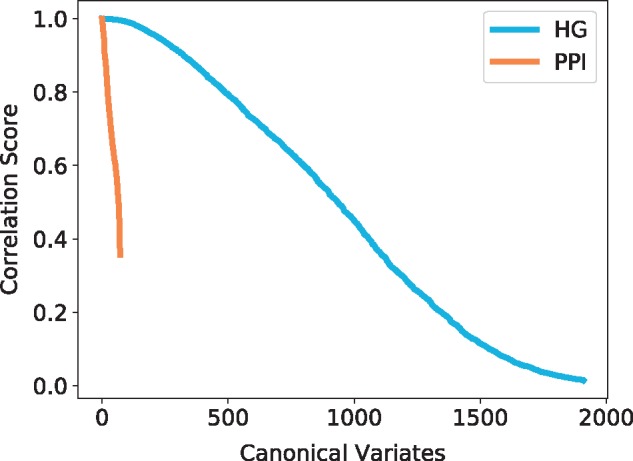
Canonical correlation score distribution for the human hypernetwork. The canonical variates represented are all statistically significant (P-value ) and are sorted by correlation score. The colours represent the model and the topological signatures from which the canonical variates are obtained: HG in blue and PPI in orange
Finally, we use the clusterings to investigate the potential of our newly proposed models in conjunction with our hypergraphlets to predict protein functions. As demonstrated above, we identified clusters of proteins with significantly enriched GO annotations. We use these clusters to predict the functions of proteins. For each GO category, we identify two disjoint sets of proteins in each of our hypernetworks: the set of proteins that are experimentally annotated with at least one of the enriched GO terms in their cluster (on which the enrichment computations are based) and the set of proteins that have some predicted annotation in the GO database.
First, we consider the second set and investigate how many of those proteins have at least one of the enriched terms of their cluster as their predicted GO annotation (Blake et al., 2015). For GO–BP, this set contains 11 686 proteins for human (4161 for yeast). For GO–MF, it contains 7243 proteins for human (3586 for yeast). For GO-CC, it contains 6589 proteins for human (3510 for yeast). We show that out of these proteins, about 5% for yeast and 15–23% for human have been putatively annotated in GO with at least one of our enriched functions in their clusters (see Fig. 10), which validates our approach.
Fig. 10.
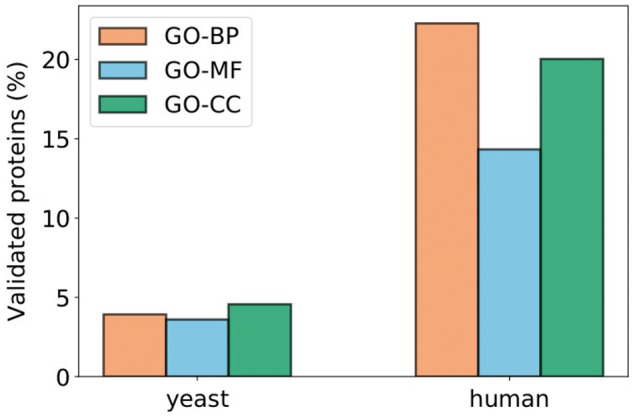
Percentages of proteins that have at least one of the enriched terms of their clusters in their set of predicted GO annotations (obtained from the GO database; Blake et al., 2015). The values correspond to the number of such proteins out of the number of proteins that have at least one putative annotation in the GO database and are not experimentally annotated with any of the enriched terms of their clusters
Second, we focus on the proteins of the hypernetworks that are unannotated in GO database (this corresponds to 994 proteins for human and 97 proteins for yeast) and investigate the GO–BP annotations we predict for them. We predict function for each of these proteins by associating it with the enriched experimentally obtained GO term that annotates the most proteins in its cluster. We survey the literature to validate some of our predictions for human (the top predictions correspond to the most statistically significantly enriched GO terms). All predictions are available online at http://www0.cs.ucl.ac.uk/staff/natasa/hypergraphlets/. We predict that HIST1H2AJ is involved in nucleosome assembly (GO: 0006334), which is confirmed in the literature (Díaz-Jullien et al., 1996). We further predict that XIST is linked to chromatin organization (GO: 0006325), which has also been highlighted in past studies (Brockdorff et al., 1992). We also predict that NME1–NME2 (an unknown protein encoded between NME1 and NME2 in the DNA) is involved in cell proliferation (GO: 0008283). The function of this protein is not yet established (Li et al., 2013), however, NME2 has been linked to reduction of cell proliferation (Liu et al., 2015) and proteins encoded in the neighbour locations of the DNA tend to have similar function (Feuerborn and Cook, 2015). For microRNA mir-3606, we predict a role in collagen fibril organization (GO: 0030199). Collagen plays a key role in cell adhesion, which can involve integrin (Jokinen et al., 2004; Testaz and Duband, 2001) and mir-3606 has been linked to integrin in the literature as it has been suggested that mir-3606 can bind to ITGA4 (integrin subunit alpha 4) (Wong and Wang, 2014). Finally, we propose that LOC101929876 (40S ribosomal protein S26) is involved in rRNA processing (GO: 0006364), which is corroborated by the Reactome database in which the protein is associated with a major pathway of rRNA processing in the nucleolus and cytosol (Fabregat et al., 2016).
These results confirm the ability of our hypergraphlets to predict biological functions of proteins from the wiring patterns in our novel model capturing multi-scale organization of proteins in a cell.
5 Conclusion
We highlight the importance of considering the higher-order organization of protein interactions in conjunction with the standard PPI networks. We propose a novel methodology, hypergraphlets, to quantify the local wiring patterns of hypergraphs. We apply it to biological hypernetworks representing protein complexes and pathways of yeast and human and demonstrate a strong link between hypernetwork structure and the function of the proteins. Our novel methodology is able to mine the biological information hidden in the multi-scale architecture of molecular organization. Furthermore, our analysis highlights the superiority, in terms of uncovering the underlying biology, of our multi-scale model when compared with the standard PPI networks. Additionally, we demonstrate that our new hypernetwork model, combined with our hypergraphlets, can be used for functional predictions.
Despite a simple functional prediction approach, we obtain promising results when using hypergraphlets on our new multi-scale model for functional predictions. It would be interesting to train an advanced machine learning model, such as random forest, using HDVs as features in an effort to improve predictions. Finally, we have demonstrated that the union of networks capturing the multi-scale molecular organization is strongly linked to the underlying biology of the molecules. It would be interesting to further investigate if different data integration methods could lead to even more biologically relevant models.
Funding
This work was supported by UCL Computer Science departmental funds, the European Research Council (ERC) Starting Independent Researcher [grant 278212], the European Research Council (ERC) Consolidator [grant 770827], the Serbian Ministry of Education and Science Project III44006, the Slovenian Research Agency project J1-8155 and the awards to establish the Farr Institute of Health Informatics Research, London, from the Medical Research Council, Arthritis Research UK, British Heart Foundation, Cancer Research UK, Chief Scientist Office, Economic and Social Research Council, Engineering and Physical Sciences Research Council, National Institute for Health Research, National Institute for Social Care and Health Research, and Wellcome Trust [grant MR/K006584/1] and UK Medical Research Council (MC_U12266B).
Conflict of Interest: none declared.
References
- Bellaachia A., Al-Dhelaan M. (2013) Random walks in hypergraph. In: Proceedings of the 2013 International Conference on Applied Mathematics and Computational Methods, Venice, Italy, pp. 187–194.
- Benjamini Y., Hochberg Y. (1995) Controlling the false discovery rate: a practical and powerful approach to multiple testing. J. R. Stat. Soc. B Methodol., 57, 289–300. [Google Scholar]
- Berge C. (1973) Graphs and Hypergraphs, Volume 6. North-Holland Publishing Company, Amsterdam. [Google Scholar]
- Binns D. et al. (2009) Quickgo: a web-based tool for Gene Ontology searching. Bioinformatics, 25, 3045–3046. [DOI] [PMC free article] [PubMed] [Google Scholar]
- Blake J.A. et al. (2015) Gene Ontology Consortium: going forward. Nucleic Acids Res., 43, D1049–D1056. [DOI] [PMC free article] [PubMed] [Google Scholar]
- Bondy J.A., Murty U.S.R. (1976) Graph Theory with Applications, Volume 290. Macmillan, London. [Google Scholar]
- Brockdorff N. et al. (1992) The product of the mouse Xist gene is a 15 kb inactive x-specific transcript containing no conserved ORF and located in the nucleus. Cell, 71, 515–526. [DOI] [PubMed] [Google Scholar]
- Chatr-Aryamontri A. et al. (2017) The BioGRID interaction database: 2017 update. Nucleic Acids Res., 45, D369–D379. [DOI] [PMC free article] [PubMed] [Google Scholar]
- Cook S.A. (1971) The complexity of theorem-proving procedures. In: Proceedings of the Third Annual ACM Symposium on Theory of Computing, pp. 151–158. ACM, Shaker Heights, Ohio, USA.
- Davis D. et al. (2015) Topology-function conservation in proteinsiumtein interaction networks. Bioinformatics, 31, 1632–1639. [DOI] [PMC free article] [PubMed] [Google Scholar]
- Díaz-Jullien C. et al. (1996) Prothymosin α binds histones in vitro and shows activity in nucleosome assembly assay. Biochim. Biophys. Acta Protein Struct. Mol. Enzymol., 1296, 219–227. [DOI] [PubMed] [Google Scholar]
- Estrada E., Rodríguez-Velázquez J.A. (2006) Subgraph centrality and clustering in complex hyper-networks. Phys. A Stat. Mech. Appl., 364, 581–594. [Google Scholar]
- Fabregat A. et al. (2016) The reactome pathway knowledgebase. Nucleic Acids Res., 44, D481–D487. [DOI] [PMC free article] [PubMed] [Google Scholar]
- Feuerborn A., Cook P.R. (2015) Why the activity of a gene depends on its neighbors. Trends Genet., 31, 483–490. [DOI] [PubMed] [Google Scholar]
- Gustin M.C. et al. (1998) Map kinase pathways in the yeast Saccharomyces cerevisiae. Microbiol. Mol. Biol. Rev., 62, 1264–1300. [DOI] [PMC free article] [PubMed] [Google Scholar]
- Hardoon D.R. et al. (2004) Canonical correlation analysis: an overview with application to learning methods. Neural Comput., 16, 2639–2664. [DOI] [PubMed] [Google Scholar]
- Hartigan J.A., Wong M.A. (1979) Algorithm as 136: a k-means clustering algorithm. J. R. Stat. Soc. Ser. C Appl. Stat., 28, 100–108. [Google Scholar]
- Ito T. et al. (2001) A comprehensive two-hybrid analysis to explore the yeast protein interactome. Proc. Natl. Acad. Sci. USA, 98, 4569–4574. [DOI] [PMC free article] [PubMed] [Google Scholar]
- Jaccard P. (1912) The distribution of the flora in the alpine zone. New Phytol., 11, 37–50. [Google Scholar]
- Jokinen J. et al. (2004) Integrin-mediated cell adhesion to type i collagen fibrils. J. Biol. Chem., 279, 31956–31963. [DOI] [PubMed] [Google Scholar]
- Klamt S. et al. (2009) Hypergraphs and cellular networks. PLoS Comput. Biol., 5, 1–6. [DOI] [PMC free article] [PubMed] [Google Scholar]
- Kuchaiev O. et al. (2010) Topological network alignment uncovers biological function and phylogeny. J. R. Soc. Interface, doi: 10.1098/rsif.2010.0063. [DOI] [PMC free article] [PubMed] [Google Scholar]
- Lacroix V. et al. (2008) An introduction to metabolic networks and their structural analysis. IEEE/ACM Trans. Comput. Biol. Bioinformatics, 5, 594–617. [DOI] [PubMed] [Google Scholar]
- Latapy M. et al. (2008) Basic notions for the analysis of large two-mode networks. Social Netw., 30, 31–48. [Google Scholar]
- Li R.W. et al. (2013) Transcriptomic alterations in human prostate cancer cell lncap tumor xenograft modulated by dietary phenethyl isothiocyanate. Mol. Carcinogen., 52, 426–437. [DOI] [PubMed] [Google Scholar]
- Liu Y-f. et al. (2015) Nme2 reduces proliferation, migration and invasion of gastric cancer cells to limit metastasis. PLoS One, 10, e0115968.. [DOI] [PMC free article] [PubMed] [Google Scholar]
- Lugo-Martinez J., Radivojac P. (2017) Classification in biological networks with hypergraphlet kernels. arXiv: 1703.04823. [DOI] [PMC free article] [PubMed]
- Madhani H.D., Fink G.R. (1998) The control of filamentous differentiation and virulence in fungi. Trends Cell Biol., 8, 348–353. [DOI] [PubMed] [Google Scholar]
- Malod-Dognin N., Pržulj N. (2015) L-GRAAL: Lagrangian graphlet-based network aligner. Bioinformatics, 31, 2182–2189. [DOI] [PMC free article] [PubMed] [Google Scholar]
- Mason O., Verwoerd M. (2007) Graph theory and networks in biology. IET Syst. Biol., 1, 89–119. [DOI] [PubMed] [Google Scholar]
- Milenkovic T., Pržulj N. (2008) Uncovering biological network function via graphlet degree signatures. Cancer Inform., 6, 257–273. [PMC free article] [PubMed] [Google Scholar]
- Pearcy N. et al. (2014) Hypergraph models of metabolism. Int. J. Biol. Biomol. Agric. Food Biotechnol. Eng., 8, 19–23. [Google Scholar]
- Pearcy N. et al. (2016) Complexity and robustness in hypernetwork models of metabolism. J. Theor. Biol., 406, 99–104. [DOI] [PubMed] [Google Scholar]
- Pelillo M. (2013) A game-theoretic approach to hypergraph clustering. Advances in Neural Information Processing Systems, 35, 1312–1327. [DOI] [PubMed] [Google Scholar]
- Pržulj N. (2007) Biological network comparison using graphlet degree distribution. Bioinformatics, 23, e177–e183. [DOI] [PubMed] [Google Scholar]
- Pržulj N. et al. (2004) Modeling interactome: scale-free or geometric? Bioinformatics, 20, 3508–3515. [DOI] [PubMed] [Google Scholar]
- Pu S. et al. (2009) Up-to-date catalogues of yeast protein complexes. Nucleic Acids Res., 37, 825–831. [DOI] [PMC free article] [PubMed] [Google Scholar]
- Pumiglia K.M., Decker S.J. (1997) Cell cycle arrest mediated by the mek/mitogen-activated protein kinase pathway. Proc. Natl. Acad. Sci. USA, 94, 448–452. [DOI] [PMC free article] [PubMed] [Google Scholar]
- Rolland T. et al. (2014) A proteome-scale map of the human interactome network. Cell, 159, 1212–1226. [DOI] [PMC free article] [PubMed] [Google Scholar]
- Rota Bulo S., Pelillo M. (2013) A game-theoretic approach to hypergraph clustering. Adv. Neural Inform. Process. Syst., 35, 1312–1327. [DOI] [PubMed] [Google Scholar]
- Ruepp A. et al. (2007) CORUM: the comprehensive resource of mammalian protein complexes. Nucleic Acids Res., 36, D646.. [DOI] [PMC free article] [PubMed] [Google Scholar]
- Ruepp A. et al. (2009) CORUM: the comprehensive resource of mammalian protein complexes-2009. Nucleic Acids Res., 38, D497–D501. [DOI] [PMC free article] [PubMed] [Google Scholar]
- Stelzl U. et al. (2005) A human protein-protein interaction network: a resource for annotating the proteome. Cell, 122, 957–968. [DOI] [PubMed] [Google Scholar]
- Testaz S., Duband J.-L. (2001) Central role of the α4β1 integrin in the coordination of avian truncal neural crest cell adhesion, migration, and survival. Dev. Dyn., 222, 127–140. [DOI] [PubMed] [Google Scholar]
- Tian Z. et al. (2009) A hypergraph-based learning algorithm for classifying gene expression and array CGH data with prior knowledge. Bioinformatics, 25, 2831–2838. [DOI] [PubMed] [Google Scholar]
- Uetz P. et al. (2000) A comprehensive analysis of protein–protein interactions in Saccharomyces cerevisiae. Nature, 403, 623. [DOI] [PubMed] [Google Scholar]
- Vazquez A. et al. (2003) Global protein function prediction from protein-protein interaction networks. Nat. Biotechnol., 21, 697.. [DOI] [PubMed] [Google Scholar]
- Vinh N.X. et al. (2010) Information theoretic measures for clusterings comparison: variants, properties, normalization and correction for chance. J. Mach. Learn. Res., 11, 2837–2854. [Google Scholar]
- Wong N., Wang X. (2014) miRDB: an online resource for microRNA target prediction and functional annotations. Nucleic Acids Res., 43, D146–D152. [DOI] [PMC free article] [PubMed] [Google Scholar]
- Yaveroğlu Ö.N. et al. (2014) Revealing the hidden language of complex networks. Sci. Rep., 4, 4547. [DOI] [PMC free article] [PubMed] [Google Scholar]


