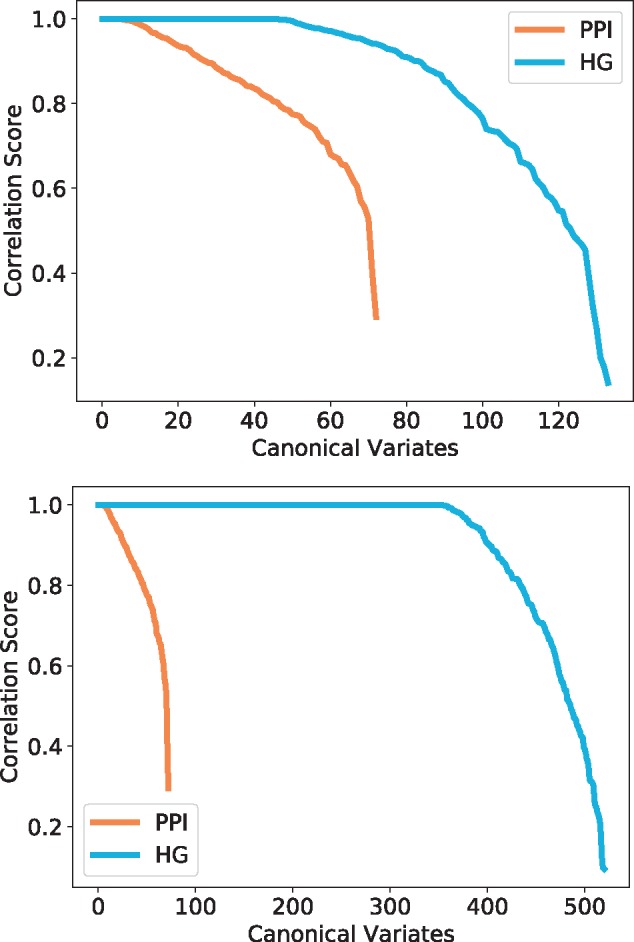
Fig. 6.

Canonical correlation score distribution for yeast–complexes (top) and yeast–pathways (bottom). The canonical variates represented are all statistically significant (P-value ) and are sorted by correlation score. The colours represent the model and the topological signatures from which the canonical variates are obtained: HG in blue and PPI in orange
