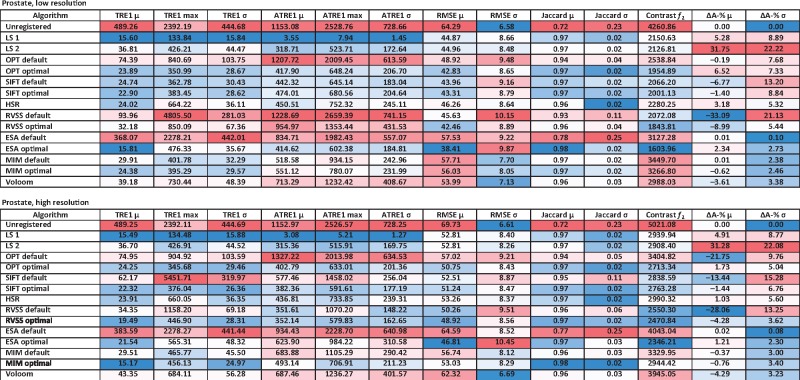
Table 1.
Evaluation results for the prostate data at low (top) and high resolution (bottom)
 |
Note: Results for the unregistered images, LS based on landmarks by observer 1 (LS1) or 2 (LS2) and the automated methods (OPT, SIFT, HSR, RVSS, ESA, MIM, Voloom) using default or optimized parameters. Mean (μ), maximum (max) and standard deviation (σ) over all sections are shown. TRE and ATRE based on landmarks by observer 1 are in μm. In the online version, columns with TRE, ATRE, RMSE, f2 and ΔA-% are colored from low (blue) to high values (red). Columns with Jaccard are colored from high (blue) to low values (red). (Color version of this table is available at Bioinformatics online.)
