Fig. 3.
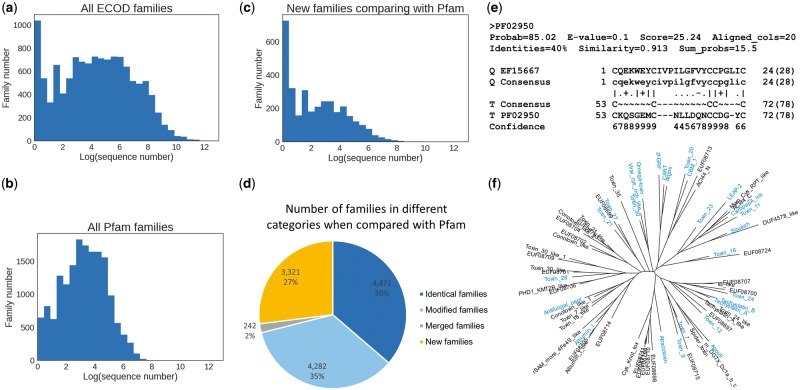
Characterization of small families and new families in ECOD. (a) The logarithmic distribution of the number of sequences in ECOD families, showing a peak at very small size. (b) The logarithmic distribution of the number of sequences in Pfam families for comparison. (c) The size distribution of only those families that cannot find a significant hit (>90% HHSearch probability) to Pfam by HHsearch. (d) The pie graph illustrates the proportion of four kinds of families when compared with Pfam. Identical family hits a Pfam family with comparable length. Modified family has a Pfam counterpart, but lengths differ substantially. Merged family has multiple non-overlapping Pfam hits. New family means no good Pfam hits. (e) An HHsearch alignment of an omega toxin family against Pfam as an example to show the difficulty to detect sequence similarity for small family, especially those domains with few secondary structure elements. Small family has a thin profile and does not exhibit too much conservation pattern. (f) An unrooted tree of all families in ECOD omega toxin-related topology group with identical families to Pfam colored in blue. New families are scattered and distributed with Pfam families, and the distances between families are comparable with distances between Pfam families

