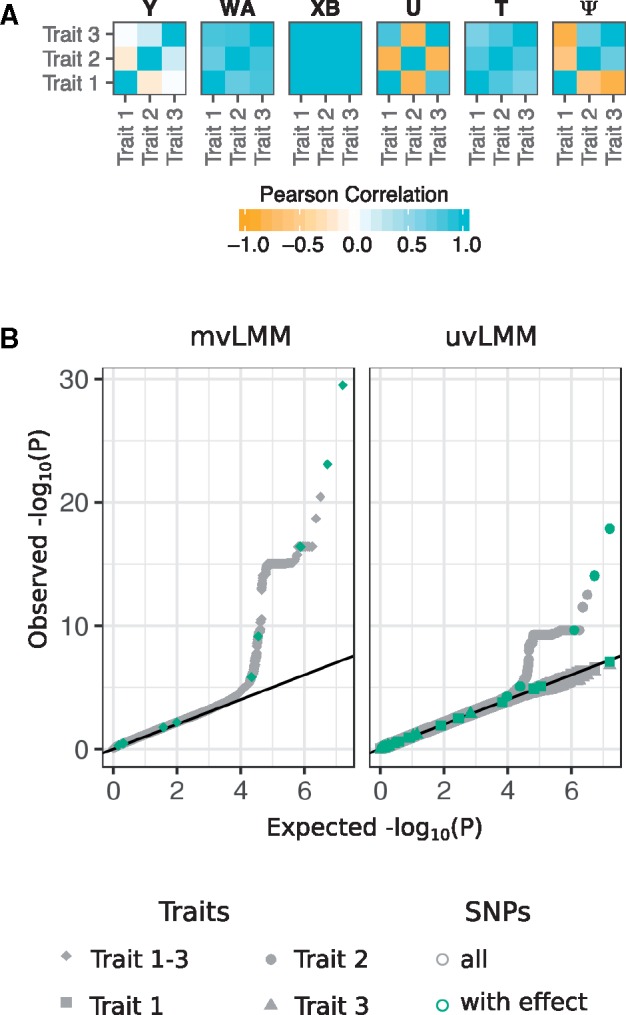
Fig. 2.

Phenotype simulation and genome-wide association study as a downstream application. (A) Heatmaps of the trait-by-trait correlation (Pearson correlation) of a simulated phenotype Y and its five phenotype components: genetic variant effects XB, infinitesimal genetic effects U, non-genetic covariates WA, correlated non-genetic effects T and observational noise . The non-genetic covariates consist of four independent components, two following a binomial and two following a normal distribution. The genetic variant effect of ten causal SNPs with shared effect across all traits, yielding the strong correlation structure observed above (see Section 2). (B) Quantile-quantile plots of P-values observed from a multivariate linear mixed model (mvLMM) and univariate linear mixed models (uvLMM) fitted to each of the about eight million genome-wide SNPs (grey), including the ten SNPs for which a phenotype effect was modelled (green). The R code and detailed description of the simulation and analysis are provided in the Supplementary Material (Simulation-and-LinearModel.pdf)
