

Abstract
Autism spectrum disorders (ASD) are a group of neurodevelopmental conditions primarily characterized by abnormalities in social cognition. Abundant previous functional MRI studies have shown atypical activity in networks encompassing medial prefrontal cortex (mPFC) and medial parietal regions corresponding to posterior cingulate cortex and precuneus (PCC/PCU). Conversely, studies assessing structural brain anomalies in ASD have been rather inconsistent. The current work evaluated whether structural changes in ASD can be reliability detected in a large multicenter dataset. Our comprehensive structural MRI framework encompassed cortical thickness mapping and structural covariance analysis based on three independent samples comprising individuals with ASD and controls (n = 220), selected from the Autism Brain Imaging Data Exchange open‐access database. Surface‐based analysis revealed increased cortical thickness in ASD relative to controls in mPFC and lateral prefrontal cortex. Clusters encompassing mPFC were embedded in altered inter‐regional covariance networks, showing decreased covariance in ASD relative to controls primarily to PCC/PCU and inferior parietal regions. Cortical thickness increases and covariance reductions in ASD were consistent, yet of variable effect size, across the different sites evaluated and measurable both in children and adults. Our multisite study shows regional and network‐level structural alterations in mPFC in ASD that, possibly, relate to atypical socio‐cognitive functions in this condition. Hum Brain Mapp 36:2364–2373, 2015. © 2015 Wiley Periodicals, Inc.
Keywords: ASD, ABIDE, neocortex, connectivity, medial PFC, connectome
INTRODUCTION
Autism spectrum disorders (ASD) are a group of life‐long neurodevelopmental disorders currently recognized in more than 1% of children (Baird, et al., 2006; CDC, 2014). Core to ASD are impairments in socio‐cognitive functioning thought to stem from atypical Theory of Mind (ToM), which is also known as mentalizing (Castelli, et al., 2002; Frith, 2003) as well as sensory abnormalities and restricted, repetitive patterns of behavior, interests, or activities (APA, 2013). Functional MRI studies have shown altered activations in this condition, with somehow diverse location and direction of functional findings. Despite this variability, regions subserving ToM function, such as medial prefrontal cortex (mPFC) and the posterior cingulate cortex and precuneus (PCC/PCU) in the medial parietal lobe, have been relatively consistently implicated in ASD (Di Martino, et al., 2009; Frith, 2003; Kana, et al., 2009; Kennedy and Courchesne, 2008; Lombardo, et al., 2011). In contrast, structural abnormalities of these same areas have been reported less consistently.
Adult studies have provided little consensus regarding the location and direction of regional alterations in ASD. Some have reported primarily grey matter reductions in frontal, parietal, and temporal cortices (Hadjikhani, et al., 2007; Scheel, et al., 2011); others have suggested increased grey matter in frontal and temporal regions (Doyle‐Thomas, et al., 2013; Duerden, et al., 2012; Ecker, et al., 2012). Likewise, while some studies in children with ASD have shown medial and lateral prefrontal cortical thickness increases (Mak‐Fan, et al., 2012; Raznahan, et al., 2010), others reported decreases in lateral orbitofrontal grey matter (Girgis, et al., 2007; Hardan, et al., 2006aa). Divergences across studies may relate to the small sample sizes studied in single labs, due to the high costs and challenges associated to recruitment and MRI acquisition in ASD. Another possible reason for inconsistency is that rather than focal abnormalities, dysconnections among large‐scale network characterize autism (Minshew and Williams, 2007; Schaer, et al., 2013).
Approaches allowing examinations of both local and large‐scale brain abnormalities are likely better suited for autism research. Cortical thickness analyses meet such criterion. They can provide a detailed picture of the topography of structural alterations in ASD as well as information on inter‐regional network formation. Specifically, in recent years, the framework of MRI covariance analysis has been proposed to probe inter‐regional networks that likely reflect the coordination of structural growth during development and maturation (Alexander‐Bloch, et al., 2013aa; Lerch, et al., 2006). While developmental conditions, such as ASD, likely relate to disruptions of morphological coupling across brain regions, only relatively few previous covariance analyses have been conducted in this disorder (Bernhardt, et al., 2014cc; Dziobek, et al., 2010; McAlonan, et al., 2005). Importantly, only small samples have been assessed (ASD/Controls in Bernhardt et al.: 18/18; Dziobek et al.: 27/29; McAlonan et al.: 17/17), limiting generalizability of these results.
In the current work, we took advantage of the open‐access Autism Brain Imaging Data Exchange database (ABIDE) to overcome limitations related to sample size and facilitate the evaluation of across‐site reproducibility (Di Martino, et al., 2014). We carried out a multisite MRI assessment of patterns of regional and inter‐regional structural differences in ASD. Analyses were based on three large and independent ABIDE subsamples, selected as they included both children and adults with autism and typical controls. We mapped differences between ASD and controls in regional cortical thickness as well as inter‐regional structural covariance networks. Given their role in mediating socio‐cognitive functions and previous task‐based as well as task‐free functional findings showing alterations of these regions in ASD (Di Martino, et al., 2009; Di Martino, et al., 2014), we expected to identify alterations in ASD primarily in mPFC and PCC/PCU and their inter‐regional relationships. Nevertheless, given that the extent of the abnormalities beyond circuits involved in social cognition is still unclear, our cortical thickness analyses were carried out in an unconstrained fashion across the entire cortical mantle.
MATERIALS AND METHODS
Subjects
We selected a subsample of the ABIDE database, including children and adults (age range = 6.5–50.2 years). Specifically, we selected only sites that included both children and adults, with at least 10 individual datasets per diagnostic group after quality control (please, see below). Moreover, we selected only males given the low prevalence of data from females that were not present in all sites. This left us with an initial sample of 297 individuals from three sites: (1) NYU Langone Medical Center (NYU, n = 147, 68/79 ASD/controls); (2) University of Utah, School of Medicine (USM, n = 101, 58/43 ASD/controls); (3) University of Pittsburg, School of Medicine (PITT, n = 49, 26/23 ASD/controls).
As detailed at http://fcon_1000.projects.nitrc.org/indi/abide/, individuals with ASD had DSM‐IV‐TR diagnosis of Autistic Disorder, Asperger's Disorder, or Pervasive Developmental Disorder Not‐Otherwise‐Specified, established by expert clinical opinion aided by ‘gold standard’ diagnostic instruments: the Autism Diagnostic Observation Schedule, ADOS (Lord, et al., 2000), and/or the Autism Diagnostic Interview‐Revised, ADI‐R (Lord, et al., 1994). In the NYU, PITT, and USM datasets, individuals diagnosed with associated disorders such as Fragile‐X or tuberous sclerosis were excluded. Intelligence (full scale IQ, performance IQ and verbal IQ) was measured by WASI, WAIS III, and/or WISC III (Wechsler, 1999). Controls were free of history of mental disorders and matched for age at each site.
MRI Acquisition
High‐resolution T1‐weighted images were available from all three sites. NYU data were acquired on a 3T Siemens Magnetom Allegra using a 3D‐TurboFLASH sequence (TR = 2530 ms; TE = 3.25 ms; TI = 1100 ms; flip angle = 7°; 128 sagittal slices; matrix size = 256 × 256; FOV = 256 mm; slice thickness = 1.33 mm, yielding a voxel size of 1.3 × 1.0 × 1.3 mm3). PITT data were acquired on a 3T Siemens Magnetom Allegra using a 3D‐MPRAGE sequence (TR = 2100 ms; TE = 3.93 ms; TI = 1000 ms; flip angle = 7°; 176 sagittal slices; matrix size = 269 × 269; FOV = 269 mm; slice thickness = 1.05 mm, yielding a voxel size of 1.1 × 1.1 × 1.1 mm3). USM data were acquired on a 3T Siemens Magnetom TrioTim using a 3D‐MPRAGE sequence (TR = 2300 ms; TE = 2.91 ms; TI = 900 ms; flip angle = 9°; 160 sagittal slices; matrix size = 240 × 256; FOV = 256 mm; slice thickness = 1.2 mm, yielding a voxel size of 1.0 × 1.0 × 1.2 mm3).
MRI‐Based Cortical Thickness Measurements
FreeSurfer (Version 5.1.0; http://surfer.nmr.mgh.harvard.edu) was used to generate models of the cortical surface and to measure cortical thickness from the T1‐weighted images. Previous work has validated FreeSurfer by comparing it with histological analysis (Rosas, et al., 2002) and manual measurements (Kuperberg, et al., 2003). The processing steps have been described in detail elsewhere (Dale, et al., 1999; Fischl, et al., 1999; Han, et al., 2006). Individual surfaces were aligned to an average spherical representation, fsaverage5, improving correspondence of measurement points with regards to (mostly primary and secondary) sulcation patterns. For whole‐brain analysis, thickness data were smoothed on the tessellated surfaces using a 20 mm full‐with‐at‐half‐maximum Gaussian kernel prior to statistical analysis. Selecting a surface‐based kernel reduces measurement noise but preserves the capacity for anatomical localization, as it respects cortical topological features (Lerch and Evans, 2005).
Quality Control and Final Sample Selection
The ABIDE open‐access dataset includes structural and functional data of a wide range of image quality. Cortex extractions in each subject were visually inspected and segmentation inaccuracies manually corrected by two raters blind to ASD diagnosis (SLV and BCB). ASD versus control status was assigned to the raters in a randomized fashion. Moreover, subjects with faulty segmentations, movement, or other artifacts were excluded from the study (n = 77). This left us with a final sample of 220 individuals (107 ASD, 113 controls).
We automatically measured the signal to noise ratio, based on the QA‐tools associated with FreeSurfer (https://surfer.nmr.mgh.harvard.edu/fswiki/QATools), providing a rater‐independent quantitative index of image quality.
In the final sample, ADOS scores were available for all individuals with ASD (ADOS total: mean ± SD = 12.3 ± 3.7, range = 5–22; ADOS social: 8.4 ± 2.7, 2–14; ADOS communication: 4.3 ± 1.5, 0–8). ASD and control groups had a comparable age (ASD: 20.9 ± 8.0 years, 7.2–50.2 years; Controls: 19.3 ± 7.3 years, 6.5–39.4 years; Difference: t =–1.48; P = 0.14). On the other hand, compared to controls individuals with ASD had lower full‐scale IQ (ASD: 104 ± 16, 65–137; Controls: 114 ± 12, 81–148; Difference: t = 5.11; P < 0.001), performance IQ (ASD: 106 ± 15, 72–133; Controls: 112 ± 13, 67–155; Difference t = 3.09; P < 0.002), and verbal IQ (ASD: 102 ± 17, 55–136; Controls: 113 ± 12, 80–140; Difference t = 5.67; P < 0.001). For a breakdown by site after quality control, please see Table 1 .
Table 1.
Sample breakdown by site. age, ADOS total score, and full‐scale IQ are presented in mean ± SD (range)
| site | age | ados | IQ |
|---|---|---|---|
| usm | |||
| ASD (n = 52) | 23.6 ± 7.6 (15–50) | 13.6 ± 3.3 (6–21) | 100.6 ± 16.5 (65–132) |
| Controls (n = 40) | 21.5 ± 7.8 (9–39) | – | 115.3 ± 13.9 (89–148) |
| pitt | |||
| ASD (n = 20) | 20.8 ± 7.3 (12–35) | 12.7 ± 3.0 (8–19) | 113 ± 14 (81–131) |
| Controls (n = 22) | 19.7 ± 6.9 (9–33) | – | 110 ± 9 (95–127) |
| nyu | |||
| ASD (n = 35) | 16.8 ± 7.5 (7–39) | 11.3 ± 4.2 (5–22) | 105.3 ± 13.8 (76–137) |
| Controls (n = 51) | 17.5 ± 6.7 (7–31) | – | 115.0 ± 12.1 (81–139) |
Statistical Analyses
As in previous structural MRI analyses (Bernhardt, et al., 2014aa; Bernhardt, et al., 2014bb; Bernhardt, et al., 2014cc), we used SurfStat for Matlab [R2010a, The Mathworks, Natick, MA] (Worsley, et al., 2009). Analyses were carried out in an unconstrained fashion, at each neocortical surface point (henceforth, vertex).
-
Mapping of cortical thickness differences. We fitted a linear model at each vertex i that assessed between‐group differences in thickness T between ASD and controls:
Where Ti is the thickness at vertex i, Site is a term controlling for site (i.e., NYU, PITT, USM), Age a term controlling for age, IQ is a term controlling for full‐scale IQ, Group is the group factor (i.e., ASD and controls).
Post hoc analyses were carried out to evaluate the consistency of findings (see Results) within each of the three sites, and within children and adults separately.
In a series of separate post hoc analyses, we repeated the above group comparisons after correcting for global mean thickness, after correcting for signal to noise ratio, and without correction for IQ.
-
Covariance network analysis. We mapped structural covariance networks by seeding from each cluster of significant ASD‐specific findings (from a) to all other cortical vertices.
Seed indicates the mean thickness of a cluster of ASD‐specific findings. This analysis was carried out separately in ASD and in controls. The above covariance analyses were restricted to networks ipsilateral to the respective seed regions. As in previous covariance analyses (Bernhardt, et al., 2011; Chen, et al., 2008; He, et al., 2008), we additionally corrected for global mean thickness, Glob, in the above model.
Using linear interaction models, we assessed whether ASD diagnosis resulted in a modulation of seed covariance relative to controls.Separate post hoc analyses evaluated whether findings were consistent when no correction for IQ and global mean thickness were applied.
-
Assessment of age effects. We assessed the interplay between aging and ASD‐specific structural alterations by measuring interactions between age and diagnostic group on cortical thickness.
Analyses were carried out at each vertex; in a separate analysis, we also assessed age effects on the mean thickness of clusters of ASD‐specific cortical thickness changes (from a).
We assessed interactions between age and ASD diagnosis on structural covariance networks. To this end, we assessed the triple interactionThis contrast was evaluated based on a model that also contained each of these terms as simple effect and their simple interactions, together with the Site, IQ, and Glob control terms. As in b), seeds were based on clusters of significant ASD‐specific findings.
Correction for multiple comparisons. Surface‐based findings were corrected using random field theory for nonisotropic images (Worsley, et al., 1999). Specifically, we applied the SurfStat function SurfStatP.m, which controlled the chance of reporting a family‐wise error (FWE) in a given statistical analysis to P FWE < 0.05.
RESULTS
Cortical Thickness Increases in ASD Relative to Controls
Surface‐based comparisons of cortical thickness between ASD and controls revealed increased thickness in the former group in bilateral clusters extending from mPFC (ventromedial and dorsomedial PFC) to lateral PFC (P FWE < 0.05; Cohens d for thickness increase left PFC = 0.44; right PFC = 0.53). Increases in mPFC thickness were relatively consistent across both hemispheres; conversely, lateral PFC thickness increases were more extensive in the right hemisphere, where thickening was seen in orbitofrontal, ventrolateral and dorsolateral regions; lateral PFC thickening in the left hemisphere was mostly restricted to dorsolateral PFC. There were no findings of decreased thickness in ASD relative to typically developing controls (Fig. 1).
Figure 1.
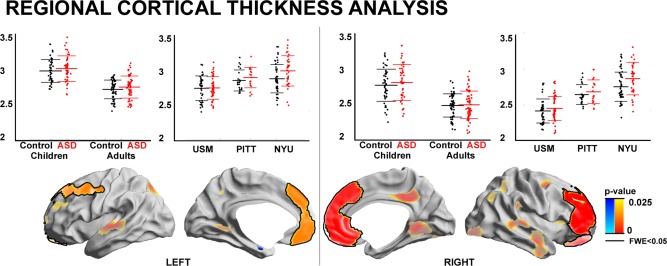
Regional cortical thickness analysis. ASD‐specific cortical thickness increases relative to controls across three sites (in a model that controlled for age, IQ, and site) are shown in red/decreases in blue. Significant regions after multiple comparisons correction at a cluster‐level of FWE < 0.05 (thresholded using random field theory for nonisotropic images) are surrounded by solid black outlines. To illustrate trends, findings at P < 0.025, uncorrected (no black outlines, semitransparent) are also shown. Inset scatter plots show mean effects for each significant cluster, either within each site (i.e., USM/PITT/NYU) or within children and adults separately.
We ran a post hoc analysis on mean thickness in clusters of ASD‐related thickening to assess the consistency of our effect across sites. This analysis indicated that bilateral medial and lateral prefrontal cortical thickness increases in ASD were consistent across the three sites, albeit with variable effect size (Cohen's d in NYU/ PITT/ USM; left PFC = 0.60/0.44/0.25; right PFC = 0.63/0.40/0.43). Restricting the sample to either children or adults revealed consistent prefrontal thickening in ASD in both age groups (Cohen's d in Children/Adults; left PFC = 0.5/0.42; right PFC = 0.69/0.44).
Running between‐group comparisons while additionally controlling for global mean thickness yielded virtually identical patterns of results (post hoc t‐value left/right PFC = 3.11/4.13). Likewise, running a model that did not correct for IQ also revealed bilateral PFC thickening (post hoc t‐value left/right PFC = 3.60/4.07). Global mean thickness did not differ between groups (ASD/Controls = 2.66 ± 0.15/2.65 ± 0.14; P > 0.1 in model correcting for site, age, and IQ).
ANOVA on signal to noise ratio did not indicate any interaction between site and group (F = 0.17, P < 0.84) or a main effect of group (F = 2.48, P > 0.1); however, there was a significant effect of site (F < 19.3, P < 0.001). Running between group‐comparisons after controlling for signal‐to‐noise confirmed the robustness of ASD‐specific thickness increases in PFC (post hoc t‐value left/right PFC = 3.36/3.93).
Abnormal Inter‐Regional Structural Covariance in ASD
We complemented the regional cortical thickness mapping with an assessment of inter‐regional structural covariance networks (Fig. 2). Networks were centered on the left and right PFC clusters that showed ASD‐specific cortical thickness increases in our prior analyses (see Fig. 1).
Figure 2.
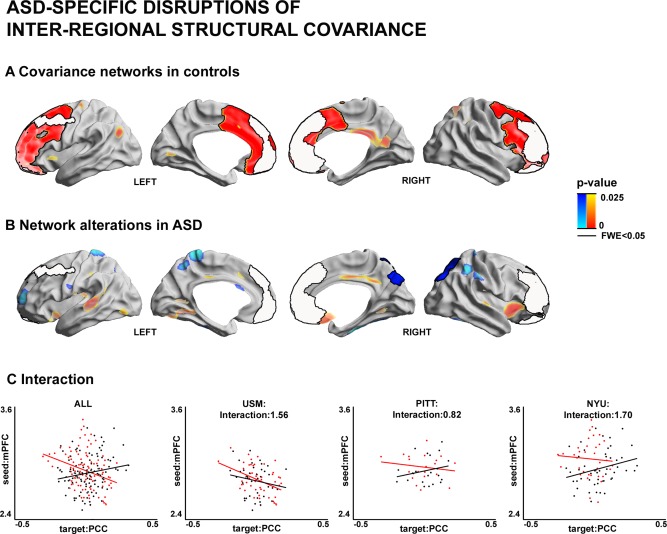
Inter‐regional structural covariance network analysis. Seed regions were determined as clusters of cortical thickness increases in ASD (see Fig. 1). (A) Covariance networks in controls. Significant correlations between cortical thickness in the seed and a cortical target region across the sample were interpreted as structural networks. (B) Alterations in structural covariance networks between ASD and controls. Blue/Red areas indicate reductions/increases in seed covariance in ASD relative to controls. (C) Scatter plots illustrating the interaction showing in (B), between mean thickness of right PFC seed and mean thickness of right PCC/PCU target region, once for the overall sample and once within each site (i.e., USM/PITT/NYU). Please, see Figure 1 for details on the statistical thresholding.
In controls, the left PFC seed showed high covariance to extended cluster encompassing medial prefrontal, lateral prefrontal, and anterior midcingulate regions as well as trends to a cluster in TPJ. Similarly, the right PFC seed showed covariance increases to medial and lateral prefrontal extending to superior regions as well as trends to PCC/PCU. Group comparisons for covariance did not reveal any differences in the left PFC. However; covariance of the right PFC cluster was markedly reduced in ASD relative to controls, with target regions in right parietal regions encompassing PCC/PCU (P FWE < 0.05).
Post hoc analysis, which assessed correlations between mean thickness of the seed in right PFC and the target region in right PCC/PCU, indicated that covariance reductions had a similar direction across all three sites, but again with variable effect (t‐value of Group × Seed interactions in NYU/PITT/USM=1.7/0.8/1.6). Moreover, similar to our findings in the regional analysis, running covariance without the control for global mean thickness yielded similar results (post hoc t‐value = 2.4), as did a covariance analysis between the seed and target when no IQ was corrected (post hoc t‐value = 3.8), and when rerunning the covariance analysis while additionally controlling for signal‐to‐noise confounds (post hoc t‐value = 3.7).
Network Modulations by Age
Both controls and ASD groups showed marked age‐related thinning across multiple cortical regions, surface‐based interaction analysis failed to show any significant between‐group differences in age‐dependent structural change following correction for multiple comparisons. At uncorrected thresholds (P < 0.025), trends for more marked age‐related thinning in ASD were observed in scattered clusters in left temporal, right prefrontal and midline parietal regions, whereas more protracted age‐related thinning in ASD was seen in insular regions. Similarly, we did not find any significant between‐group differences in the modulation of inter‐regional covariance by age (Supplementary Figure).
DISCUSSION
We performed a comprehensive examination of cortical thickness and its inter‐regional covariance to study structural network alterations based on the three independent ABIDE subsamples that included both children and adults. In our study, cortical thickness analyses were carried out in a surface‐based and unconstrained fashion. Yet, in the light of several previous behavioral and functional studies suggesting an association between ASD and impairments in socio‐cognitive functioning, particularly atypical ToM (Castelli, et al., 2002; Hill and Frith, 2003), we expected to reveal structural network abnormalities primarily in regions and inter‐regional networks associated with such functional processes, such as mPFC and PCC/PCU (Di Martino, et al., 2009; Di Martino, et al., 2014). We indeed observed cortical thickness increases in individuals with ASD in large portions of bilateral mPFC, extending to lateral PFC in both hemispheres. While of variable effect size, the direction of changes in PFC regions was consistent across all three sites and age groups alike. Complementary covariance analysis revealed that mPFC regions of thickness increases also showed abnormal structural network integration with parietal regions encompassing PCC/PCU. Our findings, therefore, provide multisite evidence for structural regional and connectivity disruptions particularly in areas known to subserve socio‐cognitive functioning, such as mPFC and medial parietal cortices.
Previous neuroimaging studies have reported mixed findings in children and adults with autism. In children, brain overgrowth has been reported in frontal and temporal cortices (Courchesne, et al., 2001; Girgis, et al., 2007; Hardan, et al., 2006bb), while other studies did not observe any apparent change (Amaral, et al., 2008; Bloss and Courchesne, 2007; Redcay and Courchesne, 2005). MRI studies in adults have also reported rather divergent findings (Doyle‐Thomas, et al., 2013; Ecker, et al., 2012; Hadjikhani, et al., 2007; Scheel, et al., 2011). While recent findings across several mouse models of autism have also pointed towards a high variability in structural phenotypes (Ellegood, et al., 2014), diverse findings in human studies could be driven variable inclusion criteria. In the current study, only individuals with ASD supported by ADOS and/or ADI‐R were included. Opting for homogeneous subject inclusion criteria may be an important factor, given the somewhat inconsistent nature of previous functional as well as structural findings in this condition. Our series of post hoc thickness comparisons between groups revealed a consistent direction of change between ASD and controls; yet, thickness increases were of variable effect size across the different centers studied. Such variability, which could be due to other variations in cohorts, scanners, and scanning protocols, together with possible limitations in sample size may have, in part, contributed to the diverse pattern seen across previous reports. While the present work also drew attention to significant difference in the signal‐to‐noise ratio across sites, no clear relationship was found between the ability to detect diagnostic group differences and variations in signal‐to‐noise ratio. It is important to note that it is difficult to pinpoint the exact effect of signal‐to‐noise on results, due to various causes of differences in signal‐to‐noise such as movement, scanner parameters, and physiological effects.
A recent study (Haar, et al., 2014) on the ABIDE dataset reported rather subtle differences in cortical structure between ASD and controls. At low thresholds, the study of Haar and colleagues also revealed tendencies for rather increases in cortical thickness in ASD–a finding in accordance to the work presented here. The higher effect sizes reported in the current work could be attributed to differences in center‐ and case‐inclusion. Indeed, the current study included those three sites that provided data from adults as well as children, while the study of Haar and colleagues included data from more centers, and preselected cases based on explicit matching criteria. Furthermore divergences may be attributed to whether manual FreeSurfer correction procedures were applied, as in the current work, or not (Haar, et al., 2014).
Direct histopathological validation studies of MRI‐derived morphological changes in autism are virtually absent. Notably, a previous post mortem study of Casanova and colleagues suggested a smaller width but increased number of minicolumns, neuronal assemblies centered on radially oriented pyramidal neurons, in this condition (Casanova, et al., 2002). Further pathological studies of individuals with autism have reported glial abnormalities in the frontal lobe (Morgan, et al., 2010; Vargas, et al., 2005), with one study showing increased microglial density in white and grey matter (Morgan, et al., 2010). Last, histopathological analyses have reported laminar rearrangement and a poorly defined grey and white matter interface (Avino and Hutsler, 2010; Mukaetova‐Ladinska, et al., 2004), a common sign of atypical migration and cortical organization during neurodevelopment, starting possibly already at prenatal developmental stages (Stoner, et al., 2014).
Univariate cortical thickness mapping was complemented by MRI covariance analysis to probe inter‐regional structural MRI networks (Alexander‐Bloch, et al., 2013bb; He, et al., 2008; Lerch, et al., 2006). According to its underlying assumptions, cortical regions belonging to the same network would show highly correlated growth during development, due to their high propensity to exchange trophic factors and participate in common molecular signaling pathways (Alexander‐Bloch, et al., 2013bb). In our sample, we observed decreased covariance of mPFC in ASD relative to controls, particularly to parietal regions, including PCU/PCC. Similar to the regional thickness findings, the direction of effects remained consistent across sites, but of variable effect size. Functional MRI connectivity analysis have consistently reported ASD‐related abnormalities in the inter‐regional coupling of different divisions in the frontal neocortex (Di Martino, et al., 2014; Just, et al., 2012; Lynch, et al., 2013; Monk, et al., 2009; Redcay, et al., 2013). A previous meta‐analysis of 14 diffusion MRI studies has furthermore suggested long‐range white matter diffusion abnormalities in individuals with autism, especially in superior longitudinal and uncinate fasciculi as well as the corpus callosum, suggesting alterations in long‐distance frontal structural connectivity in this condition (Aoki, et al., 2013). Post mortem studies have supported these findings, showing possible histological underpinnings of atypical connectivity in ASD (Hutsler and Zhang, 2010; Raymond, et al., 1996; Zikopoulos and Barbas, 2010; Zikopoulos and Barbas, 2013). In a recent study, Zikopoulos and Barbas could show fewer large myelinated axons in the deep white matter, which mediate long‐range connectivity, in ASD than in controls below regions corresponding to the anterior cingulate cortex and mPFC. On the other hand, the authors reported a concomitant increase in thin myelinated axons in the superficial white matter below the same regions, indicative of excess axonal branching and local hyper‐connectivity (Zikopoulos and Barbas, 2010).
Previous research has reported abnormal trajectories of cortical structural development in ASD (Raznahan, et al., 2010; Scheel, et al., 2011; Schumann, et al., 2010; Wallace, et al., 2010). In this work, on the other hand, only trends for an age‐dependent modulation of cortical thickness changes were observed. In addition to differences in sample characteristics between our work and previous studies (with differences in the mean age and/or age range), a reduced sensitivity in the current work may have resulted from the absence of an age‐stratified sampling scheme when pooling data across centers.
By studying the publically accessible ABIDE dataset, we had the opportunity to investigate structural brain abnormalities in a large, multisite sample of individuals with ASD. Although no direct behavioral markers of social cognition were available in this open access repository, the co‐occurrence of thickness increases and covariance disruptions in mPFC is remarkable, given the key role of this region in socio‐cognitive functions related to ToM (Frith and Frith, 2006; Kana, et al., 2009). Ultimately, our structural MRI findings appear to support theories that hypothesize structural and connectional anomalies in prefrontal and/or parietal midline regions in ASD that may, likely, relate to atypical social cognition in this condition.
Supporting information
Supplementary Information
ACKNOWLEDGMENT
The authors would like to thank the numerous contributors at each site (http://fcon_1000.projects.nitrc.org/indi/abide), the NITRC (http://www.nitrc.org) for providing the data sharing platform for the ABIDE initiative as well as the other informatics databases for providing additional platforms.
REFERENCES
- Alexander‐Bloch A, Giedd JN, Bullmore E (2013a): Imaging structural co‐variance between human brain regions. Nat Rev Neurosci 14:322–336. [DOI] [PMC free article] [PubMed] [Google Scholar]
- Alexander‐Bloch A, Raznahan A, Bullmore E, Giedd J (2013b): The convergence of maturational change and structural covariance in human cortical networks. J Neurosci 33:2889–2899. [DOI] [PMC free article] [PubMed] [Google Scholar]
- Amaral DG, Schumann CM, Nordahl CW (2008): Neuroanatomy of autism. Trends Neurosci 31:137–145. [DOI] [PubMed] [Google Scholar]
- Aoki Y, Abe O, Nippashi Y, Yamasue, H (2013): Comparison of white matter integrity between autism spectrum disorder subjects and typically developing individuals: A meta‐analysis of diffusion tensor imaging tractography studies. Mol Autism 4:25. [DOI] [PMC free article] [PubMed] [Google Scholar]
- APA 2013: Diagnostic and Statistical Manual of Mental Disorders. Arlington, VA: American Psychiatric Association. [Google Scholar]
- Avino TA, Hutsler JJ (2010): Abnormal cell patterning at the cortical gray‐white matter boundary in autism spectrum disorders. Brain Res 1360:138–146. [DOI] [PubMed] [Google Scholar]
- Baird G, Simonoff E, Pickles A, Chandler S, Loucas T, Meldrum D, Charman T (2006): Prevalence of disorders of the autism spectrum in a population cohort of children in South Thames: The Special Needs and Autism Project (SNAP). Lancet 368:210–215. [DOI] [PubMed] [Google Scholar]
- Bernhardt BC, Chen Z, He Y, Evans AC, Bernasconi N (2011): Graph‐theoretical analysis reveals disrupted small‐world organization of cortical thickness correlation networks in temporal lobe epilepsy. Cereb Cortex 21:2147–2157. [DOI] [PubMed] [Google Scholar]
- Bernhardt BC, Hong SJ, Bernasconi A, Bernasconi N (2014a): Magnetic resonance imaging pattern learning in temporal lobe epilepsy: Classification and prognostics. Ann Neurol. doi: 10.1002/ana.24341. [DOI] [PubMed] [Google Scholar]
- Bernhardt BC, Klimecki OM, Leiberg S, Singer T (2014b): Structural covariance networks of the dorsal anterior insula predict females' individual differences in empathic responding. Cereb Cortex 24:2189–2198. [DOI] [PubMed] [Google Scholar]
- Bernhardt BC, Valk S, Silani G, Bird G, Frith U, Singer T (2014c): Selective disruption of socio‐cognitive structural brain networks in autism and alexithymia. Cereb Cortex 24:3258–3267. [DOI] [PubMed] [Google Scholar]
- Bloss CS, Courchesne E (2007): MRI neuroanatomy in young girls with autism: A preliminary study. J Am Acad Child Adolesc Psychiatry 46:515–523. [DOI] [PubMed] [Google Scholar]
- Casanova MF, Buxhoeveden DP, Switala AE, Roy E (2002): Minicolumnar pathology in autism. Neurology 58:428–432. [DOI] [PubMed] [Google Scholar]
- Castelli F, Frith C, Happe F, Frith U (2002): Autism, Asperger syndrome and brain mechanisms for the attribution of mental states to animated shapes. Brain 125:1839–1849. [DOI] [PubMed] [Google Scholar]
- CDC (2014): Prevalence of autism spectrum disorder among children aged 8 years–autism and developmental disabilities monitoring network, 11 sites, United States, 2010. Morbidity and mortality weekly report. Surveill Summ 63:1–21. [PubMed] [Google Scholar]
- Chen ZJ, He Y, Rosa‐Neto P, Germann J, Evans AC (2008): Revealing modular architecture of human brain structural networks by using cortical thickness from MRI. Cereb Cortex 18:2374–2381. [DOI] [PMC free article] [PubMed] [Google Scholar]
- Courchesne E, Karns CM, Davis HR, Ziccardi R, Carper RA, Tigue ZD, Chisum HJ, Moses P, Pierce K, Lord C, Lincoln AJ, Pizzo S, Schreibman L, Haas RH, Akshoomoff NA, Courchesne RY (2001): Unusual brain growth patterns in early life in patients with autistic disorder: An MRI study. Neurology 57:245–254. [DOI] [PubMed] [Google Scholar]
- Dale AM, Fischl B, Sereno MI (1999): Cortical surface‐based analysis. I. Segmentation and surface reconstruction. Neuroimage 9:179–194. [DOI] [PubMed] [Google Scholar]
- Di Martino A, Ross K, Uddin LQ, Sklar AB, Castellanos FX, Milham MP (2009): Functional brain correlates of social and nonsocial processes in autism spectrum disorders: An activation likelihood estimation meta‐analysis. Biol Psychiatry 65:63–74. [DOI] [PMC free article] [PubMed] [Google Scholar]
- Di Martino A, Yan CG, Li Q, Denio E, Castellanos FX, Alaerts K, Anderson JS, Assaf M, Bookheimer SY, Dapretto M, Deen B, Delmonte S, Dinstein I, Ertl‐Wagner B, Fair DA, Gallagher L, Kennedy DP, Keown CL, Keysers C, Lainhart JE, Lord C, Luna B, Menon V, Minshew NJ, Monk CS, Mueller S, Muller RA, Nebel MB, Nigg JT, O'Hearn K, Pelphrey KA, Peltier SJ, Rudie JD, Sunaert S, Thioux M, Tyszka JM, Uddin LQ, Verhoeven JS, Wenderoth N, Wiggins JL, Mostofsky SH, Milham MP (2014): The autism brain imaging data exchange: Towards a large‐scale evaluation of the intrinsic brain architecture in autism. Mol Psychiatry 19:659–667. [DOI] [PMC free article] [PubMed] [Google Scholar]
- Doyle‐Thomas KA, Duerden EG, Taylor MJ, Lerch JP, Soorya LV, Wang AT, Fan J, Hollander E, Anagnostou E (2013): Effects of age and symptomatology on cortical thickness in autism spectrum disorders. Res Autism Spectr Disord 7:141–150. [DOI] [PMC free article] [PubMed] [Google Scholar]
- Duerden EG, Mak‐Fan KM, Taylor MJ, Roberts SW (2012): Regional differences in grey and white matter in children and adults with autism spectrum disorders: An activation likelihood estimate (ALE) meta‐analysis. Autism Res 5:49–66. [DOI] [PubMed] [Google Scholar]
- Dziobek I, Bahnemann M, Convit A, Heekeren HR (2010): The role of the fusiform‐amygdala system in the pathophysiology of autism. Arch Gen Psychiatry 67:397–405. [DOI] [PubMed] [Google Scholar]
- Ecker C, Suckling J, Deoni SC, Lombardo MV, Bullmore ET, Baron‐Cohen S, Catani M, Jezzard P, Barnes A, Bailey AJ, Williams SC, Murphy DG (2012): Brain anatomy and its relationship to behavior in adults with autism spectrum disorder: A multicenter magnetic resonance imaging study. Arch Gen Psychiatry 69:195–209. [DOI] [PubMed] [Google Scholar]
- Ellegood J, Anagnostou E, Babineau BA, Crawley JN, Lin L, Genestine M, DiCicco‐Bloom E, Lai JK, Foster JA, Penagarikano O, Geschwind DH, Pacey LK, Hampson DR, Laliberte CL, Mills AA, Tam E, Osborne LR, Kouser M, Espinosa‐Becerra F, Xuan Z, Powell CM, Raznahan A, Robins DM, Nakai N, Nakatani J, Takumi T, van Eede MC, Kerr TM, Muller C, Blakely RD, Veenstra‐VanderWeele J, Henkelman RM, Lerch JP (2014): Clustering autism: Using neuroanatomical differences in 26 mouse models to gain insight into the heterogeneity. Mol Psychiatry 20:118–125. [DOI] [PMC free article] [PubMed] [Google Scholar]
- Fischl B, Sereno MI, Dale AM (1999): Cortical surface‐based analysis. II: Inflation, flattening, and a surface‐based coordinate system. Neuroimage 9:195–207. [DOI] [PubMed] [Google Scholar]
- Frith C (2003): What do imaging studies tell us about the neural basis of autism? Novartis Found symp 251:149–166; discussion 166–176, 281–297. [PubMed] [Google Scholar]
- Frith CD, Frith U (2006): The neural basis of mentalizing. Neuron 50:531–534. [DOI] [PubMed] [Google Scholar]
- Girgis RR, Minshew NJ, Melhem NM, Nutche JJ, Keshavan MS, Hardan AY (2007): Volumetric alterations of the orbitofrontal cortex in autism. Progress in Neuropsychopharmacol Biol Psychiatry 31:41–45. [DOI] [PMC free article] [PubMed] [Google Scholar]
- Haar S, Berman S, Behrmann M, Dinstein I (2014): Anatomical abnormalities in autism? Cereb Cortex. doi: 10.1093/cercor/bhu242. [DOI] [PubMed] [Google Scholar]
- Hadjikhani N, Joseph RM, Snyder J, Tager‐Flusberg H (2007): Abnormal activation of the social brain during face perception in autism. Hum Brain Mapp 28:441–449. [DOI] [PMC free article] [PubMed] [Google Scholar]
- Han X, Jovicich J, Salat D, van der Kouwe A, Quinn B, Czanner S, Busa E, Pacheco J, Albert M, Killiany R (2006): Reliability of MRI‐derived measurements of human cerebral cortical thickness: The effects of field strength, scanner upgrade and manufacturer. NeuroImage 32:180–194. [DOI] [PubMed] [Google Scholar]
- Hardan AY, Girgis RR, Lacerda AL, Yorbik O, Kilpatrick M, Keshavan MS, Minshew NJ (2006a): Magnetic resonance imaging study of the orbitofrontal cortex in autism. J Child Neurol 21:866–871. [DOI] [PubMed] [Google Scholar]
- Hardan AY, Muddasani S, Vemulapalli M, Keshavan MS, Minshew NJ (2006b): An MRI study of increased cortical thickness in autism. Am J Psychiatry 163:1290–1292. [DOI] [PMC free article] [PubMed] [Google Scholar]
- He Y, Chen Z, Evans A (2008): Structural insights into aberrant topological patterns of large‐scale cortical networks in Alzheimer's disease. J Neurosci 28:4756–4766. [DOI] [PMC free article] [PubMed] [Google Scholar]
- Hill EL, Frith U (2003): Understanding autism: Insights from mind and brain. Philos Trans R Soc Lond Ser B Biol Sci 358:281–289. [DOI] [PMC free article] [PubMed] [Google Scholar]
- Hutsler JJ, Zhang H (2010): Increased dendritic spine densities on cortical projection neurons in autism spectrum disorders. Brain Res 1309:83–94. [DOI] [PubMed] [Google Scholar]
- Just MA, Keller TA, Malave VL, Kana RK, Varma S (2012): Autism as a neural systems disorder: A theory of frontal‐posterior underconnectivity. Neurosci Biobehav Rev 36:1292–1313. [DOI] [PMC free article] [PubMed] [Google Scholar]
- Kana RK, Keller TA, Cherkassky VL, Minshew NJ, Just MA (2009): Atypical frontal‐posterior synchronization of Theory of Mind regions in autism during mental state attribution. Soc Neurosci 4:135–152. [DOI] [PMC free article] [PubMed] [Google Scholar]
- Kennedy DP, Courchesne E (2008): Functional abnormalities of the default network during self‐ and other‐reflection in autism. Soc Cogn Affect Neurosci 3:177–190. [DOI] [PMC free article] [PubMed] [Google Scholar]
- Kuperberg GR, Broome MR, McGuire PK, David AS, Eddy M, Ozawa F, Goff D, West WC, Williams SC, van der Kouwe AJ, Salat DH, Dale AM, Fischl B (2003): Regionally localized thinning of the cerebral cortex in schizophrenia. Arch Gen Psychiatry 60:878–888. [DOI] [PubMed] [Google Scholar]
- Lerch JP, Evans AC (2005): Cortical thickness analysis examined through power analysis and a population simulation. Neuroimage 24:163–173. [DOI] [PubMed] [Google Scholar]
- Lerch JP, Worsley K, Shaw WP, Greenstein DK, Lenroot RK, Giedd J, Evans AC (2006): Mapping anatomical correlations across cerebral cortex (MACACC) using cortical thickness from MRI. Neuroimage 31:993–1003. [DOI] [PubMed] [Google Scholar]
- Lombardo MV, Chakrabarti B, Bullmore ET, Baron‐Cohen S (2011): Specialization of right temporo‐parietal junction for mentalizing and its relation to social impairments in autism. Neuroimage 56:1832–1838. [DOI] [PubMed] [Google Scholar]
- Lord C, Rutter M, Le Couteur A (1994): Autism diagnostic interview‐revised: A revised version of a diagnostic interview for caregivers of individuals with possible pervasive developmental disorders. J Autism Dev Disord 24:659–685. [DOI] [PubMed] [Google Scholar]
- Lord C, Risi S, Lambrecht L, Cook EH Jr, Leventhal BL, DiLavore PC, Pickles A, Rutter M (2000): The autism diagnostic observation schedule‐generic: A standard measure of social and communication deficits associated with the spectrum of autism. J Autism Dev Disord 30:205–223. [PubMed] [Google Scholar]
- Lynch CJ, Uddin LQ, Supekar K, Khouzam A, Phillips J, Menon V (2013): Default mode network in childhood autism: Posteromedial cortex heterogeneity and relationship with social deficits. Biol Psychiatry 74:212–219. [DOI] [PMC free article] [PubMed] [Google Scholar]
- Mak‐Fan KM, Taylor MJ, Roberts W, Lerch JP (2012): Measures of cortical grey matter structure and development in children with autism spectrum disorder. J Autism Dev Disord 42:419–427. [DOI] [PubMed] [Google Scholar]
- McAlonan GM, Cheung V, Cheung C, Suckling J, Lam GY, Tai KS, Yip L, Murphy DG, Chua SE (2005): Mapping the brain in autism. A voxel‐based MRI study of volumetric differences and intercorrelations in autism. Brain 128:268–276. [DOI] [PubMed] [Google Scholar]
- Minshew NJ, Williams DL (2007): The new neurobiology of autism: Cortex, connectivity, and neuronal organization. Arch Neurol 64:945–950. [DOI] [PMC free article] [PubMed] [Google Scholar]
- Monk CS, Peltier SJ, Wiggins JL, Weng SJ, Carrasco M, Risi S, Lord C (2009): Abnormalities of intrinsic functional connectivity in autism spectrum disorders. Neuroimage 47:764–772. [DOI] [PMC free article] [PubMed] [Google Scholar]
- Morgan JT, Chana G, Pardo CA, Achim C, Semendeferi K, Buckwalter J, Courchesne E, Everall IP (2010): Microglial activation and increased microglial density observed in the dorsolateral prefrontal cortex in autism. Biol Psychiatry 68:368–376. [DOI] [PubMed] [Google Scholar]
- Mukaetova‐Ladinska EB, Arnold H, Jaros E, Perry R, Perry E (2004): Depletion of MAP2 expression and laminar cytoarchitectonic changes in dorsolateral prefrontal cortex in adult autistic individuals. Neuropathol Appl Neurobiol 30:615–623. [DOI] [PubMed] [Google Scholar]
- Raymond GV, Bauman ML, Kemper TL (1996): Hippocampus in autism: A Golgi analysis. Acta Neuropathol 91:117–119. [DOI] [PubMed] [Google Scholar]
- Raznahan A, Toro R, Daly E, Robertson D, Murphy C, Deeley Q, Bolton PF, Paus T, Murphy DG (2010): Cortical anatomy in autism spectrum disorder: An in vivo MRI study on the effect of age. Cereb Cortex 20:1332–1340. [DOI] [PubMed] [Google Scholar]
- Redcay E, Courchesne E (2005): When is the brain enlarged in autism? A meta‐analysis of all brain size reports. Biol Psychiatry 58:1–9. [DOI] [PubMed] [Google Scholar]
- Redcay E, Moran JM, Mavros PL, Tager‐Flusberg H, Gabrieli JD, Whitfield‐Gabrieli S (2013): Intrinsic functional network organization in high‐functioning adolescents with autism spectrum disorder. Front Hum Neurosci 7:573. [DOI] [PMC free article] [PubMed] [Google Scholar]
- Rosas HD, Liu AK, Hersch S, Glessner M, Ferrante RJ, Salat DH, van der Kouwe A, Jenkins BG, Dale AM, Fischl B (2002): Regional and progressive thinning of the cortical ribbon in Huntington's disease. Neurology 58:695–701. [DOI] [PubMed] [Google Scholar]
- Schaer M, Ottet MC, Scariati E, Dukes D, Franchini M, Eliez S, Glaser B (2013): Decreased frontal gyrification correlates with altered connectivity in children with autism. Front Hum Neurosci 7:750. [DOI] [PMC free article] [PubMed] [Google Scholar]
- Scheel C, Rotarska‐Jagiela A, Schilbach L, Lehnhardt FG, Krug B, Vogeley K, Tepest R (2011): Imaging derived cortical thickness reduction in high‐functioning autism: Key regions and temporal slope. Neuroimage 58:391–400. [DOI] [PubMed] [Google Scholar]
- Schumann CM, Bloss CS, Barnes CC, Wideman GM, Carper RA, Akshoomoff N, Pierce K, Hagler D, Schork N, Lord C, Courchesne E (2010): Longitudinal magnetic resonance imaging study of cortical development through early childhood in autism. J Neurosci 30:4419–4427. [DOI] [PMC free article] [PubMed] [Google Scholar]
- Stoner R, Chow ML, Boyle MP, Sunkin SM, Mouton PR, Roy S, Wynshaw‐Boris A, Colamarino SA, Lein ES, Courchesne E (2014): Patches of disorganization in the neocortex of children with autism. N Engl J Med 370:1209–1219. [DOI] [PMC free article] [PubMed] [Google Scholar]
- Vargas DL, Nascimbene C, Krishnan C, Zimmerman AW, Pardo CA (2005): Neuroglial activation and neuroinflammation in the brain of patients with autism. Ann Neurol 57:67–81. [DOI] [PubMed] [Google Scholar]
- Wallace GL, Dankner N, Kenworthy L, Giedd JN, Martin A (2010): Age‐related temporal and parietal cortical thinning in autism spectrum disorders. Brain 133:3745–3754. [DOI] [PMC free article] [PubMed] [Google Scholar]
- Wechsler D 1999: Wechsler Abbreviated Scale of Intelligence. The Psychological Corporation: Harcourt Brace & Company. New York, NY.
- Worsley K, Andermann M, Koulis T, MacDonald D, Evans A (1999): Detecting changes in nonisotropic images. Hum Brain Mapp 8:98–101. [DOI] [PMC free article] [PubMed] [Google Scholar]
- Worsley K, Taylor JE, Carbonell F, Chung MK, Duerden E, Bernhardt BC, Lyttelton OC, Boucher M, Evans AC (2009): SurfStat: A Matlab toolbox for the statistical analysis of univariate and multivariate surface and volumetric data using linear mixed effects models and random field theory. Neuroimage 47:S102. [Google Scholar]
- Zikopoulos B, Barbas H (2010): Changes in prefrontal axons may disrupt the network in autism. J Neurosci 30:14595–14609. [DOI] [PMC free article] [PubMed] [Google Scholar]
- Zikopoulos B, Barbas H (2013): Altered neural connectivity in excitatory and inhibitory cortical circuits in autism. Front Hum Neurosci 7:609. [DOI] [PMC free article] [PubMed] [Google Scholar]
Associated Data
This section collects any data citations, data availability statements, or supplementary materials included in this article.
Supplementary Materials
Supplementary Information