Supplemental Digital Content is available in the text.
Keywords: Cochlear implants, Current focusing, Electrode configuration, Speech perception
Abstract
Objectives:
The standard, monopolar (MP) electrode configuration used in commercially available cochlear implants (CI) creates a broad electrical field, which can lead to unwanted channel interactions. Use of more focused configurations, such as tripolar and phased array, has led to mixed results for improving speech understanding. The purpose of the present study was to assess the efficacy of a physiologically inspired configuration called dynamic focusing, using focused tripolar stimulation at low levels and less focused stimulation at high levels. Dynamic focusing may better mimic cochlear excitation patterns in normal acoustic hearing, while reducing the current levels necessary to achieve sufficient loudness at high levels.
Design:
Twenty postlingually deafened adult CI users participated in the study. Speech perception was assessed in quiet and in a four-talker babble background noise. Speech stimuli were closed-set spondees in noise, and medial vowels at 50 and 60 dB SPL in quiet and in noise. The signal to noise ratio was adjusted individually such that performance was between 40 and 60% correct with the MP strategy. Subjects were fitted with three experimental strategies matched for pulse duration, pulse rate, filter settings, and loudness on a channel-by-channel basis. The strategies included 14 channels programmed in MP, fixed partial tripolar (σ = 0.8), and dynamic partial tripolar (σ at 0.8 at threshold and 0.5 at the most comfortable level). Fifteen minutes of listening experience was provided with each strategy before testing. Sound quality ratings were also obtained.
Results:
Speech perception performance for vowel identification in quiet at 50 and 60 dB SPL and for spondees in noise was similar for the three tested strategies. However, performance on vowel identification in noise was significantly better for listeners using the dynamic focusing strategy. Sound quality ratings were similar for the three strategies. Some subjects obtained more benefit than others, with some individual differences explained by the relation between loudness growth and the rate of change from focused to broader stimulation.
Conclusions:
These initial results suggest that further exploration of dynamic focusing is warranted. Specifically, optimizing such strategies on an individual basis may lead to improvements in speech perception for more adult listeners and improve how CIs are tailored. Some listeners may also need a longer period of time to acclimate to a new program.
INTRODUCTION
Excessive channel interaction is a likely contributor to poor speech perception scores in some cochlear implant (CI) listeners (Jones et al. 2013; Bierer & Litvak 2016; Zhou 2016). The standard monopolar (MP) electrode configuration used in commercially available CIs creates a broad electrical field, which may lead to unwanted channel interaction (Nelson et al. 2008; Bierer & Faulkner 2010; Landsberger et al. 2012; Fielden et al. 2013; Padilla & Landsberger 2016). One method to reduce channel interaction is to use focused electrode configurations such as tripolar and phased array (Srinivasan et al. 2013; Long et al. 2014). Utilizing these configurations in speech-processing strategies, however, has led to mixed results for speech understanding despite general improvements on spectral ripple discrimination (Berenstein et al. 2008; Smith et al. 2013; Srinivasan et al. 2013, Bierer & Litvak 2016).
There are at least three factors that limit the application of focused stimulation in clinical processors. First, focused configurations require more current to achieve comfortable loudness levels, which may lead to greater power requirements and thus a shorter battery life for the CI. Second, it is difficult to reach a loud but comfortable stimulus level for some channels in some listeners because of the voltage compliance limits of the devices (Bierer & Litvak 2016), meaning that loudness growth can be incomplete for focused stimulation strategies (Chatterjee 1999; Chua et al. 2011; Bierer & Nye 2014). Third, although very little evidence exists that side-lobe activation causes broader excitation patterns in human CI listeners, some animal and modeling studies have suggested that focused configurations, such as tripolar or partial tripolar (TP), can create side-lobes from the return electrodes (Litvak et al. 2007; Bonham & Litvak 2008). Side-lobe activation is more likely at high current levels and with electrodes close to the inner wall of the cochlea (Bonham & Litvak 2008). Side-lobes may activate the auditory nerve and spread the cochlear excitation further than intended by the stimulation mode in an uncontrolled manner (Litvak et al. 2007; Goldwyn et al. 2010; Frijns et al. 2011).
Dynamic focusing is a physiologically inspired method for providing improved spectral resolution while eliminating the potential activation of side-lobes and reducing power consumption. Dynamic focusing mimics some aspects of cochlear excitation patterns in normal acoustic hearing by dynamically varying the amount of focusing as a function of the input level; specifically, it provides more focused TP stimulation for low-intensity sounds and less focused TP stimulation for high-intensity sounds, based on the loudness model of Litvak et al. (2007). Using this method of dynamic focusing, as the intensity of the input sound increases, the current levels are increased, and the electrical fields are broadened. A detailed description of the mathematical derivation of the stimulus levels and configurations can be found in the Appendix, Supplemental Digital Content 1 (http://links.lww.com/EANDH/A415).
An additional benefit of dynamic focusing, as opposed to fixed configurations, is that by reducing the focusing at high levels, overall current consumption can be reduced. A recent study by Nogueira et al. (2017) found reduced power consumption using another method of dynamic focusing.
There is physiological evidence from animal models and artificial neural network analyses of neural data suggesting that dynamic focusing might provide better intensity cues than simple tripolar stimulation (Bierer & Middlebrooks 2002; Middlebrooks & Bierer 2002). In those studies, the spread of excitation across the frequency map of the primary auditory cortex was assessed by recording neural activity at 16 locations simultaneously. Comparisons were made between acoustic stimulation with pure tones and noise bands (Arenberg et al. 2000) and CI stimulation with various electrode configurations (Bierer & Middlebrooks 2002). The results demonstrated more restricted neural activation for the tripolar electrode configuration compared with MP configuration. Using an artificial neural network as a pattern recognition tool, tripolar stimulation led to the best identification of CI stimulation channels but the poorest discrimination of stimulation level. This outcome led to the conclusion that the spread of activation in the auditory cortex remained too focused with tripolar and, thus, did not provide cues for intensity increases based on increased spread of excitation. Thus, electrical stimulation may be too broad for adequate spectral resolution but may not broaden sufficiently with increasing level for adequate intensity resolution. The working hypothesis of the present study is that the dynamic focusing algorithm could provide a better combination of channel discrimination and intensity resolution, resulting in improved speech recognition, than either MP or tripolar configurations.
The present study tests whether dynamic focusing (or dynamic tripolar [DT] configuration) can improve aspects of speech perception compared with fixed MP or TP electrode configurations. Speech perception scores were obtained for subjects fitted with three experimental strategies: MP, TP, and DT (Fig. 1). Performance was compared on spondee and vowel identification tasks in quiet and in background noise. Vowels were selected as outcome measures because they are critical for speech perception and because they are more reliant on spectral cues, which are most likely to be affected by focusing and dynamic focusing. Spondees were also selected because they include both vowels and consonants. Subjects also rated the sound quality of each strategy.
Fig. 1.
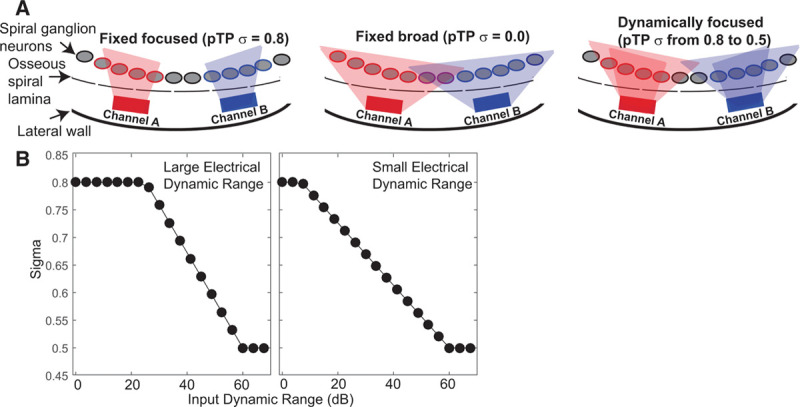
Schematic of dynamic focusing and the relationship between sigma and level. A, Two cochlear implant channels are represented by rectangles, spiral ganglion neurons by gray ovals, and the edge of the osseous spiral lamina by a dashed line. The spatial extent of currents required to activate neurons for each channel are indicated by the shaded areas. Partial tripolar with a fixed focused configuration is shown on the left (TP); the σ focusing coefficient was fixed at 0.8. The middle drawings show the monopolar (MP) configuration; σ was fixed at 0. The new dynamically focused configuration is shown on the right. This new mode stimulates with a highly focused configuration for threshold inputs (σ = 0.8) and a broader configuration for input levels near most comfortable levels (σ = 0.5). B, Two examples of the rate of change of the focusing coefficient as a function of the input stimulus level for a 60-dB input dynamic range (Litvak et al. 2007). The left panel shows an example channel with a large electrical dynamic range, while the right panel shows a channel with a small electrical dynamic range.
MATERIALS AND METHODS
Subjects
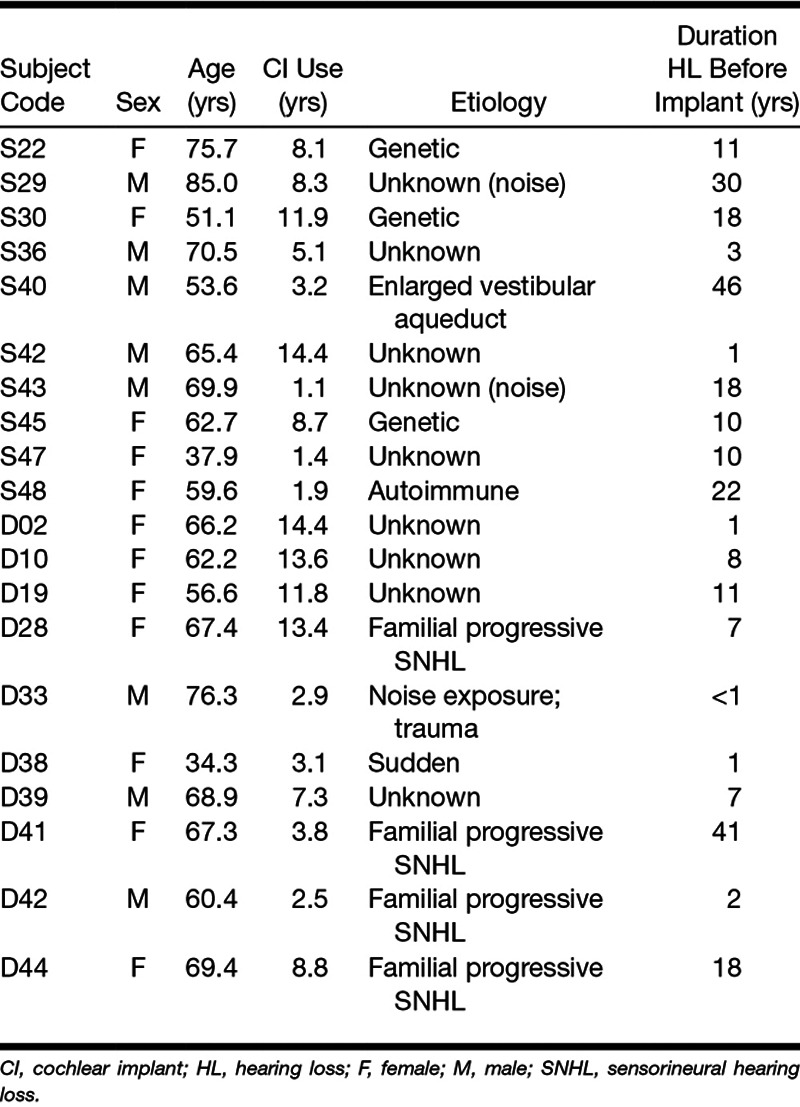
Twenty postlingually deafened adults implanted with Advanced Bionics CIs participated. Subject demographics are included in Table 1. Subjects are identified with a number and a letter. The letter indicates where they were tested: S-subjects were tested in Seattle at the University of Washington (UW) and D-subjects were tested in Minneapolis at the University of Minnesota (UM).
TABLE 1.
Subject demographics
Electrode Configurations
Figure 1 shows a schematic of the three electrode configurations used to create the experimental, 14-channel, programs. The schematic represents two CI channels with rectangles, spiral ganglion neurons by gray ovals, and the edge of the osseous spiral lamina by a dashed line. The shaded areas indicate the spatial extent of current required to activate neurons for each channel. TP with a fixed focused configuration is shown on the left (TP); the focusing coefficient (σ) was fixed at 0.8. The middle drawings show the MP configuration; σ was fixed at 0. The DT configuration is shown on the right. This new mode stimulates with a highly focused configuration for input levels near threshold (σ = 0.8) and a broader configuration for input levels near most comfortable level (MCL; σ = 0.5). The focusing coefficient changes with level in a way that is based on the loudness model of Litvak et al. (2007). The relationship between σ and the input sound level is shown in Figure 1B for two different electrical dynamic ranges (Litvak et al. 2007). The example on the left shows a situation where the listener has a large dynamic range, while the example on the right shows the situation where the listener has a relatively small dynamic range. When the dynamic range is small, changes in σ occur across a wider range of input levels, whereas with a larger dynamic range, changes in σ occur over a smaller range of higher input levels. As explained in the Appendix, Supplemental Digital Content 1 (http://links.lww.com/EANDH/A415), the interaction component, K, is determined in the loudness model of Litvak et al. by factors such as electrode array type and spacing between the compensating and primary electrode. A K value of zero indicates similar current levels to achieve most comfortable level for both focusing coefficients (σ = 0.5 and σ = 0.8), whereas a K value of one indicates that the most comfortable levels are very different across σ values. In this study, K was set to 0.9 in all cases.
Stimuli
Biphasic, charge-balanced, cathodic-phase first pulse trains were used for the psychophysical measures. Phase durations were 97 µsec, and the pulse rate was 997.9 pulses per second. Each pulse train was 200.4 msec in duration and was presented either in the MP or in the TP configurations. All stimuli were presented and controlled using research hardware and software (BEDCS) provided by the Advanced Bionics Corporation (version 1.18; Valencia, CA). Programs were written using the Matlab programming environment, which controlled low-level BEDCS routines. The same software and hardware were used at both testing sites (Minneapolis and Seattle).
Most Comfortable Levels
MCL level was determined behaviorally using the Advanced Bionics clinical loudness scale. These levels were determined for MP and TP with σ = 0.5 and 0.8 for all available electrodes and served as the maximum stimulus levels for all psychophysical procedures. To determine MCL level, current level was increased manually until subjects reported a loudness rating of “6,” or “most comfortable.”
Psychophysical Thresholds
Thresholds were measured for both MP (σ = 0) and TP (σ = 0.8) stimulation using a rapid psychophysical procedure. The method used is analogous to an upward acoustic frequency sweep, where pulse trains were presented at regular time intervals to two active electrodes while the steering coefficient, α, was increased from 0 to 1 in 0.1 steps beginning with the most apical set of quadrupolar electrodes, using a form of Bekesy tracking (Bierer et al. 2015). An α coefficient of 0 indicates that all of the current is steered to the more apical electrode of the pair, while an α of 1 indicates all current is delivered to the more basal electrode of the pair. This process was repeated without interruption for the next, more basal set of electrodes until all available sets were tested (active electrodes 2 to 15), resulting in a single forward sweep. During each sweep, the subject was instructed to hold down a button while the stimulus was audible and to release the button when it was inaudible. The current was decreased between pulse trains while the subject held down a button and was increased while the button was not depressed. A similar backward sweep was also obtained and the two were averaged together to constitute a complete run. A total of two runs were averaged for each subject to estimate threshold. Stimuli were delivered through a custom Matlab-based user interface controlling BEDCS software (Advanced Bionics). Thresholds were measured this way for both the MP (σ = 0) and steered quadrupolar electrode (σ = 0.8) configurations. The steered quadrupolar thresholds were used to estimate the TP σ = 0.8 thresholds, as thresholds are strongly correlated between the two configurations (Bierer et al. 2015).
Programming Speech Processors
All experimental programs were made using BEPS+ software with designated research Harmony sound processors. Thresholds were converted into charge units and used for creating 14-channel, experimental programs in BEPS+ software. Programs were matched for pulse duration, filter settings, ClearVoice level, and loudness on a channel-by-channel basis.
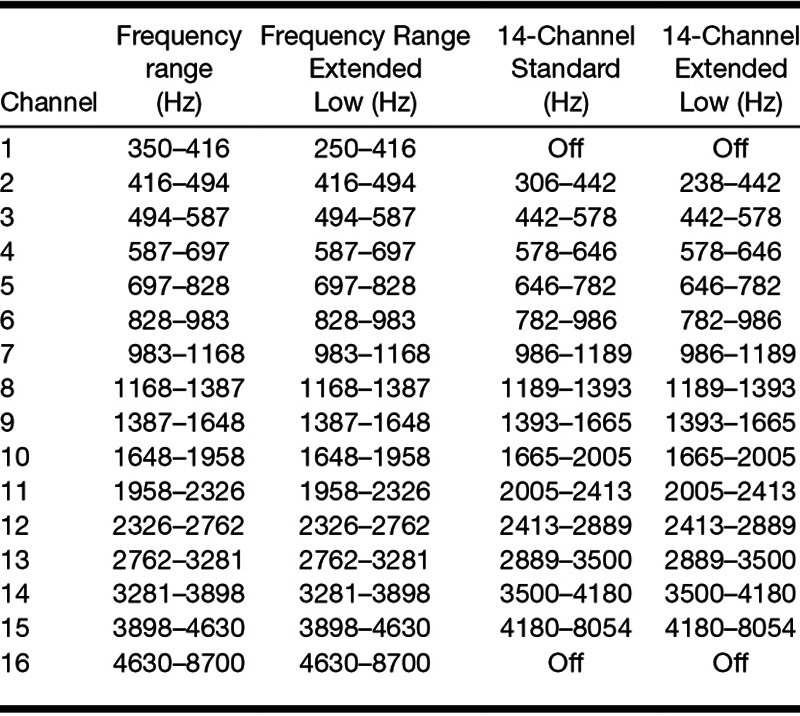
A 14-channel, TP program was created as a baseline program upon which the MP and DT programs were modeled. This approach allowed for several parameters to remain constant across the three programs. First, ClearVoice was set to match the listeners’ everyday listening programs, and the frequency allocations were changed to only 14 channels (Table 2). Second, the input dynamic range was set at 60 dB, and gains were set to 0 dB. To ensure that each program had the same pulse width, auto pulse width was enabled while making the TP program, after which the pulse widths were fixed for the DT and MP programs. To begin, psychophysical thresholds measured earlier (steered quadrupolar σ = 0.8) were converted into charge units and entered as a starting point for programming TP. Likewise, steered quadrupolar (σ = 0.8) M levels, used previously for the threshold sweep, were converted into charge units and entered as a starting point for setting loudness. These M levels were reduced by 10 steps for a conservative starting level. In live voice, the overall M levels were adjusted until the listener reported that the levels were most comfortable.
TABLE 2.
Frequency allocations
For the MP and DT programs, careful consideration was given to equating the loudness for different configurations within individuals through balancing each stimulus channel between programs by matching most comfortable levels on a channel-by-channel basis. For example, the even-numbered channels were balanced between DT and TP in a pairwise manner such that DT stimulation for channel 2 was adjusted until it was equally loud with the TP channel 2. This process was repeated for all even channels and then all odd channels with DT and TP. The same procedure was repeated with even and odd MP channels balanced to the TP channels. The programs were then written to the processor using the “Aux Only” setting for direct connect testing. In the processor management screen using the talk over function, the loudness of the three programs was compared, and minor adjustments to the M-levels were made as needed before testing.
Outcome Measures
Speech perception testing was performed using the Listplayer software with BEPS+ (Advanced Bionics) running in parallel and using the direct audio input cable. Before testing, subjects were given 15 minutes of listening experience with each strategy. The experience consisted of listening to the AzBio sentences (Spahr et al. 2012) with the words of the sentences shown on the screen. Sentences were presented at 60 dB SPL equivalent. The signal was calibrated through direct connect using the ListPlayer software such that a signal presented at 60 dB SPL is equivalent to 60 dB SPL in the sound field. The signal is digitally calibrated to match the microphone output with the same SPL level.
Naturally spoken, male-talker vowels in the /hVd/ context were presented in quiet at a low level (50 dB SPL equivalent) and at a conversational level (60 dB SPL equivalent) and in noise at a level of 60 dB SPL. Auditec four-talker babble was used for background noise. The signal to noise ratio was adjusted for each subject individually, such that performance was between 40 and 60% correct with the MP strategy; therefore, the noise level was different for every subject. Testing with focused strategies was then performed at the same signal to noise ratio as in the MP condition. Listeners were only tested in the presence of background noise if their performance in quiet exceeded 70% correct (subjects S29, S40, D38, and D44 were not tested in noise).
In a closed set, 12 spondees were presented at 60 dB SPL in noise (spondees N), using the same procedure for setting the signal to noise ratio as with the vowels. The final signal to noise ratios used for testing are listed in Table 3.
TABLE 3.
Program settings

For the speech identification testing for both vowels and spondees, a run consisted of 3 repetitions of each token. First, subjects performed one practice run with feedback. After the practice run, at least two runs were completed. A third run (3 more repetitions) was included if the proportion of correct responses in the first 2 runs differed by more than 10 percentage points. The MP strategy was always tested first, followed by TP or DT in random order across participants. A repeated-measures analysis of variance (ANOVA) with test order as a between-subjects factor found no significant main effect of, and no interactions with, test order [F(1,18) = 0.147; p = 0.706; partial η2 = 0.008]. MP was always tested first because this was the most similar to the subjects’ everyday programs and was used as a baseline for comparison. We cannot rule out the possibility that having it always presented first affected the outcomes; however, we consider this less likely because the order of the last two conditions did not significantly affect performance in those conditions.
In addition to reporting the stimuli, subjects were also asked to rate each of the three stimulation strategies on a scale from 1 (low) to 10 (high) for the following sound qualities: pleasantness, naturalness, richness, fullness, dull to crisp, rough to smooth, clarity/intelligibility in quiet, clarity/intelligibility in noise, expressiveness, and ease of listening.
The settings for all three stimulation strategies are shown in Table 3. As discussed above, pulse width was set based on the current-level requirements for the TP program. ClearVoice settings were set according to each subject’s everyday program. The frequency range, extended low or standard, was also set to match each subject’s everyday program.
The statistical package SPSS was used to compute most statistical results. All reported ANOVAs include a Greenhouse-Geisser correction for lack of sphericity, where applicable. For statistical analysis, performance scores were converted to rationalized arcsine units (rau; Studebaker 1985). This conversion can be useful when data span a range of percent correct scores and corrects for the compression of scores at high- and low-performance levels.
R (R Core Team 2012) and lme4 (Bates et al. 2015) were used to perform a linear mixed-effects analysis of the relationship between the K coefficient and electrode-to-modiolus distance. As fixed effects, we entered electrode-to-modiolus distance into the model. As a random effect, we had intercepts for subjects. The p values were obtained by likelihood ratio tests of the full model with the effect in question against the model without the effect in question.
RESULTS
Speech perception performance for vowel identification in quiet at 50 and 60 dB SPL are presented in Figure 2 in the upper and lower panels, respectively. Performance (as % correct) is plotted for MP (gray), TP (green), and DT (blue) strategies for vowels tested in quiet. Performance was similar with the three tested strategies when testing in a quiet listening environment. A repeated-measures ANOVA on the rau-transformed scores revealed a significant main effect of presentation level (50 or 60 dB) [F(1,19) = 29.8; p < 0.001; partial η2 = 0.610], but no effect of stimulation strategy [F(1.8,35.1) = 2.98; p = 0.068; partial η2 = 0.135] and no interaction [F(1.8,33.4) = 0.713; p = 0.480; partial η2 = 0.036].
Fig. 2.
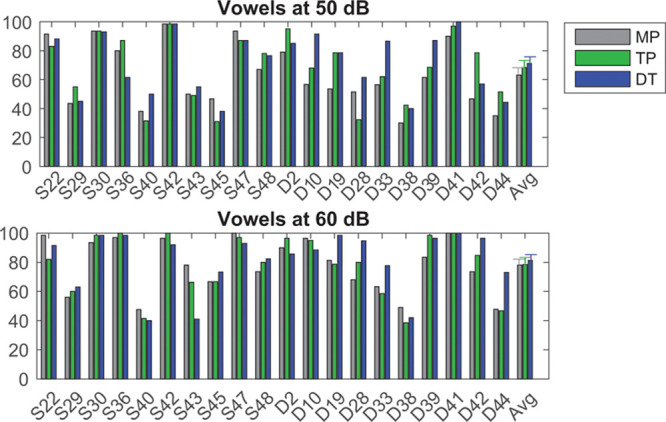
Performance (as % correct) is plotted for MP (gray), TP (green), and DT (blue) strategies for vowel identification when stimuli were presented at 50 (top) and 60 (bottom) dB SPL equivalent. The right most set of bars represents the average data, and error bars represent the standard error of the mean. DT indicates dynamic tripolar; MP, monopolar; TP, partial tripolar.
The speech perception scores for stimuli presented in background noise are shown in Figure 3. The raw identification scores and those relative to the MP scores are plotted for vowels (top two panels, respectively) and spondees (lower two panels). Performance on vowel identification in background noise was better for most listeners with dynamically focused stimulation strategies. However, no consistent change in performance was observed for the spondee scores. A repeated-measures ANOVA on the rau-transformed scores for vowels in noise revealed a significant effect of stimulation strategy [F(1.7,26.0) = 7.45; p = 0.004; partial η2 = 0.332]. Paired comparisons revealed that the DT condition produced significantly higher scores than either the MP (p = 0.001) or TP (p = 0.006) conditions. A similar repeated-measures ANOVA on the spondees in noise provided no evidence for an effect of condition [F(1.8,34.2) = 1.16; p = 0.321; partial η2 = 0.058]. Thus, overall, DT produced a small but significant improvement in performance for vowels in noise but not for vowels in quiet or spondees in noise. The improvement remained significant even when using a Bonferroni correction to account for the multiple conditions tested, involving vowels in quiet at 50 and 60 dB SPL, vowels in noise, and spondees in noise (four conditions, leading to a criterion p value, α, of 0.0125).
Fig. 3.
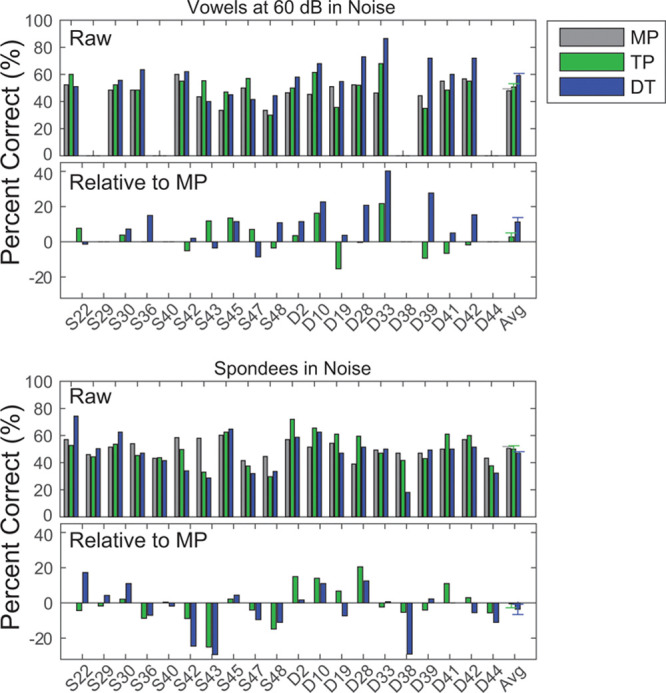
The top pair of panels represents the raw scores (top) for vowel identification when presented in background noise and the same scores plotted relative to the score with MP (bottom). Note that subjects S29, S40, D38, and D44 were not tested in background noise. The lower pair of panels represents the raw (top) and relative (bottom) scores for spondee identification in noise. Conventions as in previous figure. MP indicates monopolar.
To examine the effect of test location (UW versus UM), a two-way repeated-measures ANOVA (stimulation strategy by test measure) with test location as a between-subjects variable was run across all four speech measures for all 20 subjects. There was no main effect of test location [F(1,14) = 0.004; p = 0.953; partial η2 = 0.000]; no interaction between test location and test measure [F(1.7,23.3) = 1.098; p = 0.340; partial η2 = 0.073]; and no three-way interaction between test location, measure, and stimulation strategy [F(4.1,57.2) = 2.285; p = 0.070; partial η2 = 0.140]. However, the two-way interaction between test location and stimulation strategy was significant [F(1.5,21.4) = 9.88; p = 0.002; partial η2 = 0.414]. A contrast analysis confirmed that DT (p = 0.001) and TP (p = 0.002) were both significantly different than MP and that UM subjects obtained a greater benefit than did UW subjects. It is not clear what accounts for this interaction, as the protocols and hardware were the same in both locations.
Sound quality ratings were collected for MP, TP, and DT stimulation strategies. Ratings averaged across subjects are shown in Figure 4A for the different sound quality categories and averaged across sound qualities for each subject in Figure 4B. There was a tendency for scores to be higher for the DT stimulation strategy; however, this trend did not reach significance: a repeated-measures ANOVA on the ratings found an effect of subjective dimension [F(5.4,96.7) = 6.04; p < 0.001; partial η2 = 0.251], but no significant main effect of strategy [F(1.7,31.3) = 2.081; p = 0.147; partial η2 = 0.104], and no significant interaction [F(5.9,106) = 0.839; p = 0.541; partial η2 = 0.045].
Fig. 4.
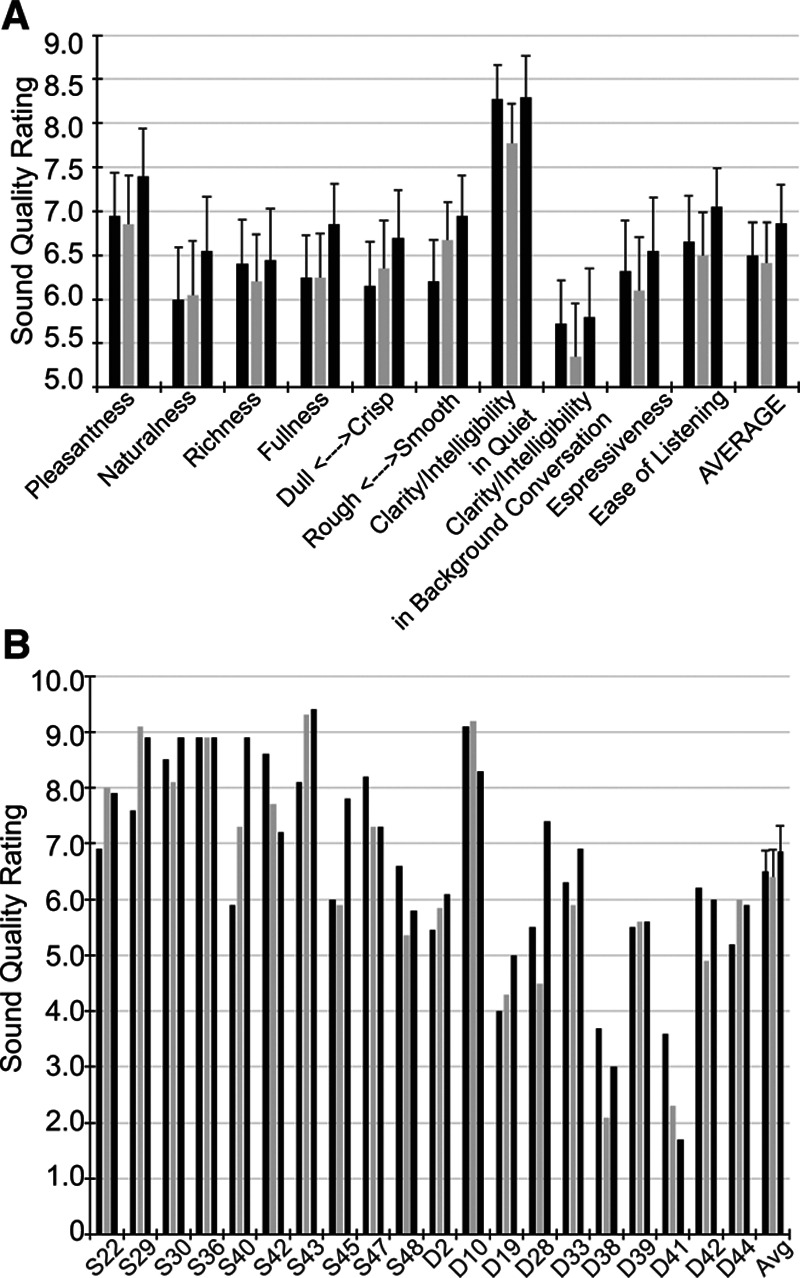
Sound quality ratings averaged across listeners and for individuals. A, Each bar height indicates the sound quality rating (qualities label the x axis) averaged across listeners for MP (black), TP (light gray), and DT (dark gray). The average of sound qualities across listeners is shown in the right-most set of bars. B, Each bar height indicates the sound quality ratings averaged across sound qualities for individual subjects (labeled along the x axis). Error bars represent standard error of the means. DT indicates dynamic tripolar; MP, monopolar; TP, partial tripolar.
Although there was only a significant main effect overall of processing for the vowels in noise, some individuals seemed to benefit more than others. One possible factor underlying individual differences is the duration of deafness: increased deafness duration can lead to greater neural atrophy and hence fewer surviving neurons to stimulate (Nadol 1997). However, duration of deafness was not correlated with performance with TP for vowels in quiet (Pearson r = −0.255; n = 20; p = 0.27). Figure 5, left plots the benefit obtained on vowel identification in noise using DT compared with MP programs as a function of duration of deafness in years. Note that subjects who were not tested in noise were not included in this analysis. There is a trend toward greater benefit of DT on average for those who have shorter durations of deafness; however, the trend fails to reach statistical significance (Pearson r = −0.36; n = 16; p = 0.16). Another potential factor is the subjects’ overall performance level. To assess this possibility, we took each subject’s performance with the MP control strategy to reflect overall performance because we did not test listeners with their everyday listening strategies. The amount of benefit obtained with dynamic focusing was not correlated with the MP performance (Pearson r = −0.33; n = 20; p = 0.21). Note that the MP control strategy differs from the listener’s every day strategy because the frequency allocation is different (Table 2), and current steering is deactivated.
Fig. 5.
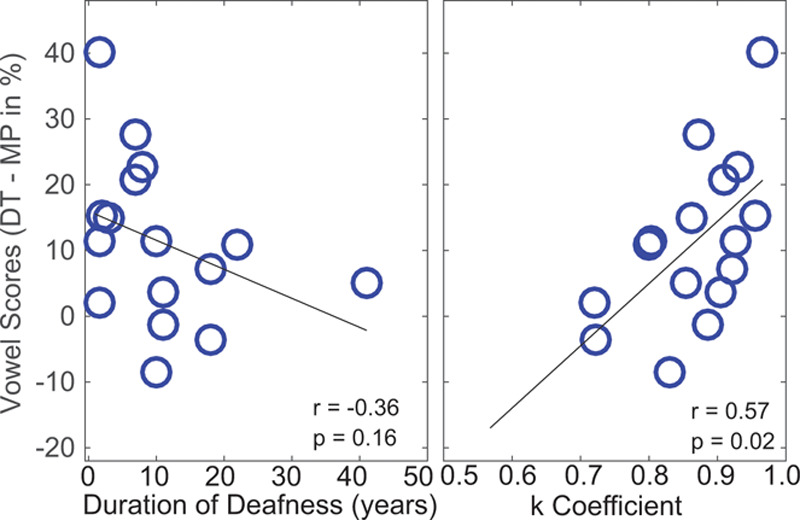
The difference between performance on vowel identification in noise with DT minus performance with MP (ordinate) is plotted as a function of duration of deafness (left) and as a function of estimated K coefficient (right). Each circle represents data from one subject, and only subjects tested in background noise were included. DT indicates dynamic tripolar; MP, monopolar.
Another possible factor is the relationship between the K coefficient used in the experiment and the K coefficient indicated by each subject’s (and electrode’s) MCL levels (Litvak et al. 2007). As mentioned above and in the Appendix, Supplemental Digital Content 1 (http://links.lww.com/EANDH/A415), K determines the rate of change for sigma (σ) depending on the input level of the signal and was set to a fixed value of 0.9. One can calculate what the K coefficient should have been for each channel in each subject from the measures of MCL levels that were loudness balanced for σ = 0.5 (MCLDT) and σ = 0.8 (MCLTP). The predicted K coefficient is given as:
 |
The average predicted K coefficient across all subjects and channels was 0.84. One possibility is that the closer the predicted K coefficient is to the value of 0.9 as used in the current experiments, the more likely the listener is to be able to use loudness cues from combined electrodes effectively. The right panel of Figure 5 plots the focused benefit as a function of the predicted K coefficient. Listeners with higher K coefficients tend to be better able to utilize the cues provided by dynamic focused stimulation and resulted more benefit in vowel identification with DT program (r = 0.57; n = 20; p = 0.02).
Finally, in the model by Litvak et al. (2007), there is a prediction that the larger K coefficients occur with larger distances between stimulating electrodes and the target neurons, which means that a slower change in σ is needed. In seven of the subjects, CT imaging data are available, from which were estimated the distance from each electrode to the inner wall of the cochlea (data from DeVries et al. 2016). Figure 6 shows the relationship between the distance of electrodes to the inner wall of the cochlea and K coefficients. A mixed-effects model revealed that larger K coefficients occur for electrodes with larger distances (linear mixed model fit by maximum likelihood using R software; χ2 = 18.02; p < 0.001). Thus, the results from these seven subjects are broadly consistent with the predictions of the Litvak et al. model.
Fig. 6.
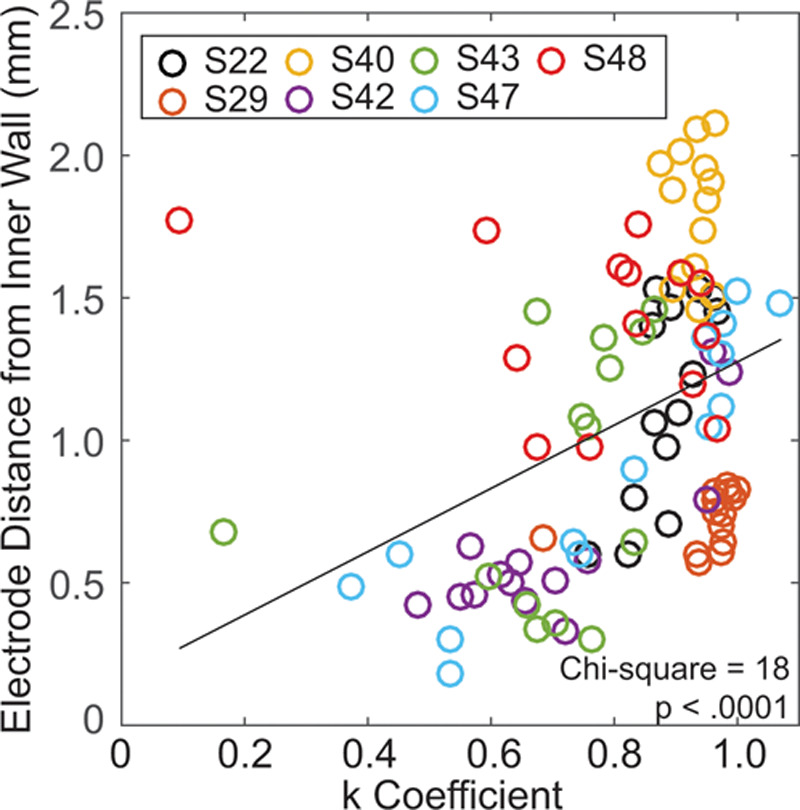
The computed tomography–estimated distance of each electrode from the inner wall of the cochlea is plotted as a function of estimated K coefficient. Each subject is represented by color with multiple data points for each electrode (14 per subject). The black line is a least-squares, best fit line to the data.
DISCUSSION
Listeners with CIs have varying degrees of channel interactions (Bierer & Faulkner 2010; Anderson et al. 2011; Jones et al. 2013). Individuals with higher degrees of channel interaction often have poorer speech perception abilities (Jones et al. 2013). Therefore, in the present study, we sought to reduce channel interaction while maintaining and possibly improving speech perception abilities.
Previous studies have compared speech perception scores and spectral ripple discrimination abilities using two of the electrode configurations—MP and TP—assessed in the present study (Mens & Berenstein 2005; Berenstein et al. 2008; Srinivasan et al. 2013; Bierer & Litvak 2016). Only one of those studies found a consistent improvement for listeners on both speech perception and spectral ripple performance with the focused TP configuration (Srinivasan et al. 2013). The other studies found mixed results on speech perception, where some listeners improved with focused stimulation and others did not (Mens & Berenstein 2005; Berenstein et al. 2008; Bierer & Litvak 2016). In this study, we also observed very little or inconsistent improvement in speech perception with TP compared with MP stimulation. A consistent improvement was observed, however, with the DT configuration for vowel identification in background noise. One explanation for this improvement is that the dynamic focusing reduces channel interactions without introducing activation of side lobes at high levels. Another explanation is that the dynamic changes in spread of excitation might be more similar to acoustic activation of the cochlea than either the broadly activating MP or the fixed-focused TP configuration. Therefore, it may be that the auditory system can more easily interpret spectrally complex signals using the edge cues provided by the signal input. Another likely explanation discussed below is that the dynamic focused stimulation alters loudness growth and summation improving the spectral contrasts.
The selection of σ = 0.5 for the high-intensity signals with dynamic focusing were selected to differentiate dynamic focusing from both the MP (σ = 0) and fixed TP (σ = 0.8). This was done despite the fact that psychophysical tools have not detected large differences in the spread of the electrical field in the cochlea with differing σ values (Landsberger et al. 2012).
Because of the reduction in channel interaction and because the neural activation is likely broader for higher input levels than it would be with fixed tripolar, we anticipated improvements in the sound quality ratings of “naturalness,” “fullness,” and “clarity/intelligibility with background conversation.” However, when taken together, no statistically significant differences were observed in overall sound quality between the three electrode configurations. In general, the listeners rated the quality of DT higher than MP but not always higher than fixed TP. Other studies of CI programming have not asked listeners to rate the sound quality in this way so it is not possible to compare these findings to others. However, two studies have asked sound quality questions of listeners with single-channel stimuli with MP and TP configurations (Landsberger et al. 2012; Padilla & Landsberger 2016). Those studies found a relationship between sharpness of tuning and how tone-like the signals’ percepts were on individual channels, but it is unclear how such single-channel quality perceptions would extend to multichannel speech-processing strategies.
The possible mechanisms for improvement with dynamic focusing compared with MP or fixed focused strategies involve changes in the combination of intensity cues and spectral shape. Changes to loudness summation may also contribute to improved vowel identification in background noise. Loudness summation is different for MP and TP stimuli, such that loudness summation is greater for MP at softer levels than for TP (Padilla & Landsberger 2014). This difference could explain why performance is better for vowels for the focused strategies compared with the MP strategy and why the effect could have been muted for the higher-level background noise used for the spondee stimuli. Perhaps loudness summation may also explain part of the benefits observed with DT compared with TP if the loudness summation using the DT strategy was similar to TP for low-intensity inputs and more like MP for higher inputs. The loudness summation enhancement of the spectral shape cues might have been lost for the spondees in noise condition where the signal to noise ratios were mostly negative (Table 3). This is in contrast to the either 0 or primarily positive signal to noise ratios used for the vowel identification in noise testing.
The benefits of the dynamic focusing strategy may be underestimated by this study for a number of reasons. First, the CI settings were consistent across programs, forcing the use of relatively long pulse widths to accommodate the high current level requirements of the fixed focused TP program. The range of phase durations was from 20.7 to 127.5 µsec/phase, and the typical patient clinically has phase durations of less than 40 µsec/phase. The Advanced Bionics system automatically increases the pulse widths for high current level requirements to stay below the compliance and charge density safety limits (Shannon 1992). Longer pulse durations result in strategies with slower pulse rates and the new processing strategies, particularly with the Advanced Bionics system, are usually at least 1200 pulses per second. It may be that optimizing the programs for DT without other limitations from the fixed focused program will lead to further enhancement of speech perception scores, as it would for any of the strategies.
A second reason that the benefits of dynamic focusing may have been underestimated is that we did not optimize the change in loudness as a function of focusing coefficients for individual listeners or for individual channels; rather, we used computational model estimates that were validated using psychophysical measures in a relatively small number of CI users (Litvak et al. 2007). Another study of loudness showed that the growth of loudness varied for channels within individuals with low and high thresholds (Bierer & Nye 2014), suggesting that future studies may benefit from optimizing loudness growth spread functions on a channel-by-channel basis.
The third reason DT stimulation may not have shown a benefit for all listeners is that some listeners may need experience with new programming strategies. The mapping of loudness within channels for DT is very different from the mapping used with the fixed configuration strategies. It might, therefore, be that some listeners (for instance, those with longer periods of deprivation) need more time to adjust to such programming changes. A number of studies have shown that listeners can adapt to new program settings when given an extended time to acclimate to the new program (Fu et al. 2002; Fu & Galvin 2007). Therefore, the effects of listening experience will be explored in future experiments by testing the initial performance as we did in this study and then testing again after up to 1 month of listening with a research processor.
At least some CI listeners can benefit from reducing channel interaction by deactivating a subset of the channels (Garadat et al. 2013; Noble et al. 2014; Bierer & Litvak 2016; Zhou 2016). It is possible that dynamic focusing, combined with deactivating channels with a high degree of channel interaction, may provide greater benefits. Future experiments will explore this question by examining a combination of dynamic focusing and channel deactivation.
Finally, listeners may also perform better when the K coefficient (which determines how the spread of stimulation changes as a function of input level) is set for each channel and listener individually. The K coefficient used for all channels and subjects was 0.9 and was based on computational modeling and psychophysical loudness data (Litvak et al. 2007). In the computational model of Litvak et al. (2007), they predicted that smaller K coefficients would be necessary for electrodes that are close to the target neurons. If a larger coefficient is used than would be optimal for the individual listeners, then the loudness growth on those electrodes may differ from the expected logarithmic map of acoustic level to electric charge. This difference in loudness for key features of a speech stimulus, such as formant frequencies and transitions, could be at an incorrect ratio for the listener to use effectively. When the optimal K coefficient was estimated from the measured MCL levels in the present study, the listeners whose optimal K was similar to the 0.9 implemented in the study were those who tended to obtain the most benefit from dynamic focusing. Future experiments will explore the effects of manipulating and possibly optimizing K coefficients for each subject.
In summary, many of the participants in the present study performed better on vowel identification tasks in background noise when dynamic focusing strategies were employed. However, performance was unchanged on vowel identification in quiet and for spondee identification in noise. Future studies will attempt to better optimize dynamic focusing and provide listeners with time to acclimate to the new programming to determine the extent that benefits can be obtained with this novel method for programming CIs.
ACKNOWLEDGMENTS
The authors thank the cochlear implant subjects who patiently participated in this study. The authors also thank Lindsay DeVries and Gabrielle O’Brien for assistance with statistical analyses.
Supplementary Material
Footnotes
This work was funded by the National Institutes of Health, National Institute of Deafness and Other Communication Disorders R01DC012142 (J.G.A./J.A.B.) and R01DC012262 (A.J.O.).
The authors declare no conflicts of interest.
Supplemental digital content is available for this article. Direct URL citations appear in the printed text and are provided in the HTML and text of this article on the journal’s Web site (www.ear-hearing.com).
REFERENCES
- Anderson E. S., Nelson D. A., Kreft H., et al. Comparing spatial tuning curves, spectral ripple resolution, and speech perception in cochlear implant users. J Acoust Soc Am, 2011). 130, 364–375.. [DOI] [PMC free article] [PubMed] [Google Scholar]
- Arenberg J.G., Furukawa S., Middlebrooks J. C. Auditory cortical images of tones and noises. J Assoc Res in Otolaryngol, 2000). 1, 183–194.. [DOI] [PMC free article] [PubMed] [Google Scholar]
- Bates D., Maechler M., Bolker B., et al. Fitting linear mixed-effects models using Ime4. J Stat Softw, 2015). 67, 1–48.. [Google Scholar]
- Berenstein C. K., Mens L. H., Mulder J. J., et al. Current steering and current focusing in cochlear implants: Comparison of monopolar, tripolar, and virtual channel electrode configurations. Ear Hear, 2008). 29, 250–260.. [DOI] [PubMed] [Google Scholar]
- Bierer J. A., Faulkner K. F. Identifying cochlear implant channels with poor electrode-neuron interface: Partial tripolar, single-channel thresholds and psychophysical tuning curves. Ear Hear, 2010). 31, 247–258.. [DOI] [PMC free article] [PubMed] [Google Scholar]
- Bierer J. A., Litvak L. Reducing channel interaction through cochlear implant programming may improve speech perception: Current focusing and channel deactivation. Trends Hear, 2016). 20, 1–12.. [DOI] [PMC free article] [PubMed] [Google Scholar]
- Bierer J. A, Middlebrooks J. C. Auditory cortical images of cochlear-prosthesis stimuli: 2002). 87, J Neurophysiol, Dependence on electrode configuration; 478–492.. [DOI] [PubMed] [Google Scholar]
- Bierer J. A., Nye A. D. Comparisons between detection threshold and loudness perception for individual cochlear implant channels. Ear Hear, 2014). 35, 641–651.. [DOI] [PMC free article] [PubMed] [Google Scholar]
- Bierer J. A., Bierer S. M., Kreft H. A., Oxenham A. J. A fast method for measuring psychophysical thresholds across the cochlear implant array. Trends Hear, 2015). 19, 1–12.. [DOI] [PMC free article] [PubMed] [Google Scholar]
- Bonham B. H., Litvak L. M. Current focusing and steering: Modeling, physiology, and psychophysics. Hear Res, 2008). 242, 141–153.. [DOI] [PMC free article] [PubMed] [Google Scholar]
- Chatterjee M. Effects of stimulation mode on threshold and loudness growth in multielectrode cochlear implants. J Acoust Soc Am, 1999). 105(2 Pt 1), 850–860.. [DOI] [PubMed] [Google Scholar]
- Chua T. E., Bachman M., Zeng F. G. Intensity coding in electric hearing: Effects of electrode configurations and stimulation waveforms. Ear Hear, 2011). 32, 679–689.. [DOI] [PMC free article] [PubMed] [Google Scholar]
- DeVries L., Scheperle R., Bierer J. A. Assessing the electrode-neuron interface with the electrically evoked compound action potential, electrode position, and behavioral thresholds. J Assoc Res Otolaryngol, 2016). 17, 237–252.. [DOI] [PMC free article] [PubMed] [Google Scholar]
- Fielden C. A., Kluk K., McKay C. M. Place specificity of monopolar and tripolar stimuli in cochlear implants: The influence of residual masking. J Acoust Soc Am, 2013). 133, 4109–4123.. [DOI] [PubMed] [Google Scholar]
- Frijns J. H., Dekker D. M., Briaire J. J. Neural excitation patterns induced by phased-array stimulation in the implanted human cochlea. Acta Otolaryngol, 2011). 131, 362–370.. [DOI] [PubMed] [Google Scholar]
- Fu Q. J., Galvin J. J., 3rd Perceptual learning and auditory training in cochlear implant recipients. Trends Amplif, 2007). 11, 193–205.. [DOI] [PMC free article] [PubMed] [Google Scholar]
- Fu Q. J., Shannon R. V., Galvin J. J., 3rd Perceptual learning following changes in the frequency-to-electrode assignment with the Nucleus-22 cochlear implant. J Acoust Soc Am, 2002). 112, 1664–1674.. [DOI] [PubMed] [Google Scholar]
- Garadat S. N., Zwolan T. A., Pfingst B. E. Using temporal modulation sensitivity to select stimulation sites for processor MAPs in cochlear implant listeners. Audiol Neurootol, 2013). 18, 247–260.. [DOI] [PMC free article] [PubMed] [Google Scholar]
- Goldwyn J. H., Bierer S. M., Bierer J. A. Modeling the electrode-neuron interface of cochlear implants: Effects of neural survival, electrode placement, and the partial tripolar configuration. Hear Res, 2010). 268, 93–104.. [DOI] [PMC free article] [PubMed] [Google Scholar]
- Jones G. J., Drennan W. R., Rubinstein J. T. Relationship between channel interaction and spectral-ripple discrimination in cochlear implant users. J Acoust Soc Am, 2013). 133, 425–33.. [DOI] [PMC free article] [PubMed] [Google Scholar]
- Landsberger D. M., Padilla M., Srinivasan A. G. Reducing current spread using current focusing in cochlear implant users. Hear Res, 2012). 284, 16–24.. [DOI] [PMC free article] [PubMed] [Google Scholar]
- Litvak L. M., Spahr A. J., Emadi G. Loudness growth observed under partially tripolar stimulation: Model and data from cochlear implant listeners. J Acoust Soc Am, 2007). 122, 967–981.. [DOI] [PubMed] [Google Scholar]
- Long C. J., Holden T. A., McClelland G. H., et al. Examining the electro-neural interface of cochlear implant users using psychophysics, CT scans, and speech understanding. J Assoc Res Otolaryngol, 2014). 15, 293–304.. [DOI] [PMC free article] [PubMed] [Google Scholar]
- Mens L. H., Berenstein C. K. Speech perception with mono- and quadrupolar electrode configurations: A crossover study. Otol Neurotol, 2005). 26, 957–964.. [DOI] [PubMed] [Google Scholar]
- Nadol J. B., Jr Patterns of neural degeneration in the human cochlea and auditory nerve: Implications for cochlear implantation. Otolaryngol Head Neck Surg, 1997). 117(3 Pt 1), 220–228.. [DOI] [PubMed] [Google Scholar]
- Nelson D. A., Donaldson G. S., Kreft H. Forward-masked spatial tuning curves in cochlear implant users. J Acoust Soc Am, 2008). 123, 1522–1543.. [DOI] [PMC free article] [PubMed] [Google Scholar]
- Noble J. H., Gifford R. H., Hedley-Williams A. J., et al. Clinical evaluation of an image-guided cochlear implant programming strategy. Audiol Neurootol, 2014). 19, 400–411.. [DOI] [PMC free article] [PubMed] [Google Scholar]
- Nogueira W., Litvak L. M., Landsberger D. M., et al. Loudness and pitch perception using dynamically compensated virtual channels. Hear Res, 2017). 344, 223–234.. [DOI] [PMC free article] [PubMed] [Google Scholar]
- Padilla M., Landsberger D. M. Loudness summation using focused and unfocused electrical stimulation. J Acoust Soc Am, 2014). 135, EL102–EL108.. [DOI] [PMC free article] [PubMed] [Google Scholar]
- Padilla M., Landsberger D. M. Reduction in spread of excitation from current focusing at multiple cochlear locations in cochlear implant users. Hear Res, 2016). 333, 98–107.. [DOI] [PMC free article] [PubMed] [Google Scholar]
- R Core Team (R: A language and environment for statistical computing. R Foundation for Statistical Computing, 2012). Vienna, Austria. ISBN [Google Scholar]
- Shannon R. V. A model of safe levels for electrical stimulation. IEEE Trans Biomed Eng, 1992). 39, 424–426.. [DOI] [PubMed] [Google Scholar]
- Smith Z. M., Parkinson W. S., Long C. J. Multipolar current focusing increases spectral resolution in cochlear implants. Conf Proc IEEE Eng Med Biol Soc, 2013). 2013, 2796–2799.. [DOI] [PubMed] [Google Scholar]
- Spahr A. J., Dorman M. F., Litvak L. M., et al. Development and validation of the AzBio sentence lists. Ear Hear, 2012). 33, 112–117.. [DOI] [PMC free article] [PubMed] [Google Scholar]
- Srinivasan A. G., Padilla M., Shannon R. V., et al. Improving speech perception in noise with current focusing in cochlear implant users. Hear Res, 2013). 299, 29–36.. [DOI] [PMC free article] [PubMed] [Google Scholar]
- Studebaker G. A. A “rationalized” arcsine transform. J Speech Hear Res, 1985). 28, 455–462.. [DOI] [PubMed] [Google Scholar]
- Zhou N. Monopolar detection thresholds predict spatial selectivity of neural excitation in cochlear implants: Implications for speech recognition. PLoS One, 2016). 11, e0165476. [DOI] [PMC free article] [PubMed] [Google Scholar]


