Abstract
Oral squamous cell carcinoma (OSCC) remains to be a global health problem. However, the underlying molecular mechanisms regulating the oral leukoplakia (OLK) to OSCC remain poorly known. MicroRNAs (miRNAs) expression profiles of GSE33299 and GSE62809 were downloaded from gene expression omnibus (GEO) respectively. R software and bioconductor packages were used to compare and identify the differentially expressed miRNAs between OLK tissues and OLK transformed OSCC (OLK-OSCC). The target genes of commonly changed miRNAs were then subjected to gene ontology (GO) enrichment analysis, pathway analysis and miRNA-target genes network analysis. The prediction power of commonly changed miRNAs was further tested in an independent cohort. In total, 161 (88 upregulated and 73 downregulated) and 68 (19 upregulated and 49 downregulated) markedly altered miRNAs were identified from GSE33299 and GSE62809 respectively. The downstream targets of these differentially expression miRNAs in the two cohorts shared many top enriched GO and KEGG pathways. A set of three miRNAs signature including miR-129-5p, miR-296-5p and miR-450b-5p was commonly changed in both GSE33299 and GSE62809. Functional analysis revealed that the downstream target genes of the miRNA signature were associates with transcriptional regulation, estrogen signaling pathway, p53 signaling pathway and RIG-I-like receptor signaling pathway. This three-gene signature was further successfully validated in another independent cohort. The expression levels of miR-129-5p and miR-296-5p were significantly downregulated in OLK-OSCC tissues compared to OLK tissues, while miR-450b-5p levels were higher in OLK-OSCC tissues. In addition, this three miRNAs signature could discriminate OLK from OLK-OSCC with high accuracy. In conclusion, our study has identified a three miRNAs signature that might help predict the transformation of OLK to OSCC. Which will provide useful guidance for therapeutic applications.
Keywords: Functional analysis, MicroRNAs, oral leukoplakia, oral squamous cell carcinoma
Introduction
Head and neck squamous cell carcinoma (HNSC) is the sixth leading cancer and oral squamous cell carcinoma (OSCC) represents about 90% of all oral neoplasms [1,2]. A combination of genetic alterations, environmental risk factors and viral infection might give rise to this malignant condition. Despite great therapeutic advances have been made in the past few decades, the five-year overall survival rate for OSCC is stagnant at 50% [3]. The major reason for the poor prognosis of OSCC is that most cases are asymptomatic and diagnosed at advanced stage. This highlights the importance of developing reliable biomarkers for early detection of this deadly disease.
Oral leukoplakia (OLK) is an uncharacterized pathological condition with a plaque or white patch in the buccal mucosa, alveolar mucosa, or/and lower lip [4]. The characteristic histologic findings of OLK include, but are not limited to, epithelial hyperplasia, and/or hyperkeratosis, with or without epithelial dysplasia or carcinoma [5]. It is one of the most common oral precancerous lesions and may transform into OSCC. However, the underlying molecular mechanisms responsible for the progression of OLK to OLK associated OSCC (OLK-OSCC) remain poorly known.
MicroRNAs (miRNAs) are a class of endogenous single-stranded non-coding RNAs with approximately 19-25 nucleotides in length [6]. They negatively regulate gene expression by partial complementary binding to the 3’untranslated region (UTR) of target mRNAs. These small molecules play critical roles in many important cellular processes such as proliferation, differentiation, survival and apoptosis. Compelling evidences have demonstrated that miRNA expression is deregulated in human cancer [7]. MiRNAs may function as either oncogenes or tumor suppressors during cancer development [8].
In this study, we first compared the common differentially expressed miRNAs between OLK and OLK-OSCC from different GEO studies and identified a three-miRNA signature. Gene ontology (GO) function and pathway enrichment analysis as well as miRNA-target genes network analysis were performed. This robust of miRNA signature for discriminating OLK from OLK-OSCC was successfully validated in another independent cohort of patients.
Materials and methods
Data source
The original datasets comparing the gene expression profiles between OLK and OLK-OSCC were downloaded from NCBI GEO databases. The accession number was GSE33299 and GSE62809 respectively. The microarray data of GSE33299 was based on GPL14801 (Exiqon custom Homo sapiens miRNA array, Exiqon, Woburn, MA, USA). The RNA-seq data of GSE62809 was based on GPL16791 (Illumina HiSeq 2500, Illumina Inc, San Diego, CA, USA).
Data pre-processing and differential expression analysis
For GSE33299 microarray data, robust multi-array average (RMA) approach was performed for background correction and normalization. Affy R package was used to convert the original GEO data into expression measures. Limma R package was then employed for identifying differentially expressed miRNAs. For GSE62809 RNA-seq data, edgeR package was used for screening differentially expressed miRNAs. P < 0.05 and absolute log2FC > 0.5 were chosen as the cut-off criteria based on Benjamini & Hochberg (BH) procedure. Heatmaps of differentially expressed miRNAs between OLK and OLK-OSCC were generated in pheatmap R package with z-score normalization within each row (gene).
Gene ontology enrichment analysis
Gene Ontology and KEGG pathway enrichment analyses were performed using the Database for Annotation, Visualization and Integrated Discovery (DAVID) bioinformatics resource (https://david-d.ncifcrf.gov/). The enriched biological processes (BP), cellular component (CC) and molecular function (MF) as well as KEGG pathway were obtained to analyze the target genes of differentially expressed miRNAs as well as the miRNA signature at the functional level. P < 0.05 was set as the threshold value.
MiRNA-target genes network construction
The validated target genes of miR-129-5p, miR-296-5p and miR-450b-5p was first downloaded from miRWalk2.0 (http://zmf.umm.uni-heidelberg.de/apps/zmf/mirwalk2/). Then Cytoscape software (http://www.cytoscape.org/) was employed for constructing and visualizing the interacting network between interested miRNAs and their downstream targets.
Patient cohort
The validation study was approved by the Ethic Committee of the Stomatological Hospital, Southern Medical University. The study specimens comprised of 70 archival cases, of which 15 cases were healthy controls. 30 cases were OLK and 25 cases were OLK-OSCC. The patients in the OLK group and OLK-OSCC group were age and sex-matched and pathologically confirmed diagnosis. Written informed consent was obtained from all the participants for the use of their tissue specimens.
Real-time PCR
Total RNA was extracted from tissues using an RNA purification kit (Quick-RNA MicroPrep, Zymo Research Corp., Irvine, CA, USA) following manufacturer’s protocol. First-strand complementary DNA synthesis was performed using the SuperScript III Reverse Transcriptase (Invitrogen, Carlsbad, CA, USA). The cDNAs were then amplified with Light Cycler 480@SYBR Green I Master Mix (Roche, Applied Science, Indianapolis, IN, USA) using the CFX96 Real-Time PCR detection system (Bio-Rad Laboratories Inc., Hercules, CA, USA). U6 was used as an endogenous control and the 2-ΔΔCt method was employed to calculate relative expression levels of miRNAs. Real-time PCR reactions were performed in triplicate.
Statistical analysis
Data analysis was performed with the GraphPad Prism 7.0 (GraphPad, San Diego, CA, USA) and MedCalc software (MedCalc, Ostend, Belgium). One-way ANOVA was performed to compare the expression levels of the miRNA signature (miR-129-5p, miR-296-5p and miR-450b-5p) among healthy control, OLK and OLK-OSCC in the validation cohort. Receiver operating characteristic (ROC) analysis was used to estimate the performance of the interested miRNA signature and evaluate if combining biomarkers improves sensitivity and specificity for predicting the transformation of OLK to OLK-OSCC. All statistical tests were two-sided. A P value of less than 05 was considered statistically significant.
Results
The differentially expressed miRNAs in GSE33299 and GSE62809
Volcano plots were generated to visualize the distribution of expressed miRNAs between OLK and OLK-OSCC. Red or green dots in the plots represented significantly upregulated or downregulated miRNAs respectively (Figure 1). In total, 161 (88 upregulated and 73 downregulated) and 68 (19 upregulated and 49 downregulated) markedly altered miRNAs were identified from GSE33299 and GSE62809 respectively. The detailed information of the changed miRNAs was summarized in Supplementary Data. Three miRNAs (miR-129-5p, miR-296-5p and miR-450b-5p) were commonly upregulated or downregulated in these two independent cohorts.
Figure 1.
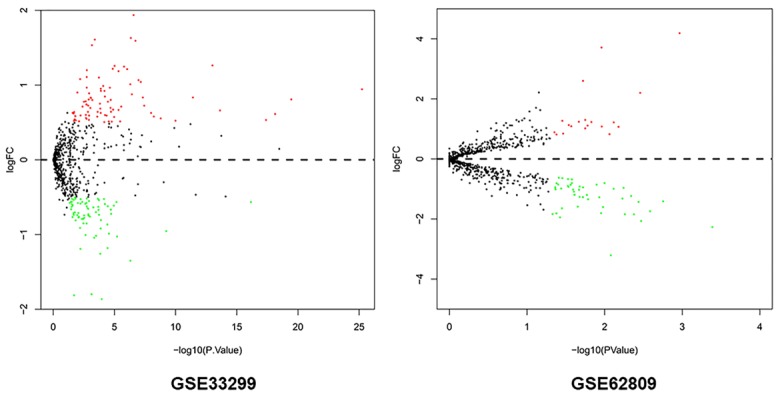
Volcano plots of miRNAs between OLK-OSCC tissues and OLK tissues. X-axis indicates the p values (log-scaled), whereas the Y-axis shows the fold change (log-scaled). Each symbol represents a different miRNA, and the red/green color of the symbols categorize the upregulated/downregulated miRNAs.
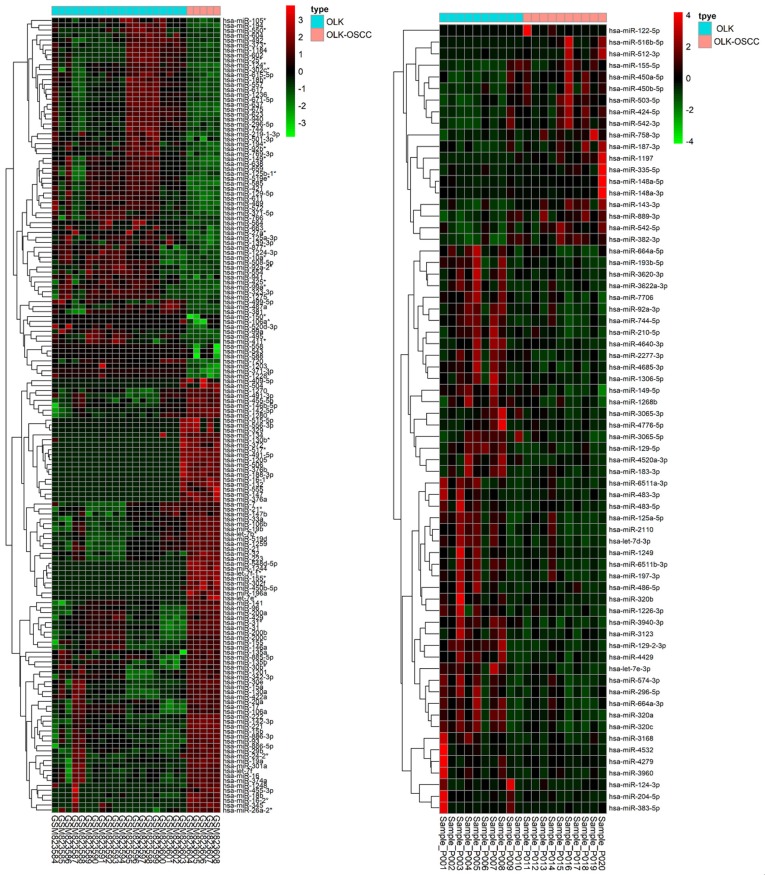
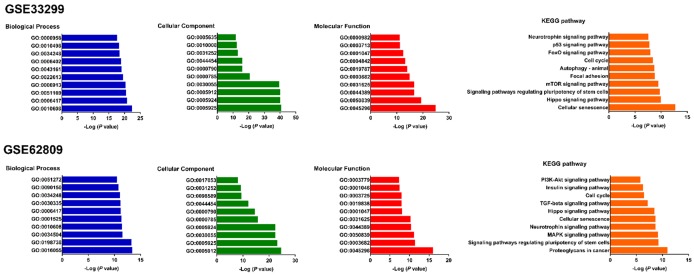
Heat maps were generated with R based on the expression levels of differentially expressed miRNAs in GSE33299 and GSE62809. Each column represented a biological sample and each row in the heat map represents a miRNA. The color indicated the relative expression levels of miRNA in tissue specimens (Figure 2). Gene Ontology and KEGG pathway enrichment analysis of the target genes of differentially expressed miRNAs were performed using the DAVID. A total of 9001 and 8611 downstream target genes were identified in GSE33299 and GSE62809 respectively. Surprisingly, our results showed that many top enriched GO and KEGG pathways overlapped between the two cohorts. For instance, cellular senescence, Hippo signaling pathway, cell cycle, neurotrophin signaling pathway and signaling pathways regulating pluripotency of stem cells were found in the top ten enriched KEGG pathways of both cohorts. Posttranscriptional regulation of gene expression (GO: 0010608) and regulation of cellular amide metabolic process (GO: 0034248) are the top overlapped BP between the two cohorts. Adherens junction (GO: 0005912), focal adhesion (GO: 0005925), cell-substrate junction (GO: 0030055), cell-substrate adherens junction (GO: 0005924), chromatin (GO: 0000785), nuclear chromatin (GO: 0000790), nuclear chromosome part (GO: 0044454) and cell leading edge (GO: 0031252) are the top shared CC between GSE33299 and GSE62809. Cadherin binding (GO: 0045296), chromatin binding (GO: 0050839), ubiquitin-like protein ligase (GO: 0044389), ubiquitin protein ligase binding (GO: 0031625), chromatin binding (GO: 0003682) and core promoter binding (GO: 0001047) are shared between the two cohorts in the top ten MF (Figure 3).
Figure 2.
Heatmaps of the significantly differentially expressed miRNAs between OLK-OSCC tissues and OLK tissues.
Figure 3.
Gene ontology and KEGG analyses of the target genes of the differentially expressed miRNAs in GSE33299 and GSE62809.
The commonly changed miRNAs between GSE33299 and GSE62809
As shown in Figure 4, the expression levels of miR-129-5p and miR-296-5p were both significantly downregulated in OLK-OSCC tissues compared to OLK tissues in GSE33299 and GSE62809 (P < 0.05). However, miR-450b-5p levels were remarkably increased in OLK-OSCC tissues (P < 0.05).
Figure 4.
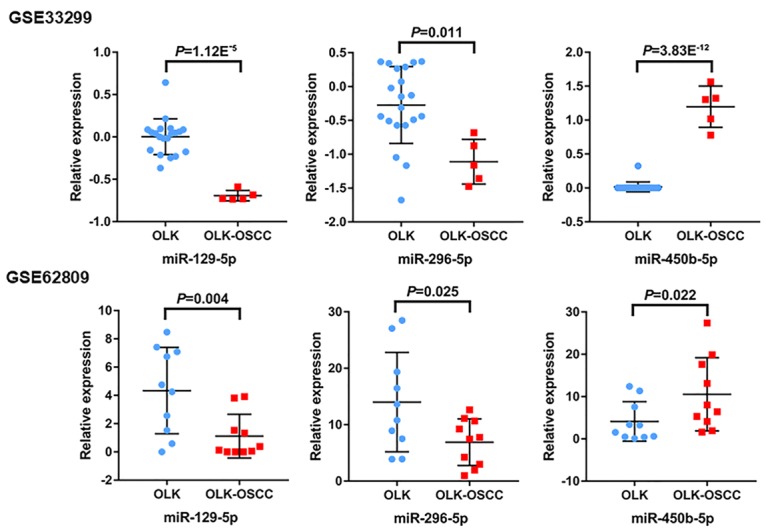
A set of commonly changed miRNA (miR-129-5p, miR-296-5p and miR-450b-5p) in both GEO studies were identified. The miR-129-5p and miR-296-5p levels were downregulated, while miR-450b-5p levels were upregulated in OLK-OSCC tissues compared to OLK tissues.
Functional analysis of the target genes of the miRNA signature
DAVID was used to analyze the downstream target genes of the three miRNAs signature. For the “biological processes (BP)”, regulation of transcription, DNA-templated (GO: 0006355), positive regulation of transcription by RNA polymerase II (GO: 0045944), positive regulation of protein dephosphorylation (GO: 0035307), endothelial cell proliferation (GO: 0001935) and transcription from RNA polymerase II promoter (GO: 0006366) were the commonly enriched categories. For the “cellular component (CC)” ontology, enriched categories were correlated with cytoplasm (GO: 0005737), nucleus (GO: 0005634), Golgi apparatus (GO: 0005794), nucleoplasm (GO: 0005654) and membrane (GO: 0016020). With regards to the “molecular function (MF)”, the target genes mainly showed enrichment in protein binding (GO: 0005515), single-stranded RNA binding (GO: 0003727), transcription factor activity, sequence-specific DNA binding (GO: 0003700), nucleic acid binding (GO: 0003676) and sequence-specific DNA binding (GO: 0043565) (Figure 5A). KEGG pathway showed that the top canonical pathways associated with target genes were estrogen signaling pathway, spliceosome, p53 signaling pathway, GnRH signaling pathway and RIG-I-like receptor signaling pathway (Figure 5B).
Figure 5.
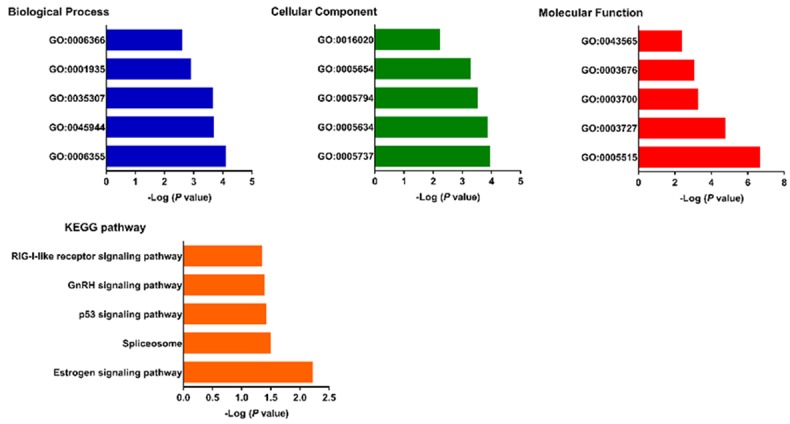
Gene ontology and KEGG analyses of the target genes of the three miRNAs signature.
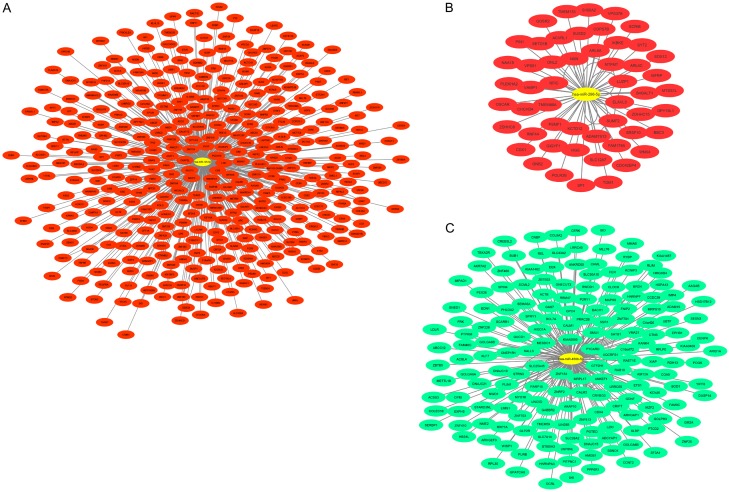
The miRNA-target genes network of constructed by using the miRWalk2.0 and Cytoscape (Figure 6). The yellow color indicated the central nodes namely miR-129-5p, miR-296-5p and miR-450b-5p. The red color indicates the potential upregulated genes during transformation of OLK to OSCC, while the green color indicates the potential downregulated genes when OLK progresses into OSCC.
Figure 6.
MiRNA-target genes interaction network of the target genes of the three miRNAs signature. The yellow color represented the miRNAs. Red color and green color indicated the upregulated and downregulated target genes respectively.
The potential clinical utility of the three miRNAs signature for predicting the transformation of OLK to OLK-OSCC
We then examined the expression levels of the three miRNAs signature in tissue samples from 15 healthy controls, 30 OLK patients and 25 OLK-OSCC patients. Figure 7 showed the expression level of miR-129-5p was remarkably lower in OLK-OSCC tissues compared with those in OLK tissues (P = 0.0041) and healthy control (HC) tissues (P < 0.0001). Similarly, miR-296-5p were significantly decreased in OLK-OSCC tissues compared to those in OLK tissues (P = 0.0014) and healthy control (HC) tissues (P = 0.0002). No significance was found between OLK tissues and HC tissues for miR-129-5p and miR-296-5p levels. However, the miR-450b-5p levels were significantly higher in OLK-OSCC tissues compared to OLK (P = 0.0007) and HC tissues (P < 0.0001). The expression level of miR-450b was lower in HC tissues in comparison with OLK tissues (P = 0.0460).
Figure 7.
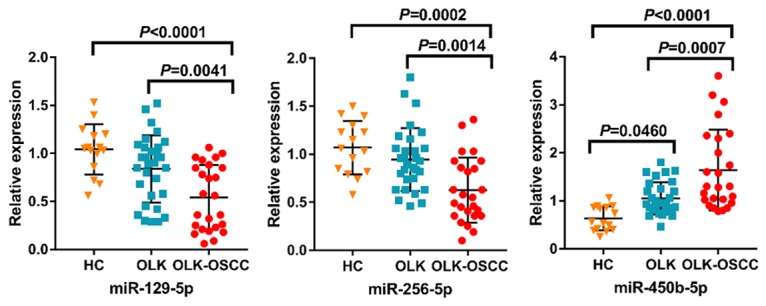
In the validation study, our results showed that the expression level of miR-129-5p were remarkably lower in OLK-OSCC tissues compared with those in OLK tissues (P = 0.0041) and healthy control (HC) tissues (P < 0.0001). Similarly, miR-296-5p were significantly decreased in OLK-OSCC tissues compared to those in OLK tissues (P = 0.0014) and healthy control (HC) tissues (P = 0.0002). No significance was found between OLK tissues and HC tissues for miR-129-5p and miR-296-5p levels. However, the miR-450b-5p levels were significantly higher in OLK-OSCC tissues compared to OLK (P = 0.0007) and HC tissues (P < 0.0001). The expression level of miR-450b was lower in HC tissues in comparison with OLK tissues (P = 0.0460).
As shown in Figure 8, the ROC analysis was performed to evaluate pre-clinical utility of these potential biomarkers and to assess if combining biomarkers may improve the sensitivity and specificity. For discriminating OLK from OLK-OSCC, the AUC values of miR-129-5p, miR-296-5p and miR-450b-5p were 0.730 (95% CI = 0.593-0.841), 0.759 (95% CI = 0.625-0.864) and 0.721 (95% CI = 0.584-0.834), respectively. In addition, the combination of these three miRNAs signature yielded a better AUC value of 0.872 (95% CI = 0.754-0.947) in distinguishing patients with OLK from patients with OLK-OSCC.
Figure 8.
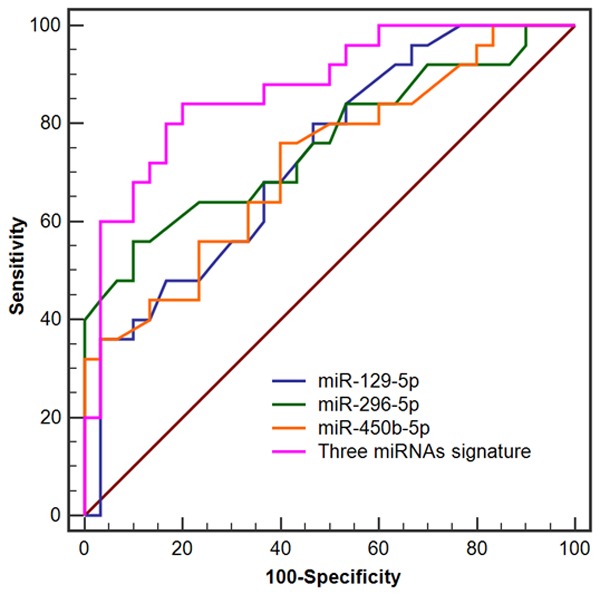
Receiver operating characteristic (ROC) analysis of the three potential miRNAs signature for discriminating OLK from OLK-OSCC.
Discussion
Oral carcinogenesis is a multistep process characterized by genetic alterations leading the cells to proliferate in an uncontrolled way [9]. To date, the underlying molecular mechanisms accounting for the progression of oral pre-cancer to cancer are poorly understood. Multiple types of oral precancerous lesions including, but not limited to, OLK, OLP, oral submucous fibrosis, oral erythroplakia and actinic cheilitis, may develop to OSCC at different conversion rate [10].
In this study, we first screened significantly changed miRNAs between OLK and OLK-OSCC from two independent GEO studies. Interestingly, the downstream targets of these differentially expressed miRNAs in the two cohorts shared many top enriched GO and KEGG pathways, indicating the overlapped GO and KEGG pathways might play an important role in the transformation of OLK to OSCC. A set of commonly deregulated three miRNA signatures including miR-129-5p, miR-296-5p and miR-450b-5p were identified. The potential reasons for most hits from both datasets did not overlap with each other are as follows: Firstly, there are an estimated 20,000-25,000 human protein-coding genes, while only around 2000 miRNAs found so far. Thus, the number of miRNAs itself is relatively small. In addition, it is difficult to include all the miRNAs in the microarray studies. For instance, there were totally 1341 miRNAs in the GSE33299. Therefore, the design of microarray might have influence on the shared miRNAs between these two cohorts. Secondly, the sample size in both studies were small, which might have great impact on the miRNAs expression profile between two cohorts. Increasing the sample size might contribute to screen more common miRNAs. Thirdly, the difference in race between both cohorts might also have influence on miRNAs expression profile. Also, to the best of our knowledge, it is quite common to observe the phenomenon that no shared gene was found among different comparable microarrays. Functional analyses demonstrated that the target genes of these miRNAs might be associated with loss of tumor suppressive signaling and activation of cancer promoting pathways. In addition, this three miRNAs signature was further successfully validated for predicting the transformation of OLK to OLK-OSCC in another independent cohort. Moreover, combining the three miRNAs signature was able to discriminate OLK from OLK-OSCC with high accuracy, suggesting that it might be promising for early detection of OLK related OSCC. One potential limitation of our current study is that the sample size of the validation cohort is small. It might take long period for oral precancerous lesion to progress into cancer. Therefore, it is difficult to obtain large sample size of OLK-OSCC tissue specimens. Future large-scale studies are needed for further testing this miRNAs signature.
The target genes of miR-129-5p, miR-296-5p and miR-450b-5p was identified using miRWalk2.0. The miRWalk2.0 was chosen because it contains information about experimentally validated interaction [11]. Based on GO and KEGG enrichment analyses of the target genes of the miRNAs signature, “regulation of transcription, DNA-templated” has the highest enrichment score in the “biological process” category. Other biological processes such as positive regulation of transcription by RNA polymerase II and transcription from RNA polymerase II promoter were also enriched. Deregulation of transcription may result in inappropriate activation of positively acting transcription factors and as well as loss of tumor suppressors. For the “cellular component” category and “molecular function (MF)” category, “cytoplasm” and “protein binding” showed the highest enrichment score respectively. For the KEGG analysis, the canonical pathways associated with target genes were estrogen signaling pathway, p53 signaling pathway and RIG-I-like receptor (RLRs) signaling pathway. Estrogen receptor and TP53 have been shown to play an important role in the development and progression of OSCC [12,13]. RlRs receptors are crucial in the host defense to numerous viral pathogens and HPV virus infection is an important risk factor of OSCC [14,15], thus it is no wonder to observe the pathway was deregulated.
MiRNAs have been found to be necessary for regulating virtually all signaling pathways within a cell, and their dysregulation plays an essential role in the initiation and progression of cancer [16]. Our results showed that the levels of miR-129-5p and miR-296-5p were downregulated in OLK-OSCC tissues compared to OLK tissues, suggesting that they might function as a tumor suppressor in oral carcinogenesis. Interestingly, the expression levels of miR-129-5p and miR-296-5p in normal tissues were both slightly higher than those in OLK tissues. Although the P value was larger than 0.05 due to the small sample size, we can still observe the trend that miR-129-5p and miR-296-5p decreased gradually from healthy controls, OLK to OLK-OSCC. For miR-450b-5p, its level in normal tissues was significantly lower than that in OLK and OSCC. Future studies with larger cohorts are needed to validate our findings. Also, this highlights the importance combination of several biomarkers for predicting the transformation of OLK to OLK-OSCC. Consistent with our findings, miR-129-5p is one of the three mature forms of miR-129 and reduced miR-129-5p levels have been reported in many types of cancers. For instance, the expression level of miR-129-5p was significantly downregulated in medullary thyroid carcinoma tissues and cell lines. In addition, miR-129-5p overexpression inhibited the oncogenic behaviors of cancer cells through decreasing the phosphorylated AKT, indicating miR-129-5p might play a tumor suppressive role in medullary thyroid carcinoma [17]. Similarly, miR-129-5p expression was remarkably reduced in both lung cancer cell lines and lung cancer tissues. Ectopic expression of miR-129-5p suppressed the proliferation and invasion capability of lung cancer cells by targeting microspherule protein 1, E-cadherin and vimentin [18]. Overexpression of miR-296 significantly reduced the proliferation and invasion capacity of prostate cancer cells by suppressing HMGA1 [19]. MiR-296-5p levels were consistently decreased in human breast cancer tissues in comparison with adjacent normal tissues, and reduced miR-296-5p was closely associated with poor prognosis [20]. The levels of miR-450b-5p was remarkably increased in OLK-OSCC tissues compared with OLK tissues, indicating that miR-450b-5p played an oncogenic role in the development of oral cancer. Similar to our results, miR-450b-5p was up-regulated in colorectal cancer tissues and high miR-450b-5p levels were correlated with adverse prognosis [21]. Further experiments are required to elucidate the concrete role of these miRNAs in the tumorigenesis of oral epithelial cells.
In conclusion, our study has profiled and validated consistently changed miRNA between OLK and OLK-OSCC, which might play critical roles in the development of OLK to OSCC. These novel biomarkers not only might help diagnose OSCC at the very early stage, but also might contribute to stratify the OLK patients with low risk and high risk for progression into OSCC, which will provide important guidance for personalized and precision therapy.
Acknowledgements
The study was supported by the grant from Stomatological Hospital, Southern Medical University (B2014411) and Natural Science Foundation of Guangdong Province (2016A030310176).
Disclosure of conflict of interest
None.
Supporting Information
References
- 1.Zhao X, Sun S, Zeng X, Cui L. Expression profiles analysis identifies a novel three-mRNA signature to predict overall survival in oral squamous cell carcinoma. Am J Cancer Res. 2018;8:450–61. [PMC free article] [PubMed] [Google Scholar]
- 2.Cui L, Cheng S, Liu X, Messadi D, Yang Y, Hu S. Syntenin-1 is a promoter and prognostic marker of head and neck squamous cell carcinoma invasion and metastasis. Oncotarget. 2016;7:82634–47. doi: 10.18632/oncotarget.13020. [DOI] [PMC free article] [PubMed] [Google Scholar]
- 3.Fuller CD, Wang SJ, Thomas CR Jr, Hoffman HT, Weber RS, Rosenthal DI. Conditional survival in head and neck squamous cell carcinoma: results from the SEER dataset 1973-1998. Cancer. 2007;109:1331–43. doi: 10.1002/cncr.22563. [DOI] [PubMed] [Google Scholar]
- 4.Rai V, Mukherjee R, Ghosh AK, Routray A, Chakraborty C. “Omics” in oral cancer: new approaches for biomarker discovery. Arch Oral Biol. 2018;87:15–34. doi: 10.1016/j.archoralbio.2017.12.003. [DOI] [PubMed] [Google Scholar]
- 5.Wu L, Feng J, Shi L, Shen X, Liu W, Zhou Z. Candidal infection in oral leukoplakia: a clinicopathologic study of 396 patients from eastern China. Ann Diagn Pathol. 2013;17:37–40. doi: 10.1016/j.anndiagpath.2012.05.002. [DOI] [PubMed] [Google Scholar]
- 6.Ambros V. microRNAs: tiny regulators with great potential. Cell. 2001;107:823–6. doi: 10.1016/s0092-8674(01)00616-x. [DOI] [PubMed] [Google Scholar]
- 7.Lee YS, Dutta A. MicroRNAs in cancer. Annu Rev Pathol. 2009;4:199–227. doi: 10.1146/annurev.pathol.4.110807.092222. [DOI] [PMC free article] [PubMed] [Google Scholar]
- 8.Zhang B, Pan X, Cobb GP, Anderson TA. microRNAs as oncogenes and tumor suppressors. Dev Biol. 2007;302:1–12. doi: 10.1016/j.ydbio.2006.08.028. [DOI] [PubMed] [Google Scholar]
- 9.Williams HK. Molecular pathogenesis of oral squamous carcinoma. Mol Pathol. 2000;53:165–72. doi: 10.1136/mp.53.4.165. [DOI] [PMC free article] [PubMed] [Google Scholar]
- 10.Liu Y, Cui L, Huang J, Ji EH, Chen W, Messadi D, Hu S. SOX4 promotes progression in OLP-associated squamous cell carcinoma. J Cancer. 2016;7:1534–40. doi: 10.7150/jca.15689. [DOI] [PMC free article] [PubMed] [Google Scholar]
- 11.Dweep H, Gretz N. miRWalk2.0: a comprehensive atlas of microRNA-target interactions. Nat Methods. 2015;12:697. doi: 10.1038/nmeth.3485. [DOI] [PubMed] [Google Scholar]
- 12.Chang YL, Hsu YK, Wu TF, Huang CM, Liou LY, Chiu YW, Hsiao YH, Luo FJ, Yuan TC. Regulation of estrogen receptor α function in oral squamous cell carcinoma cells by FAK signaling. Endocr Relat Cancer. 2014;21:555–65. doi: 10.1530/ERC-14-0102. [DOI] [PubMed] [Google Scholar]
- 13.Sinevici N, O’sullivan J. Oral cancer: deregulated molecular events and their use as biomarkers. Oral Oncol. 2016;61:12–8. doi: 10.1016/j.oraloncology.2016.07.013. [DOI] [PubMed] [Google Scholar]
- 14.Loo YM, Gale M Jr. Immune signaling by RIG-I-like receptors. Immunity. 2011;34:680–92. doi: 10.1016/j.immuni.2011.05.003. [DOI] [PMC free article] [PubMed] [Google Scholar]
- 15.Ha PK, Califano JA. The role of human papillomavirus in oral carcinogenesis. Crit Rev Oral Biol Med. 2004;15:188–96. doi: 10.1177/154411130401500402. [DOI] [PubMed] [Google Scholar]
- 16.Min A, Zhu C, Peng S, Rajthala S, Costea DE, Sapkota D. MicroRNAs as important players and biomarkers in oral carcinogenesis. Biomed Res Int. 2015;2015:186904. doi: 10.1155/2015/186904. [DOI] [PMC free article] [PubMed] [Google Scholar]
- 17.Duan L, Hao X, Liu Z, Zhang Y, Zhang G. MiR-129-5p is down-regulated and involved in the growth, apoptosis and migration of medullary thyroid carcinoma cells through targeting RET. FEBS Lett. 2014;588:1644–51. doi: 10.1016/j.febslet.2014.03.002. [DOI] [PubMed] [Google Scholar]
- 18.Zhang Y, An J, Lv W, Lou T, Liu Y, Kang W. miRNA-129-5p suppresses cell proliferation and invasion in lung cancer by targeting microspherule protein 1, E-cadherin and vimentin. Oncol Lett. 2016;12:5163–9. doi: 10.3892/ol.2016.5372. [DOI] [PMC free article] [PubMed] [Google Scholar]
- 19.Wei JJ, Wu X, Peng Y, Shi G, Basturk O, Yang X, Daniels G, Osman I, Ouyang J, Hernando E, Pellicer A, Rhim JS, Melamed J, Lee P. Regulation of HMGA1 expression by microRNA-296 affects prostate cancer growth and invasion. Clin Cancer Res. 2011;17:1297–305. doi: 10.1158/1078-0432.CCR-10-0993. [DOI] [PMC free article] [PubMed] [Google Scholar]
- 20.Savi F, Forno I, Faversani A, Luciani A, Caldiera S, Gatti S, Foa P, Ricca D, Bulfamante G, Vaira V, Bosari S. miR-296/Scribble axis is deregulated in human breast cancer and miR-296 restoration reduces tumour growth in vivo. Clin Sci (Lond) 2014;127:233–42. doi: 10.1042/CS20130580. [DOI] [PubMed] [Google Scholar]
- 21.Ye YP, Wu P, Gu CC, Deng DL, Jiao HL, Li TT, Wang SY, Wang YX, Xiao ZY, Wei WT, Chen YR, Qiu JF, Yang RW, Lin J, Liang L, Liao WT, Ding YQ. miR-450b-5p induced by oncogenic KRAS is required for colorectal cancer progression. Oncotarget. 2016;7:61312–24. doi: 10.18632/oncotarget.11016. [DOI] [PMC free article] [PubMed] [Google Scholar]
Associated Data
This section collects any data citations, data availability statements, or supplementary materials included in this article.


