Abstract
The significance of prognosis of follicular thyroid cancer (FTC) compared to other subtypes of thyroid cancer, based on large cohort data has only been addressed in a few studies, and the results remain controversial. In this study, we investigated the prognosis of FTC compared to papillary thyroid carcinoma (PTC) and follicular variant PTC (FVPTC) based on Surveillance, Epidemiology, and End Results database (SEER) Program data using propensity score matching. We evaluated data from 128,703 patients with thyroid cancer who were included in the SEER database between 2004 and 2013. Patient mortality was evaluated using Cox proportional hazards regression analyses and Kaplan-Meier analyses with log-rank tests. The average prognosis of FTC was poorer than both PTC and FVPTC. The multivariate Cox regression analysis revealed that the cancer-specific survival rate for FTC was lower than that for PTC and FVPTC without adjusting for risk factors. Furthermore, after propensity score matching analysis for relevant factors, the cancer-specific mortality rate for FTC was higher than that for PTC and FVPTC. These results based on a large population cohort database provide a benefit reference for individual and precise treatment and management of patients with FTC.
Keywords: Prognosis, follicular thyroid cancer, SEER, propensity score matching, cancer-specific survival
Introduction
The incidence of thyroid cancer has surged globally over the previous four decades [1-9]. Follicular thyroid cancer (FTC), which accounts for about 10% of all thyroid cancers, is the second most common thyroid cancer subtype after papillary thyroid cancer (PTC), which accounts for more than 80% of all thyroid cancer [2,10].
The importance of prognostic factors and prognostic classifications for predicting the survival of patients with PTC has been demonstrated extensively [2,11-14]. On the other hand, the prognosis of FTC, which has rather increased metastasis, recurrence compared to PTC has only been addressed by few studies and the outcome of such studies is rather controversial. In a recent review, Grani et al., 2017, suggested that FTC has a unique biological behavior with less favorable outcomes [10], which is in contrast to the other study that draws the opposite conclusion [15].
To further advance our understanding and significance of FTC prognosis, we investigated the prognosis of FTC compared to those of PTC and follicular variant PTC (FVPTC) by analyzing a cohort database from the Surveillance, Epidemiology, and End Results (SEER) Program using propensity score matching (PSM).
Materials and methods
Ethical considerations, study population and data collection
Our study’s retrospective protocol was approved by Zhongnan Hospital of Wuhan University’s ethical review board (approval number: 20131001PTMC) and complied with the ethical standards of the Declaration of Helsinki, as well as the relevant national and international guidelines.
The present study evaluated SEER data (2004-2013) from patients with thyroid cancer according to their subtype (FTC, PTC, and FVPTC) using code C73.9 from the International Classification of Diseases for Oncology (i.e., thyroid, papillary, and/or follicular histology). The eligible diagnostic codes were: “papillary carcinoma”, “papillary adenocarcinoma”, “follicular adenocarcinoma”, “papillary carcinoma, follicular variant”, and “papillary & follicular adenocarcinoma”. Cases without American Joint Committee on Cancer staging information (version 6) were excluded to ensure accurate analyses. Cases without information of follow up time were also excluded. The three histological subtypes were compared according to age, sex, race, TNM stage, multifocality, extension, radiation treatment (i.e., none or refused, external beam radiation therapy, or RAI) and surgical approaches (lobectomy, subtotal or near-total thyroidectomy and total thyroidectomy).
Statistical analyses
All included patients were followed-up until December 2013. The quantitative variables were expressed as mean ± standard deviation (SD), while the categorical ones were presented as percentages. Patient survival curves for thyroid cancer-specific mortality and all-cause mortality were examined by Kaplan-Meier analyses with the log-rank test. Cox proportional hazard regression analyses were using to estimate hazard ratios and 95% CIs, in order to quantify the effects of the different histological subtypes on cancer-specific and all-cause mortality. PSM was also used to further adjust for potential baseline confounding factors (demographic data, clinicopathological characteristics and treatment approaches). All p-values were 2-sided, and p-values <.05 were considered significant. Analyses were performed using SPSS version 23.0, Stata/SE version 12 (Stata Corp.), and GraphPad Prism version 6 (GraphPad Software Inc.).
Results
Demographic and clinical features
This study extracted and assessed data from 128,703 patients (PTC, n=92,963; FTC, n=5,865; FVPTC, n=29,875) with thyroid cancer. The patients’ mean age and follow-up duration according to different histological subtypes are shown in Table 1. Patients with FTC had longer follow up time compared to patients with PTC or FVPTC (both P<0.001).
Table 1.
Characteristics for Patients with different histological types
| Covariate | Level | Histological types | ||||
|---|---|---|---|---|---|---|
|
| ||||||
| FTC (n=5865) | PTC (n=92963) | P value | FVPTC (n=29875) | P value | ||
| Age (year) | 51.33±17.20 | 49.36±15.29 | <0.001 | 51.03±15.15 | 0.175 | |
| Sex | Female | 4137 (70.5%) | 71785 (77.2%) | <0.001 | 23269 (77.9%) | <0.001 |
| Male | 1728 (29.5%) | 21178 (22.8%) | 6606 (22.1%) | |||
| Race | White | 4529 (78.3%) | 76038 (82.9%) | <0.001 | 24512 (82.9%) | <0.001 |
| Black | 695 (12.0%) | 5704 (6.2%) | 2498 (8.5%) | |||
| Other | 558 (9.7%) | 9987 (10.9%) | 2546 (8.6%) | |||
| T stage | T1 | 1283 (23.8%) | 55606 (62.2%) | <0.001 | 16344 (60.7%) | <0.001 |
| T2 | 2174 (40.2%) | 13811 (15.5%) | 5342 (19.8%) | |||
| T3 | 1747 (32.4%) | 16407 (18.4%) | 4600 (17.1%) | |||
| T4 | 194 (3.6%) | 3463 (3.9%) | 662 (2.4%) | |||
| N-stage | N0 | 5370 (97.0%) | 69465 (79.0%) | <0.001 | 23581 (88.6%) | <0.001 |
| N1 | 168 (3.0%) | 18460 (21.0%) | 3030 (11.4%) | |||
| M-stage | M0 | 5377 (94.2%) | 89658 (98.8%) | <0.001 | 26846 (98.9%) | <0.001 |
| M1 | 329 (5.8%) | 1132 (1.2%) | 296 (1.1%) | |||
| Multifocality | No | 4735 (85.6%) | 52324 (58.3%) | <0.001 | 14747 (54.6%) | <0.001 |
| Yes | 797 (14.4%) | 37350 (41.7%) | 12264 (45.4%) | |||
| Extension | No | 5027 (88.9%) | 75994 (83.7%) | <0.001 | 24207 (88.6%) | 0.455 |
| Yes | 626 (11.1%) | 14847 (16.3%) | 3121 (11.4%) | |||
| Radiation | None or refused | 2573 (45.0%) | 46761 (51.5%) | <0.001 | 14734 (50.6%) | <0.001 |
| Radiation Beam or Rdioactive implants | 177 (3.1%) | 1705 (1.9%) | 611 (2.1%) | |||
| Radioisotopes or Radiation beam plus isotopes or implants | 2970 (51.9%) | 42296 (46.6%) | 13792 (47.3%) | |||
| Surgery | Lobectomy | 1300 (23.6%) | 12688 (14.2%) | <0.001 | 4803 (16.9%) | <0.001 |
| Subtotal or near-total thyroidectomy | 303 (5.5%) | 3337 (3.7%) | 1175 (4.1%) | |||
| Total thyroidectomy | 3911 (70.9%) | 73162 (82.1%) | 22456 (79.0%) | |||
| Survival months (month) | 53.12±34.33 | 49.09±33.76 | <0.001 | 49.92±34.86 | <0.001 | |
FTC: follicular thyroid cancer; PTC: papillary thyroid cancer; FVPTC: follicular variant papillary thyroid cancer.
Cancer-specific and all-cause mortality rates of different histological subtypes
During the follow-up period to December 2013, cancer-specific mortality was noted in 190 patients in the FTC group, 996 patients in the PTC group, and 510 patients in the FVPTC group. The cancer-specific mortality rates per 1,000 person-years for patients with FTC, PTC, and FVPTC were 6.509 (95% CI: 5.598-7.569), 2.403 (95% CI: 2.252-2.564), and 3.990 (95% CI: 3.654-4.357) respectively (Table 2). In addition, during the follow-up period, all-cause mortality was noted in 538 patients in the FTC group, 4,388 patients in the PTC group, and 2,779 patients in the FVPTC group. The all-cause mortality rates per 1,000 person-years for patients with FTC, PTC, and FVPTC were 19.337 (95% CI: 17.717-21.104), 11.068 (95% CI: 10.739-11.408), and 21.611 (95% CI: 20.809-22.444) respectively (Table 2).
Table 2.
Hazard Ratios of different histological types for the cancer specific deaths and all cause deaths of thyroid cancer
| Histological types | Cancer-Specific Deaths | % | Cancer-Specific Deaths per | 95% CI | All Cause Deaths | % | All Cause Deaths per | 95% CI |
|---|---|---|---|---|---|---|---|---|
|
|
|
|
|
|||||
| No. | 1,000 Person-Years | No. | 1,000 Person-Years | |||||
| FTC | 190 | 3.24 | 6.509 | 5.598-7.569 | 538 | 9.17 | 19.337 | 17.717-21.104 |
| PTC | 966 | 1.04 | 2.403 | 2.252-2.564 | 4388 | 4.72 | 11.068 | 10.739-11.408 |
| FVPTC | 510 | 1.71 | 3.990 | 3.654-4.357 | 2779 | 9.30 | 21.611 | 20.809-22.444 |
FTC: follicular thyroid cancer; PTC: papillary thyroid cancer; FVPTC: follicular variant papillary thyroid cancer.
Risk factors for cancer-specific and all-cause mortality rates
The univariate Cox regression analyses demonstrated that cancer-specific mortality was associated with significant risk factors such as age, sex, race, histological type, T/N/M stage, multifocality, tumor extension, radiation treatment, and surgical approach. The multivariate Cox regression model illustrated that PTC had a significant better cancer-specific survival with a hazard ratio of 0.573 (95% CI [0.451-0.727]) compared to FTC. Further, FVPTC also had a better cancer-specific survival with a hazard ratio of 0.482 (95% CI [0.361-0.644]) compared to FTC (Table 3). The univariate Cox regression analyses revealed that all-cause mortality was associated with age, race, sex, histological type, T/N/M stage and radiation treatment. The multivariate Cox regression model illustrated that PTC had a significant better cancer-specific survival with a hazard ratio of 0.8 (95% CI [0.708-0.904]) compared to FTC and a hazard ration of 0.801 (95% CI [0.702-0.914]) compared to but for FVPTC (Table 3).
Table 3.
Risk factors for survival: outcome of thyroid cancer specific mortality and all-cause mortality
| Covariate | Level | Thyroid Cancer specific mortality | All cause mortality | ||||||
|---|---|---|---|---|---|---|---|---|---|
|
| |||||||||
| Univariate Cox regression | Multivariate Cox regression | Univariate Cox regression | Multivariate Cox regression | ||||||
|
| |||||||||
| Hazard Ratio (95% CI) | p-value | Hazard Ratio (95% CI) | p-value | Hazard Ratio (95% CI) | p-value | Hazard Ratio (95% CI) | p-value | ||
| Age | 1.092 (1.088-1.096) | <0.001 | 1.069 (1.064-1.075) | <0.001 | 1.082 (1.080-1.084) | <0.001 | 1.078 (1.075-1.080) | <0.001 | |
| Sex | Female | Ref | Ref | Ref | Ref | ||||
| Male | 2.801 (2.543-3.085) | <0.001 | 1.510 (1.305-1.749) | <0.001 | 2.404 (2.297-2.516) | <0.001 | 1.683 (1.581-1.792) | <0.001 | |
| Race | White | Ref | Ref | Ref | Ref | ||||
| Black | 1.134 (0.942-1.365) | 0.185 | 1.220 (0.901-1.651) | 0.198 | 1.311 (1.211-1.419) | <0.001 | 1.472 (1.320-1.641) | <0.001 | |
| Other | 1.519 (1.322-1.744) | <0.001 | 0.925 (0.747-1.147) | 0.478 | 0.954 (0.882-1.030) | 0.230 | 0.790 (0.706-0.885) | <0.001 | |
| Histological types | FTC | Ref | Ref | Ref | Ref | ||||
| PTC | 0.341 (0.292-0.399) | <0.001 | 0.573 (0.451-0.727) | <0.001 | 0.559 (0.511-0.611) | <0.001 | 0.800 (0.708-0.904) | <0.001 | |
| FVPTC | 0.544 (0.461-0.643) | <0.001 | 0.482 (0.361-0.644) | <0.001 | 1.062 (0.968-1.165) | 0.201 | 0.801 (0.702-0.914) | <0.001 | |
| T-stage | T1 | Ref | Ref | Ref | Ref | ||||
| T2 | 2.529 (1.945-3.289) | <0.001 | 2.006 (1.469-2.738) | <0.001 | 1.041 (0.961-1.129) | 0.323 | 1.087 (0.991-1.191) | 0.077 | |
| T3 | 7.346 (5.971-9.038) | <0.001 | 3.694 (2.681-5.089) | <0.001 | 1.492 (1.390-1.601) | <0.001 | 1.141 (1.010-1.289) | 0.035 | |
| T4 | 81.543 (67.445-98.588) | <0.001 | 14.264 (9.883-20.586) | <0.001 | 6.979 (6.487-7.508) | <0.001 | 2.666 (2.259-3.146) | <0.001 | |
| N-stage | N0 | Ref | Ref | Ref | Ref | ||||
| N1 | 4.880 (4.332-5.498) | <0.001 | 1.946 (1.641-2.307) | <0.001 | 1.661 (1.562-1.767) | <0.001 | 1.483 (1.362-1.614) | <0.001 | |
| M-stage | M0 | Ref | Ref | Ref | Ref | ||||
| M1 | 51.522 (45.896-57.838) | <0.001 | 7.299 (6.133-8.686) | <0.001 | 12.860 (11.886-13.914) | <0.001 | 4.052 (3.588-4.576) | <0.001 | |
| Multifocality | No | Ref | Ref | Ref | Ref | ||||
| Yes | 0.865 (0.765-0.978) | 0.021 | 0.746 (0.643-0.865) | <0.001 | 0.882 (0.835-0.932) | <0.001 | 0.967 (0.907-1.031) | 0.305 | |
| Extension | No | Ref | Ref | Ref | Ref | ||||
| Yes | 13.025 (11.495-14.758) | <0.001 | 1.456 (1.087-1.952) | 0.012 | 2.501 (2.362-2.647) | <0.001 | 1.094 (0.952-1.257) | 0.206 | |
| Radiation | None or refused | Ref | Ref | Ref | Ref | ||||
| Radiation Beam or Rdioactive implants | 13.670 (11.982-15.596) | <0.001 | 3.046 (2.435-3.809) | <0.001 | 3.164 (2.896-3.456) | <0.001 | 1.455 (1.260-1.680) | <0.001 | |
| Radioisotopes or Radiation beam + isotopes/implants | 0.989 (0.885-1.106) | 0.849 | 0.837 (0.702-0.997) | 0.046 | 0.599 (0.570-0.628) | <0.001 | 0.699 (0.652-0.748) | <0.001 | |
| Surgery | Lobectomy | Ref | Ref | Ref | Ref | ||||
| Subtotal or near-total thyroidectomy | 1.795 (1.326-2.429) | <0.001 | 1.057 (0.712-1.570) | 0.782 | 1.023 (0.906-1.155) | 0.713 | 0.999 (0.859-1.162) | 0.989 | |
| Total thyroidectomy | 1.486 (1.230-1.795) | <0.001 | 1.032 (0.803-1.326) | 0.804 | 0.808 (0.756-0.863) | <0.001 | 0.983 (0.903-1.070) | 0.691 | |
FTC: follicular thyroid cancer; PTC: papillary thyroid cancer; FVPTC: follicular variant papillary thyroid cancer.
Adjusting for patient characteristics using PSM
The cancer-specific rate of mortality was significantly different when compared to FTC to PTC and FVPTC (FTC was higher than PTC or FVPTC), without matching for any confounders (both P<0.001, Figure 1A-C). Whereas, the all-cause mortality rate of patients with FTC was significantly higher/lower when compared to PTC (P<0.001), but there was no significant difference in all-cause mortality rate of patients between the FTC and FVPTC group (P=0.233, Figure 1D-F). To minimize selection bias, PSM was performed for age, sex, race, TNM stage, multifocality, tumor extension, radiation and surgical treatment. PSM analysis performed for demographic data such as age, sex, and race, revealed that cancer-specific mortality rates between both FTC and PTC group and FTC and FVPTC group were significantly different (P<0.001, P<0.001 respectively; Figure 2A, 2B). Furthermore, PSM analysis for age, sex, race, and clinicopathologic features (T/N/M stage, multifocality, and extension), also showed significant differences in cancer-specific mortality rates between FTC and PTC, and FTC and FVPTC groups (both P<0.001; Figure 3A, 3B). PSM analysis performed for all relevant factors and radiation and surgical treatment, demonstrated that the cancer-specific mortality rate for FTC group remained still significantly higher compared to PTC and FVPTC group (both P<0.001; Figure 4A, 4B).
Figure 1.
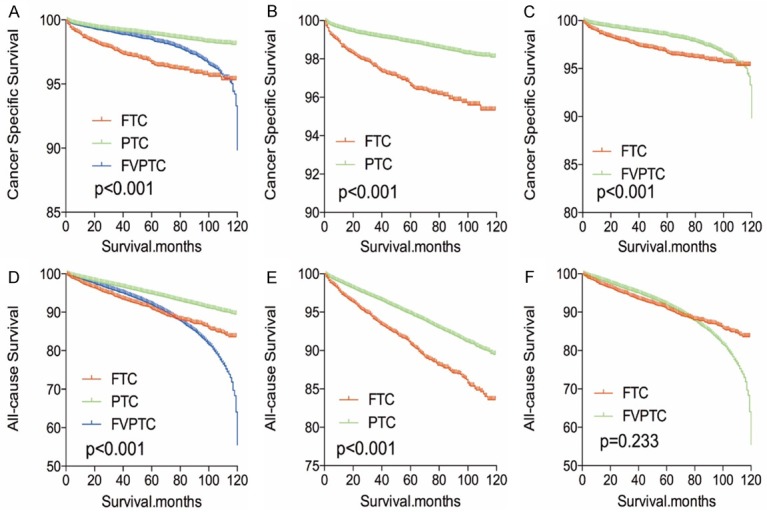
Kaplan Meier curves among patients stratified by subtype for cancer-specific mortality (A-C) and all cause mortality (D-F).
Figure 2.
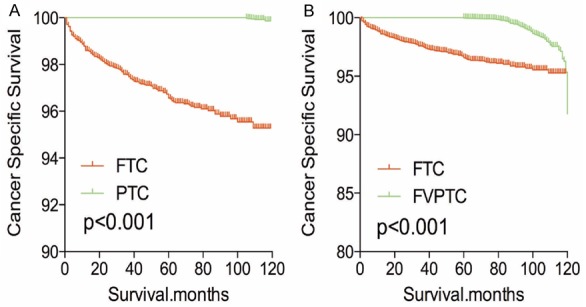
Kaplan Meier curves of cancer-specific mortality for matched subtype pairs. Age, sex and race matching between FTC and PTC (A), FTC and FVPTC (B).
Figure 3.
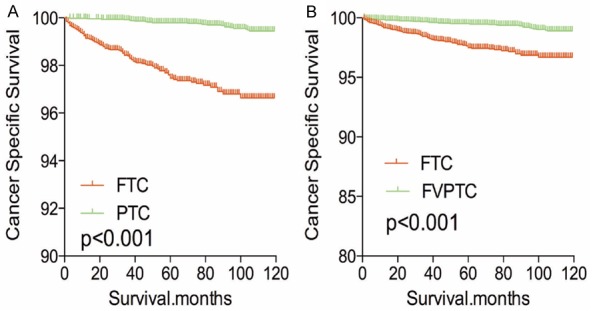
Kaplan Meier curves of cancer-specific mortality for matched subtype pairs. Age, sex, race, T/N/M stage, multifocality, extension matched between FTC and PTC (A), FTC and FVPTC (B).
Figure 4.
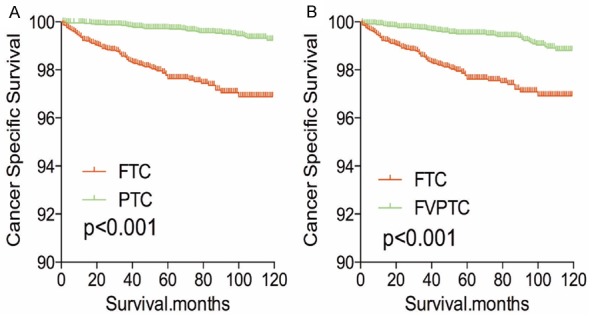
Kaplan Meier curves of cancer-specific mortality for matched subtype pairs. Age, sex, race, T/N/M stage, multifocality, extension, surgery and radiation treatment matched between FTC and PTC (A), FTC and FVPTC (B).
After PSM analysis was performed for demographic data (age, sex, and race), all-cause mortality rate for FTC was worse compared to PTC and FVPTC (both P<0.001, Figure 5A, 5B). Similar results were obtained when PSM analysis for age, sex, race and clinicopathologic factors (T/N/M stage, multifocality, and extension; Figure 6A, 6B), and PSM analysis for all relevant factors and radiation and surgical treatment (Figure 7A, 7B) were performed.
Figure 5.
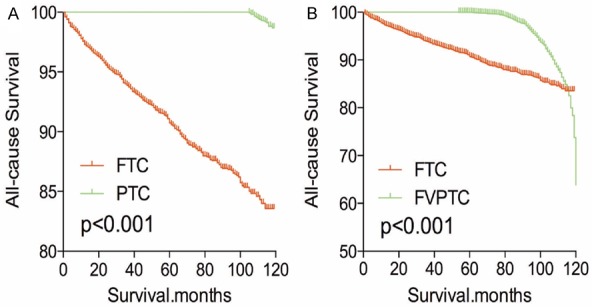
Kaplan Meier curves of all cause mortality for matched subtype pairs. Age, sex and race matching between FTC and PTC (A), FTC and FVPTC (B).
Figure 6.
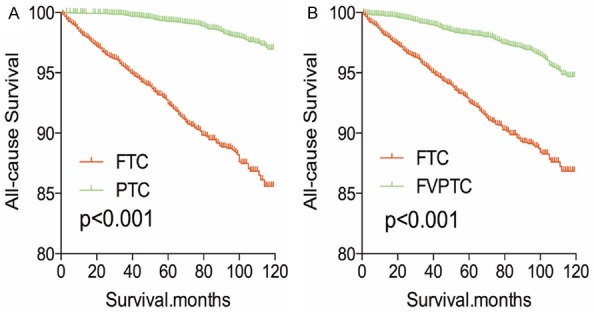
Kaplan Meier curves of all cause mortality for matched subtype pairs. Age, sex, race, T/N/M stage, multifocality, extension matching between FTC and PTC (A), FTC and FVPTC (B).
Figure 7.
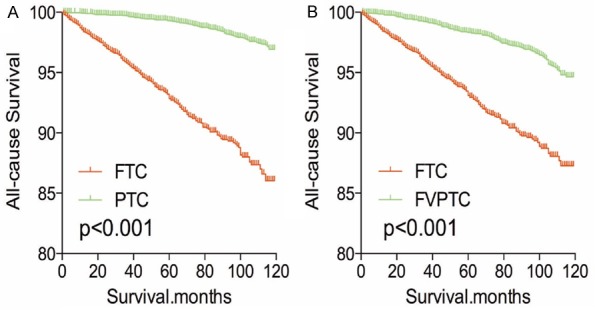
Kaplan Meier curves of all cause mortality for matched subtype pairs. Age, sex, race, T/N/M stage, multifocality, extension, surgery and radiation treatment matching between FTC and PTC (A), FTC and FVPTC (B).
Discussion
According to World Health Organization classification, FTC is a malignant epithelial tumor showing follicular cell differentiation, without the nuclear features of papillary thyroid carcinoma [10]. The histological definitions of PTC, FTC and FVPTC are based on the predominant papillary or follicular growth pattern, and alterations in nuclear morphology [10,16]. Many thyroid cancers which were previously diagnosed as FTC were later labeled as FVPTC after Chem and Rosai defined the FVPTC in 1977 [17]. In addition, follicular adenomas cannot be distinguished from follicular thyroid cancer cytologically because the distinction between them is based on capsular and vascular invasion, neither of which can be seen in the cytology specimens [10].
Verkooijen et al., 2003 found that almost 45% of thyroid nodules initially classified as FTC in the years 1970-80 were reclassified as PTC after pathological re-evaluation of specimens [18]. Many genetic alterations such as RAS mutation and rearrangements of PPAR-γ have been identified to have a fundamental role in follicular thyroid oncogenesis [10,19-22]. Based on this insight, tumor histological features, recurrence, and cancer-specific mortality have been better illustrated now than before.
However, for a long time, the prognosis of FTC has been controversial. Nicole et al., 2016, demonstrated that FTC patients portends a worse outcome compared with that of the patients with FVPTC [15]. However, Verburg et al. hypothesized that patients with FTC were often diagnosed with advanced stage disease, older age and distant metastasis. They further identified that patients with FTC and PTC seemed to have similar prognosis when matched for age and stage of cancer [23].
In this study, however, we illustrated that the prognosis for FTC (both cancer-specific and all-cause mortality) is worse than both PTC and FVPTC, based on a large population: SEER database. Previous studies have shown that an increased age contribute to an increase in cancer-specific mortality for patients with thyroid cancer [24]. Englum et al., [25] suggested that the mean age for diagnosis of FTC was slightly higher than that for PTC and FVPTC. Also, the frequency of FTC diagnosis increased as the age of the patient from 45 years which is consistent with our study. On the other hand, the age as a risk factor per se may impact the prognosis of thyroid cancer patients. Except patients’ age, other confounders like gender, race, T/N/M stage and treatment may all affect the prognosis of thyroid cancer and therefore should be adjusted when analyzing the prognosis of different histological subtypes. In our study, however, after the PSM analysis for all the effect/confounder factors, the cancer-specific mortality and all-cause mortality were still worse for patients with FTC than both PTC and FVPTC. Thus, our finding may provide a reliable evidence for the worse outcome of patients with FTC compared to PTC and FVPTC.
Interestingly, it has been reported in previous studies that distant metastasis was observed in 15-27% patients with FTC most likely due to that fact that FTC spread haematogenously [26-29]. However, in this study, only 5.8% of patients showed distant metastasis of FTC, compared to 1.2% of patients with PTC and 1.1% of patients with FVPTC.
Although our findings show a worse prognosis of FTC, there are some limitations in this study. First of all, recurrence, which is another important indicator for prognosis, is not incorporated in SEER database as the SEER database only possesses reliable information during the diagnostic period, hence, it may introduce an overestimation bias when designating cancer-specific and all-cause mortality rates of different cancer subtypes. Furthermore, lack of molecular marker information such as RAS mutation and TERT mutation, which might help for a better adjustment and minimize selection bias, is other limitation in this study. In addition to this, vascular invasion, family history, number of lymph node metastases and other histological findings were also not included in our study.
Conclusion
In summary, we illustrated that the average prognosis of FTC is poorer than both PTC and FVPTC, even after adjustment for demographic characteristics, clinicopathologic data, and cancer treatment adjustment. Thus, this study provides a benefit reference for patients with FTC and a precise treatment and management of these tumors with better planning for future therapies in patients with FTC.
Disclosure of conflict of interest
None.
References
- 1.Davies L, Morris L, Hankey B. Increases in thyroid cancer incidence and mortality. JAMA. 2017;318:389–390. doi: 10.1001/jama.2017.7906. [DOI] [PubMed] [Google Scholar]
- 2.D’Avanzo A, Ituarte P, Treseler P, Kebebew E, Wu J, Wong M, Duh QY, Siperstein AE, Clark OH. Prognostic scoring systems in patients with follicular thyroid cancer: a comparison of different staging systems in predicting the patient outcome. Thyroid. 2004;14:453–458. doi: 10.1089/105072504323150778. [DOI] [PubMed] [Google Scholar]
- 3.Fagin JA, Wells SA Jr. Biologic and clinical perspectives on thyroid cancer. N Engl J Med. 2016;375:2307. doi: 10.1056/NEJMc1613118. [DOI] [PubMed] [Google Scholar]
- 4.Mao Y, Xing M. Recent incidences and differential trends of thyroid cancer in the USA. Endocr Relat Cancer. 2016;23:313–322. doi: 10.1530/ERC-15-0445. [DOI] [PMC free article] [PubMed] [Google Scholar]
- 5.Liu C, Ming J, Zeng W, Wang S, Xiong Y, Zhao Q, Yin X, Liu Z, Huang T. Unanticipated prognosis of differential thyroid cancer patients with T0 stage: analysis of the SEER database 2004-2013. Oncotarget. 2017;8:70777–70787. doi: 10.18632/oncotarget.19988. [DOI] [PMC free article] [PubMed] [Google Scholar]
- 6.Liu C, Zhao Q, Zeng W, Chen C, Ming J, Wang S, Xiong Y, Zhang C, Chen T, Liu Z, Huang T. Do patients with oxyphilic cell papillary thyroid carcinoma have a poor prognosis? Analysis of the surveillance, epidemiology, and end results database 2004-2013 with propensity score matching. Oncotarget. 2017;8:77075–77085. doi: 10.18632/oncotarget.20355. [DOI] [PMC free article] [PubMed] [Google Scholar]
- 7.Topstad D, Dickinson JA. Thyroid cancer incidence in Canada: a national cancer registry analysis. CMAJ Open. 2017;5:E612–E616. doi: 10.9778/cmajo.20160162. [DOI] [PMC free article] [PubMed] [Google Scholar]
- 8.Zheng R, Zeng H, Zhang S, Chen W. Estimates of cancer incidence and mortality in China, 2013. Chin J Cancer. 2017;36:66. doi: 10.1186/s40880-017-0234-3. [DOI] [PMC free article] [PubMed] [Google Scholar]
- 9.Haugen BR, Alexander EK, Bible KC, Doherty GM, Mandel SJ, Nikiforov YE, Pacini F, Randolph GW, Sawka AM, Schlumberger M, Schuff KG, Sherman SI, Sosa JA, Steward DL, Tuttle RM, Wartofsky L. 2015 american thyroid association management guidelines for adult patients with thyroid nodules and differentiated thyroid cancer: the american thyroid association guidelines task force on thyroid nodules and differentiated thyroid cancer. Thyroid. 2016;26:1–133. doi: 10.1089/thy.2015.0020. [DOI] [PMC free article] [PubMed] [Google Scholar]
- 10.Grani G, Lamartina L, Durante C, Filetti S, Cooper DS. Follicular thyroid cancer and Hurthle cell carcinoma: challenges in diagnosis, treatment, and clinical management. Lancet Diabetes Endocrinol. 2018;6:500–514. doi: 10.1016/S2213-8587(17)30325-X. [DOI] [PubMed] [Google Scholar]
- 11.Liu C, Chen T, Zeng W, Wang S, Xiong Y, Liu Z, Huang T. Reevaluating the prognostic significance of male gender for papillary thyroid carcinoma and microcarcinoma: a SEER database analysis. Sci Rep. 2017;7:11412. doi: 10.1038/s41598-017-11788-8. [DOI] [PMC free article] [PubMed] [Google Scholar]
- 12.Liu Z, Zeng W, Maimaiti Y, Ming J, Guo Y, Liu Y, Liu C, Huang T. High expression of yes-activated protein-1 in papillary thyroid carcinoma correlates with poor prognosis. Appl Immunohistochem Mol Morphol. 2017 doi: 10.1097/PAI.0000000000000544. [Epub ahead of print] [DOI] [PubMed] [Google Scholar]
- 13.Liu C, Wang S, Zeng W, Guo Y, Liu Z, Huang T. Total tumour diameter is superior to unifocal diameter as a predictor of papillary thyroid microcarcinoma prognosis. Sci Rep. 2017;7:1846. doi: 10.1038/s41598-017-02165-6. [DOI] [PMC free article] [PubMed] [Google Scholar]
- 14.Liu Z, Huang T. Papillary thyroid microcarcinoma and active surveillance. Lancet Diabetes Endocrinol. 2016;4:974–975. doi: 10.1016/S2213-8587(16)30269-8. [DOI] [PubMed] [Google Scholar]
- 15.Cipriani NA, Nagar S, Kaplan SP, White MG, Antic T, Sadow PM, Aschebrook-Kilfoy B, Angelos P, Kaplan EL, Grogan RH. Follicular thyroid carcinoma: how have histologic diagnoses changed in the last half-century and what are the prognostic implications? Thyroid. 2015;25:1209–1216. doi: 10.1089/thy.2015.0297. [DOI] [PMC free article] [PubMed] [Google Scholar]
- 16.Tallini G, Tuttle RM, Ghossein RA. The history of the follicular variant of papillary thyroid carcinoma. J Clin Endocrinol Metab. 2017;102:15–22. doi: 10.1210/jc.2016-2976. [DOI] [PubMed] [Google Scholar]
- 17.Chem KT, Rosai J. Follicular variant of thyroid papillary carcinoma: a clinicopathologic study of six cases. Am J Surg Pathol. 1977;1:123–130. doi: 10.1097/00000478-197706000-00003. [DOI] [PubMed] [Google Scholar]
- 18.Verkooijen HM, Fioretta G, Pache JC, Franceschi S, Raymond L, Schubert H, Bouchardy C. Diagnostic changes as a reason for the increase in papillary thyroid cancer incidence in Geneva, Switzerland. Cancer Causes Control. 2003;14:13–17. doi: 10.1023/a:1022593923603. [DOI] [PubMed] [Google Scholar]
- 19.Xing M. Clinical utility of RAS mutations in thyroid cancer: a blurred picture now emerging clearer. BMC Med. 2016;14:12. doi: 10.1186/s12916-016-0559-9. [DOI] [PMC free article] [PubMed] [Google Scholar]
- 20.Xing M. Molecular pathogenesis and mechanisms of thyroid cancer. Nat Rev Cancer. 2013;13:184–199. doi: 10.1038/nrc3431. [DOI] [PMC free article] [PubMed] [Google Scholar]
- 21.Xing M, Haugen BR, Schlumberger M. Progress in molecular-based management of differentiated thyroid cancer. Lancet. 2013;381:1058–1069. doi: 10.1016/S0140-6736(13)60109-9. [DOI] [PMC free article] [PubMed] [Google Scholar]
- 22.Liu D, Yang C, Bojdani E, Murugan AK, Xing M. Identification of RASAL1 as a major tumor suppressor gene in thyroid cancer. J Natl Cancer Inst. 2013;105:1617–1627. doi: 10.1093/jnci/djt249. [DOI] [PMC free article] [PubMed] [Google Scholar]
- 23.Verburg FA, Mader U, Luster M, Reiners C. Histology does not influence prognosis in differentiated thyroid carcinoma when accounting for age, tumour diameter, invasive growth and metastases. Eur J Endocrinol. 2009;160:619–624. doi: 10.1530/EJE-08-0805. [DOI] [PubMed] [Google Scholar]
- 24.Adam MA, Thomas S, Hyslop T, Scheri RP, Roman SA, Sosa JA. Exploring the relationship between patient age and cancer-specific survival in papillary thyroid cancer: rethinking current staging systems. J. Clin. Oncol. 2016;34:4415–4420. doi: 10.1200/JCO.2016.68.9372. [DOI] [PMC free article] [PubMed] [Google Scholar]
- 25.Englum BR, Pura J, Reed SD, Roman SA, Sosa JA, Scheri RP. A bedside risk calculator to preoperatively distinguish follicular thyroid carcinoma from follicular variant of papillary thyroid carcinoma. World J Surg. 2015;39:2928–2934. doi: 10.1007/s00268-015-3192-4. [DOI] [PubMed] [Google Scholar]
- 26.Kushchayeva Y, Duh QY, Kebebew E, D’Avanzo A, Clark OH. Comparison of clinical characteristics at diagnosis and during follow-up in 118 patients with Hurthle cell or follicular thyroid cancer. Am J Surg. 2008;195:457–462. doi: 10.1016/j.amjsurg.2007.06.001. [DOI] [PubMed] [Google Scholar]
- 27.McLeod DS, Jonklaas J, Brierley JD, Ain KB, Cooper DS, Fein HG, Haugen BR, Ladenson PW, Magner J, Ross DS, Skarulis MC, Steward DL, Xing M, Litofsky DR, Maxon HR, Sherman SI. Reassessing the NTCTCS staging systems for differentiated thyroid cancer, including age at diagnosis. Thyroid. 2015;25:1097–1105. doi: 10.1089/thy.2015.0148. [DOI] [PMC free article] [PubMed] [Google Scholar]
- 28.Sugino K, Ito K, Nagahama M, Kitagawa W, Shibuya H, Ohkuwa K, Yano Y, Uruno T, Akaishi J, Kameyama K, Ito K. Prognosis and prognostic factors for distant metastases and tumor mortality in follicular thyroid carcinoma. Thyroid. 2011;21:751–757. doi: 10.1089/thy.2010.0353. [DOI] [PubMed] [Google Scholar]
- 29.Alfalah H, Cranshaw I, Jany T, Arnalsteen L, Leteurtre E, Cardot C, Pattou F, Carnaille B. Risk factors for lateral cervical lymph node involvement in follicular thyroid carcinoma. World J Surg. 2008;32:2623–2626. doi: 10.1007/s00268-008-9742-2. [DOI] [PubMed] [Google Scholar]


