Abstract
Background: The mechanism of microRNAs (miRNAs) in thyroid cancer is still unclear. We identified miRNAs with differential expression in thyroid cancer versus normal tissues. Methods: Microarray datasets were obtained from the GEO and ArrayExpress databases, and from publications found via PubMed, EMBASE, and Web of Science. Differentially expressed miRNAs were identified using the limma package, and their targets predicted using miRWalk. Gene Ontology (GO), Kyoto Encyclopedia of Genes and Genomes (KEGG), and protein-protein interaction (PPI) network analyses were performed using these target genes to explore potential carcinogenic mechanisms. Correlations between target gene and miRNA expression levels were examined. Changes in target protein expression were confirmed using data from The Human Protein Atlas and the Cancer Genome Atlas. Results: We ultimately included five datasets, and further analyzed the four miRNAs that were down-regulated in at least four datasets (miR-7-2-3p, miR-138-5p, miR-144-5p, miR-486-5p). Predicted targets were enriched in GO terms including extracellular matrix organization, cell surface, and receptor binding, and in KEGG cancer pathways. PPI analysis identified 10 hub genes as key potential targets of these miRNAs. The expression levels of eight target genes were negatively correlated with those of their respective miRNAs. Furthermore, eight predicted target genes in cancer-related pathways showed up-regulated protein and mRNA expression in thyroid cancer. Conclusion: Low miRNA expression in thyroid cancer might influence tumorigenesis via critical pathways. The genes identified here may act as a starting point for further investigation of the carcinogenic mechanisms of these miRNAs.
Keywords: Thyroid cancer, microRNA, microarray, pathway
Introduction
Thyroid cancer is considered the most common malignant tumor of the endocrine system [1]. In 2017, 56,870 new thyroid cancer patients and approximately 2,010 thyroid cancer deaths were predicted to occur in the United States [2]. Thanks to fine-needle aspiration biopsy, thyroid cancer can be diagnosed at an early stage, and patients can receive effective treatment. However, approximately 20% of lesions cannot be accurately categorized as begin or malignant [3]. Despite the development of treatment for thyroid cancer, the 5-year cancer-specific survival rate remains low. Therefore, it is important to identify biomarkers that can be used to assist in diagnosing and assessing the prognosis of thyroid cancer patients.
MicroRNAs (miRNAs) are a class of endogenous, small (~22 nucleotides) non-coding RNA molecules [4]. miRNAs can bind 3’-untranslated regions, regulating the expression of genes. Additionally, miRNAs can regulate the degradation of messenger RNA (mRNA), mediated by miRNA base-pairing with the mRNA [5]. miRNAs are important factors in many biological processes, including cell proliferation, apoptosis, and carcinogenesis [4]. miRNAs can target mRNAs within complex regulatory networks and use these networks to regulate tumor development and progression [7]. Because they are stable and strongly related to clinically-relevant processes, miRNAs are considered ideal biomarkers [6].
In the present study, we explored differential miRNA expression between thyroid cancer and non-cancerous tissues. The predicted targets and potential pathways of miRNAs were examined to explore and identify potential carcinogenic mechanisms of different miRNAs in thyroid cancer.
Materials and methods
Collection of miRNA microarray data
We searched microarray databases using the Gene Expression Omnibus (GEO; www.ncbi.nlm.nih.gov/geo/) and ArrayExpress (www.ebi.ac.uk/arrayexpress) to collect miRNA expression profiling data. We also searched PubMed, EMBASE, and Web of Science to identify studies containing relevant data, with the most recent update on October 3, 2017. The following literature search strategy was used: (MicroRNA or miRNA or miR) and (thyroid OR papillary OR follicular OR medullary) and (tumour OR tumor OR carcinoma OR cancer OR neoplasm* OR malignan*). We also searched the references of relevant studies to identify potential related studies. The following inclusion criteria were considered for the datasets identified: (a) data were from thyroid cancer tissues and non-thyroid cancer tissues; (b) the study used human samples; and (c) miRNA expression data was obtained and calculated for experimental and control groups. Datasets and publications were excluded from the study based on the following criteria: (a) dataset had no information on miRNA; (b) datasets did not provide complete data for further analysis; (c) samples were cell lines rather than tissues; (d) not all subjects were human; and (e) miRNA was only measured in thyroid cancer tissues without comparison tissues.
miRNA data extraction
Relevant data were extracted from the included datasets. If a study qualified for inclusion but the original microarray data could not be obtained, it was requested from the authors. The differences in miRNA expression levels were calculated independently by two authors (Denghua Pan and Liang Liang). In the event of conflicts, all authors participated in a discussion to reach an agreement. All miRNA data were standardized using miRBase version 21. All the names of miRNAs used the present study were standardized by miRBase.
Prediction of miRNA target genes
miRWalk (http://zmf.umm.uni-heidelberg.de/apps/zmf/mirwalk2/) was adopted to identify the potential targets of miRNAs using prediction programs including miRWalk, miRanda, MicroT4, miRDB, miRMap, miRBridge, miRNAMap, PICTAR2, RNA22, PITA, TargetScan, and RNAhybrid. Overlapping targets, defined as those that appeared 7 or more times among the 12 prediction software programs, were further analyzed.
Bioinformatics analysis of overlapping miRNAs
DAVID (https://david.ncifcrf.gov) was selected to perform Gene Ontology (GO) functional annotation and KEGG biological pathway analyses. P values less than 0.05 were considered statistically significant in GO and Kyoto Encyclopedia of Genes and Genomes (KEGG) analyses. The top ten results were visualized using Cytoscape version 3.2.1 software. A protein-protein interaction (PPI) network, which was generated based on the STRING database v10.0 (http://www.string-db.org), was used to indicate associations among the proteins encoded by the overlapping target genes. Nodes with a greater number of edges (i.e., interactions with other proteins) are more likely to be proteins encoded by meaningful target genes for the selected miRNAs. Hub genes were defined as nodes with at least four interactions.
Correlation of miRNAs with target genes in cancer pathways and validation
Pearson’s correlation analysis was applied to study the correlation between expression of target genes and that of miRNAs. A P value less than 0.05 was considered significant. The Human Protein Atlas and Cancer Genome Atlas data were used to examine the protein expression levels of the target genes in tumor versus normal tissues.
Statistical analysis
Student’s t-tests were applied to evaluate differences between thyroid cancer and non-cancerous tissues from each microarray database, and P values less than 0.05 were regarded as statistically significant. Among the significant differencest, fold-changes (FC) were used to define the up- and down-regulated expression of miRNAs when compared to the levels in non-cancerous tissues. The cut-off value of FC was 1.2.
Results
Validation of miRNAs in thyroid cancer
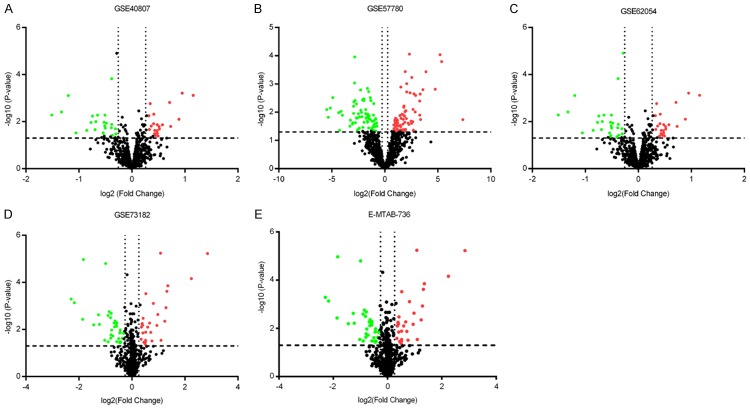
A total of 1,269 publications and microarray datasets were originally collected. After removal of duplicates and removal of publications matching the exclusion criteria, 209 records remained. After viewing the full-text articles, only five datasets matched all inclusion criteria and were included in the present study (Figure 1; Table 1). Four datasets were from GEO (GSE40807, GSE57780, GSE62054, and GSE73182) and one dataset was from ArrayExpress (E-MTAB-736). There were 91 thyroid cancer and 66 non-cancerous tissues among the datasets. Among the miRNAs in these datasets (Figure 2), 263 miRNAs were up-regulated (Figure 3A) and 375 miRNAs were down-regulated (Figure 3B). We selected for further analysis four miRNAs (miR-7-2-3p, miR-138-5p, miR-144-5p, and miR-486-5p) that were down-regulated in four or more of the five datasets.
Figure 1.
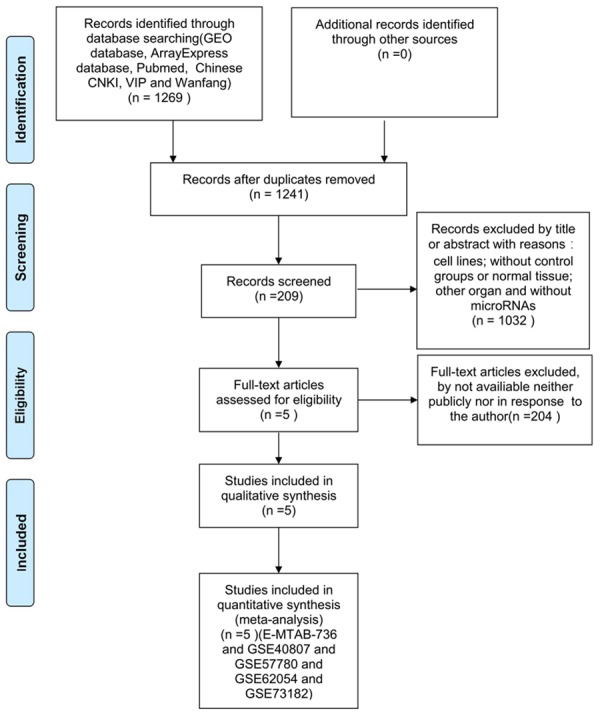
Procedure for identification and inclusion of data in the present analysis. A total of 1269 records were initially identified, and 5 datasets were included in the study after applying exclusion criteria.
Table 1.
miRNA expression datasets included in this analysis
| Datasets | Year | GPL | Types of TC | No. of Patients | Region | |
|---|---|---|---|---|---|---|
|
| ||||||
| Tumor | Control | |||||
| GSE40807 | 2014 | GPL8227 | MTC | 40 | 40 | France |
| GSE57780 | 2015 | GPL11154 | PTC | 3 | 3 | Belgium |
| GSE62054 | 2014 | GPL8179 | FTC | 17 | 8 | Norway |
| GSE73182 | 2016 | GPL20194 | PTC | 19 | 5 | Italy |
| E-MTAB-736 | 2011 | ND | FTC | 12 | 10 | Denmark |
FTC: follicular thyroid carcinoma; GPL: gene platform; MTC: medullary thyroid cancer; PTC: papillary thyroid cancer; TC: thyroid carcinoma.
Figure 2.
Expression of miRNAs in thyroid cancer datasets. miRNA expression was analyzed in each included dataset: GSE40807 (A), GSE57780 (B), GSE62054 (C), GSE73182 (D), and E-MTAB-736 (E). The P values of differences in miRNA expression in thyroid cancer tissues compared to non-cancerous tissues are plotted versus the fold-change to identify up-regulated (red) and down-regulated (green) genes. The cut-off value for the fold-change was 1.2.
Figure 3.
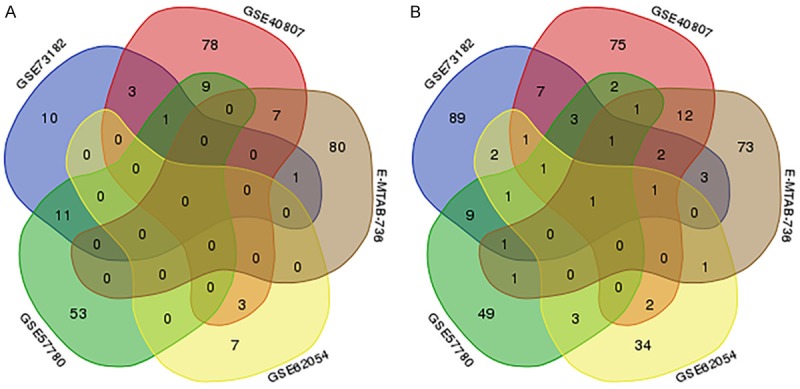
Selection of differentially expressed miRNAs overlapping between the included databases. A. A total of 263 up-regulated miRNAs in thyroid cancer tissues versus non-cancerous tissues were identified in the five indicated datasets, but no miRNAs appeared in four or five datasets simultaneously. B. A total of 375 miRNAs down-regulated in thyroid cancer tissues versus non-cancerous tissues were identified in the five datasets, and only one appeared in all five datasets simultaneously. The four miRNAs appearing in four or more datasets were selected for further analysis.
Prediction of target genes and pathway enrichment analysis
Genes targeted by the four selected miRNAs were predicted, and those that appeared in more than 7 of the 12 prediction databases were selected. The predicted target genes were cross-referenced with the Cancer Genome Atlas (TCGA) differentially expressed genes, producing 250 genes for further signaling pathways analyses. GO processes analyses showed that these genes were significantly enriched in nervous system development (P = 6.71E-06), extracellular matrix organization (P = 1.19E-05), and cell adhesion (P = 1.34E-04) biological processes (Figure 4A; Table 2). Cell surface (P = 9.83E-09) was the most significant cellular component (Figure 4B; Table 2). Heparin binding (P = 1.17E-03), receptor binding (P = 2.27E-03), and mRNA 5’-UTR binding (P = 5.68E-03) were significant molecular functions (Figure 4C; Table 2). KEGG pathway analysis showed enrichment in cancer (P = 1.17E-02) and the PI3K-Akt signaling (P = 4.52E-03) pathway (Figure 5; Table 3).
Figure 4.
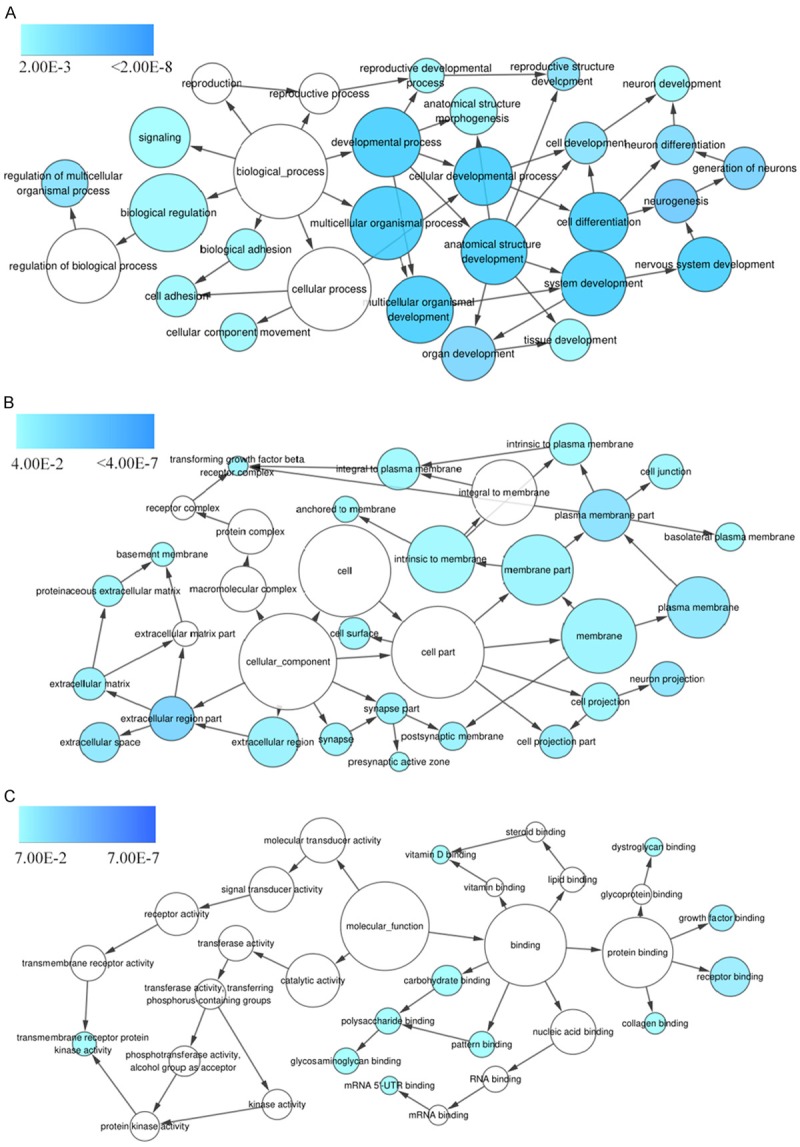
GO term enrichment analysis. Predicted target genes of the selected miRNAs are enriched in various biological processes (A), cellular components (B), and molecular functions (C) as indicated by the P value, with darker blue indicating higher significance.
Table 2.
GO enrichment analysis of miRNA targets
| Significant GO enrichment categories | P value |
|---|---|
| Biological process | |
| GO:0007399: nervous system development | 6.71E-06 |
| GO:0030198: extracellular matrix organization | 1.19E-05 |
| GO:0007155: cell adhesion | 1.34E-04 |
| GO:0001755: neural crest cell migration | 3.07E-04 |
| GO:0008284: positive regulation of cell proliferation | 4.90E-04 |
| GO:0048485: sympathetic nervous system development | 9.22E-04 |
| GO:0050919: negative chemotaxis | 1.01E-03 |
| GO:0010976: positive regulation of neuron projection development | 1.16E-03 |
| GO:0008584: male gonad development | 1.54E-03 |
| GO:0030182: neuron differentiation | 1.63E-03 |
| Cellular component | |
| GO:0009986: cell surface | 9.83E-09 |
| GO:0005576: extracellular region | 3.78E-06 |
| GO:0005886: plasma membrane | 4.47E-05 |
| GO:0030425: dendrite | 1.26E-04 |
| GO:0005887: integral component of plasma membrane | 1.60E-04 |
| GO:0043025: neuronal cell body | 2.48E-04 |
| GO:0045211: postsynaptic membrane | 4.42E-04 |
| GO:0014069: postsynaptic density | 6.78E-04 |
| GO:0005615: extracellular space | 0.001284791 |
| GO:0045121: membrane raft | 0.001498988 |
| Molecular function | |
| GO:0008201: heparin binding | 1.17E-03 |
| GO:0005102: receptor binding | 2.27E-03 |
| GO:0048027: mRNA 5’-UTR binding | 5.68E-03 |
| GO:0005518: collagen binding | 7.62E-03 |
| GO:0019901: protein kinase binding | 1.02E-02 |
| GO:0034185: apolipoprotein binding | 1.38E-02 |
| GO:0038191: neuropilin binding | 1.57E-02 |
| GO:0005088: Ras guanyl-nucleotide exchange factor activity | 1.71E-02 |
| GO:0050431: transforming growth factor beta binding | 1.78E-02 |
| GO:0038064: collagen receptor activity | 2.58E-02 |
Figure 5.
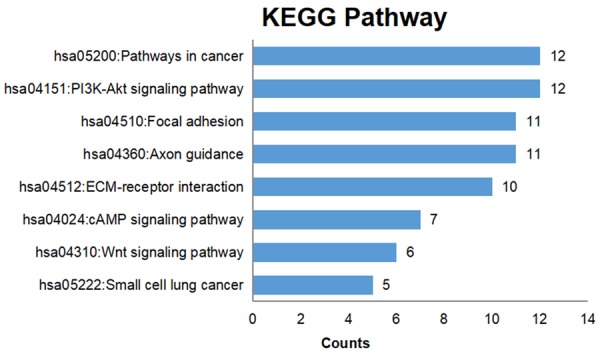
KEGG pathway enrichment analysis. The numbers of target genes in the indicated KEGG pathways are plotted for enriched pathways (defined as P < 0.05).
Table 3.
KEGG enrichment analysis of miRNA targets
| Term | P value |
|---|---|
| hsa04512: ECM-receptor interaction | 1.46E-06 |
| hsa04360: Axon guidance | 4.59E-06 |
| hsa04510: Focal adhesion | 2.90E-04 |
| hsa04151: PI3K-Akt signaling pathway | 4.52E-03 |
| hsa05200: Pathways in cancer | 1.17E-02 |
| hsa05222: Small cell lung cancer | 2.36E-02 |
| hsa04310: Wnt signaling pathway | 3.22E-02 |
| hsa04024: cAMP signaling pathway | 4.19E-02 |
PPI network construction and module analysis
We generated a network of the PPIs between the proteins encoded by the predicted target genes of the four miRNAs (Figure 6). The PPI network contained 249 nodes and 170 edges (P = 2.44E-14). Among these proteins, degree values of more than 4 were defined as hub proteins (Figure 7), including those encoded by: CD44 (degree = 7), ITGA2 (degree = 7), ITGA11 (degree = 6), CCND1 (degree = 5), COL4A1 (degree = 5), LAMC2 (degree = 5), WNT5A (degree = 5), COL5A2 (degree = 4), NT5E (degree = 4), and SPP1 (degree = 4).
Figure 6.
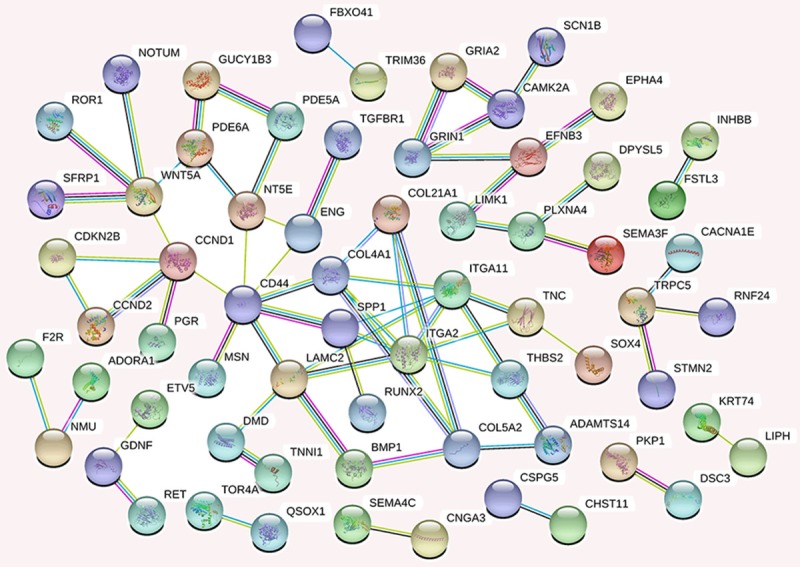
The protein-protein interaction network of proteins encoded by potential target genes of the four selected miRNAs. Each node represents a protein (n = 249), and edges/lines (n = 170) represent interactions between the proteins.
Figure 7.
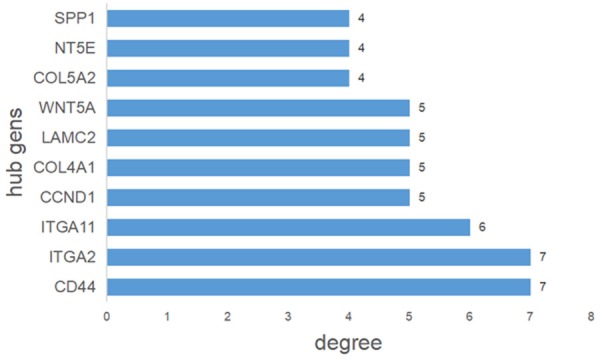
Hub genes identified by protein-protein interaction analysis. Among the predicted target genes, nodes with more than four interactions in Figure 6 were defined as hub genes.
The validation of target genes based on TCGA and THPA data
In order to validate the role of genes in cancer signaling pathways, we examined the protein expression levels of the 12 correlated genes using data from TCGA and The Human Protein Atlas. Eight genes demonstrated up-regulated protein levels (Figures 8, 9, 10 and 11). and had negative correlation with miRNAs, and among these target genes, miR-138-5p was negatively correlated with CDKN2B (r = -0.1067, P = 0.0169), TGFBR1 (r = -0.2774, P < 0.001), LAMC2 (r = -0.1003, P = 0.0248), and MECOM (r = -0.1105, P = 0.0133). MiR-144-5p was negatively correlated with ITGA2 (r = -0.1057, P = 0.0179) and LAMC2 (r = -0.08914, P = 0.0461). MiR-7-2-3p was negatively correlated with WNT5A (r = -0.1346, P = 0.0029), CCND1 (r = -0.1413, P = 0.0017), RET (r = -0.1645, P = 0.003), CDKN2B (r = -0.2015, P < 0.001), PDGFA (r = -0.1687, P = 0.002), TGFBR1 (r = -0.2833, P < 0.001), ITGA2 (r = -0.2696, P < 0.001), LAMC2 (r = -0.2281, P < 0.001), and MECOM (r = -0.09428, P = 0.0373).
Figure 8.
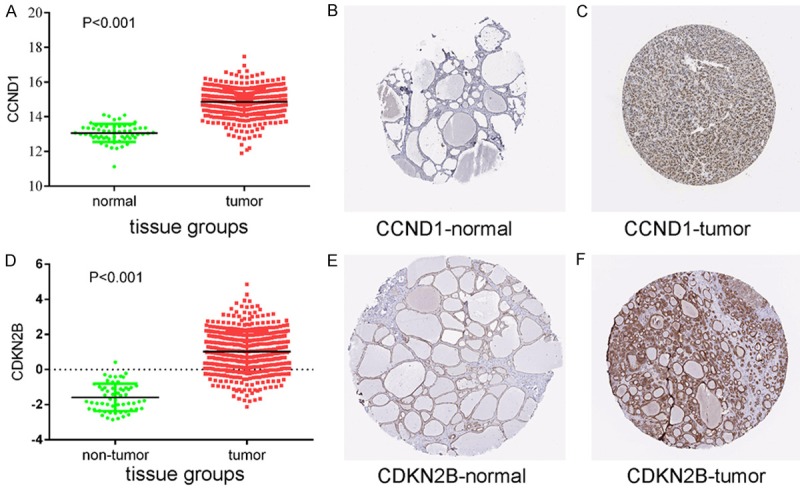
Protein expression levels of potential target genes CCND1 and CDKN2B. Up-regulation of CCND1 expression in tumor tissues compared to normal tissues was shown graphically using data from TCGA (P < 0.001) (A) as well as by representative immunostaining images from The Human Protein Atlas of normal thyroid (B) and thyroid tumor (C) tissues. Likewise, up-regulation of CDKN2B expression in tumor tissues compared to normal tissues was shown graphically using data from TCGA (P < 0.001) (D) as well as by representative immunostaining images from The Human Protein Atlas of normal thyroid (E) and thyroid tumor (F) tissues.
Figure 9.
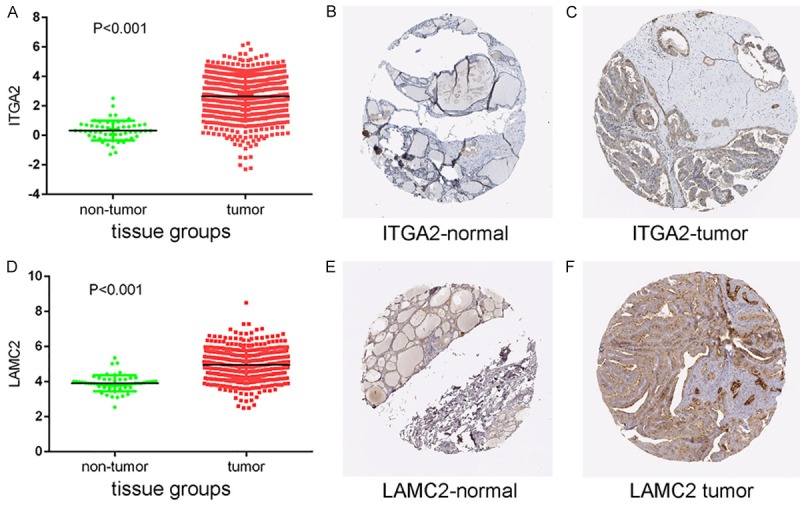
Protein expression levels of potential target genes ITGA2 and LAMC2. Up-regulation of ITGA2 expression in tumor tissues compared to normal tissues was shown graphically using data from TCGA (P < 0.001) (A) as well as by representative immunostaining images from The Human Protein Atlas of normal thyroid (B) and thyroid tumor (C) tissues. Likewise, up-regulation of LAMC2 expression in tumor tissues compared to normal tissues was shown graphically using data from TCGA (P < 0.001) (D) as well as by representative immunostaining images from The Human Protein Atlas of normal thyroid (E) and thyroid tumor (F) tissues.
Figure 10.
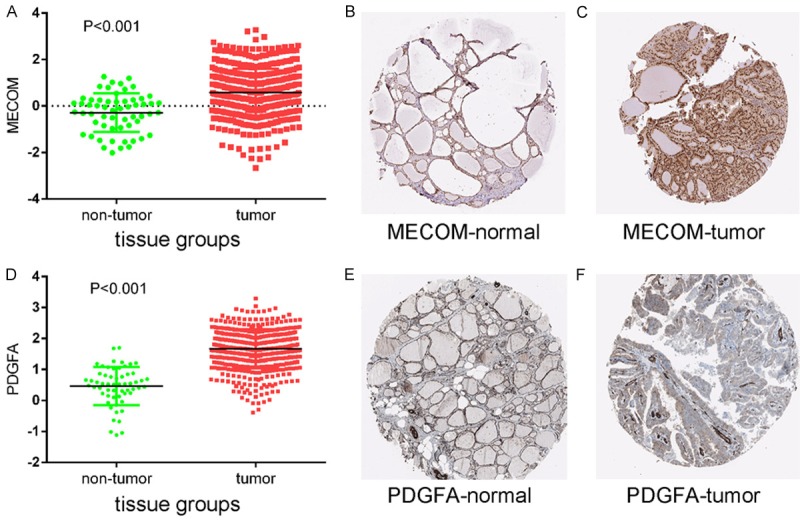
Protein expression levels of potential target genes MECOM and PDGFA. Up-regulation of MECOM expression in tumor tissues compared to normal tissues was shown graphically using data from TCGA (P < 0.001) (A) as well as by representative immunostaining images from The Human Protein Atlas of normal thyroid (B) and thyroid tumor (C) tissues. Likewise, up-regulation of PDGFA expression in tumor tissues compared to normal tissues was shown graphically using data from TCGA (P < 0.001) (D) as well as by representative immunostaining images from The Human Protein Atlas of normal thyroid (E) and thyroid tumor (F) tissues.
Figure 11.
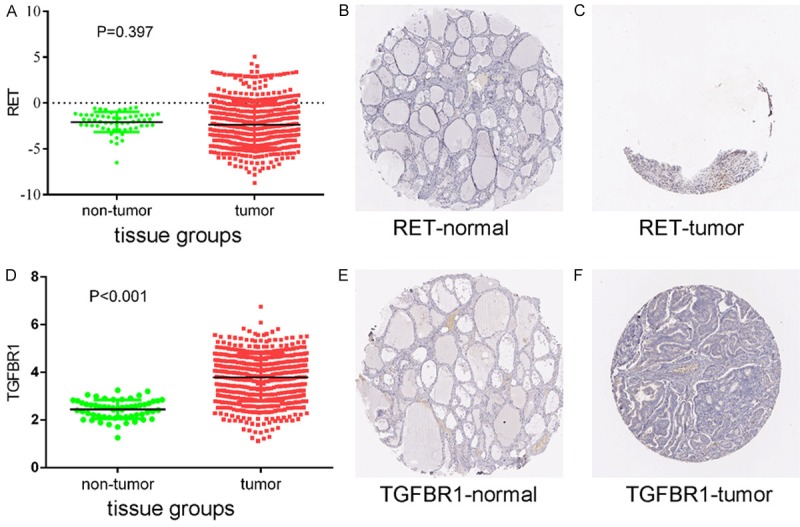
Protein expression levels of potential target genes RET and TGFBR1. Up-regulation of RET expression in tumor tissues compared to normal tissues was shown graphically using data from TCGA (P < 0.001) (A) as well as by representative immunostaining images from The Human Protein Atlas of normal thyroid (B) and thyroid tumor (C) tissues. Likewise, up-regulation of TGFBR1 expression in tumor tissues compared to normal tissues was shown graphically using data from TCGA (P < 0.001) (D) as well as by representative immunostaining images from The Human Protein Atlas of normal thyroid (E) and thyroid tumor (F) tissues.
Discussion
Thyroid cancer is a common malignancy in the endocrine system [8]. Serum thyroglobulin and calcitonin levels have served diagnostic and prognostic roles in thyroid cancer [9,10]. However, the use of thyroglobulin and calcitonin has some limitations in specificity and sensitivity [11,12]. With the increased malignancy rate of thyroid diseases, it is necessary to identify a new diagnostic biomarker to improve sensitivity and specificity of thyroid cancer detection. Previous studies demonstrated that miRNAs could help to diagnose colorectal cancer [13] and non-small cell lung cancer [14]. Studies have identified the expression of miRNAs in thyroid cancer [15-17]. In this study, differential expression of miRNAs in thyroid cancer was detected using existing microarray data. Four down-regulated miRNAs were analyzed, and miRNA target gene and pathway analyses were conducted to investigate potential mechanisms of thyroid cancer regulation by these miRNAs.
Moreover, reports have demonstrated that miRNAs play major roles in the post-transcriptional regulation of gene expression [18-20]. miRNAs down-regulate the expression of target genes by diminishing the stability transcription or inhibiting translation [18-20]. miR-7-2-3p is an antisense miRNA star product of miRNA-7-2. A previous study suggested that miR-7-2-3p was down-regulated in papillary thyroid cancer [21]. Another study showed that miR-7-2-3p is associated with progression-free survival in locally advanced esophageal adenocarcinoma [22].
miR-486-5p has been implicated as both an oncogene and suppressor in certain cancers. Studies suggested that miR-486-5p is down-regulated in several tumor types, such as lung cancer [23], hepatocellular carcinoma [24], osteosarcoma [25], and thyroid cancer [26,27]. Another study established that miR-486-5p down-regulation could increase apoptosis and inhibit cell proliferation in papillary thyroid carcinoma by directly targeting and suppressing fibrillin-1 expression [27].
The miR-144-5p level in esophageal carcinoma is lower than that in adjacent non-tumor tissues [28]. In bladder cancer, miR-144-5p directly targets CCNE1 and CCNE2, which helps to improve the prognosis of patients [29]. Studies confirmed several direct targets of miR-138-5p in cancers, such as SIRT1 in cervical cancer [30], ΔNp63 in oral squamous cell carcinoma [31], EIF4EBP1 in nasopharyngeal carcinoma [32], and PD-L1 in colorectal cancer [33].
In the present study, we identified eight genes involved in cancer signaling pathways that correlated with the selected miRNAs and showed up-regulated protein levels. In papillary thyroid cancer, expression of the miR-195 target CCND1 is negatively correlated with miR-195, which can also suppress the Wnt/β-catenin pathway, contributing to tumorigenesis [34]. Moreover, miR-613 modulates papillary thyroid cancer aggression by targeting ITGA2 [35]. In anaplastic thyroid carcinoma, silencing LAMC2 was associated with cell cycle progression, cell growth, migration, invasion, and growth factor receptor signaling [36]. A previous study showed that Wnt5a may act as a suppressor in primary thyroid lymphoma [37]. Wnt-5a participates in and has an antagonistic effect on the Wnt/β-catenin pathway [38-40]. Additionally, COL4A1 also affects tumor angiogenesis and progression [41]. So genes may affect the the pathogenesis of thyroid cancer by affecting the pathway of thyroid cancer.
Conclusion
In conclusion, our study has examined differentially expressed miRNAs in thyroid cancer based on microarray datasets and identified four down-regulated miRNAs (miR-7-2-3p,miR-138-5p, miR-144-5p, and miR-486-5p) in thyroid cancer that may play a role in thyroid cancer tumorigenesis by influencing critical pathways. However, further experimental investigations are needed to characterize the role of miRNAs in thyroid cancer.
Acknowledgements
The study was supported by the Guangxi Scientific Research and Technology Development Plan (1598011-4) and National Nature Science Foundation of Guangxi Province (2017GXNSFAA198253). The funders had no role in the study design, data collection, data analysis, decision to publish, or manuscript preparation. We are also grateful to the reviewers for their critical comments on this article.
Disclosure of conflict of interest
None.
References
- 1.Arrebola JP, Fernández MF, Martín-Olmedo P, Molina-Molina JM, Sánchez-Pérez MJ, Sánchez-Cantalejo E, Molina-Portillo E, Expósito J, Bonde JP, Olea N. Adipose tissue concentrations of persistent organic pollutants and total cancer risk in an adult cohort from Southern Spain: preliminary data from year 9 of the follow-up. Sci Total Environ. 2014;500-501:243–249. doi: 10.1016/j.scitotenv.2014.08.043. [DOI] [PubMed] [Google Scholar]
- 2.Siegel RL, Miller KD, Jemal A. Cancer statistics, 2017. CA Cancer J Clin. 2017;67:7–30. doi: 10.3322/caac.21387. [DOI] [PubMed] [Google Scholar]
- 3.Nixon AM, Provatopoulou X, Kalogera E, Zografos GN, Gounaris A. Circulating thyroid cancer biomarkers: current limitations and future prospects. Clin Endocrinol (Oxf) 2017;87:117–126. doi: 10.1111/cen.13369. [DOI] [PubMed] [Google Scholar]
- 4.Celano M, Rosignolo F, Maggisano V, Pecce V, Iannone M, Russo D, Bulotta S. MicroRNAs as biomarkers in thyroid carcinoma. Int J Genomics. 2017;2017:6496570. doi: 10.1155/2017/6496570. [DOI] [PMC free article] [PubMed] [Google Scholar]
- 5.Bartel DP. MicroRNAs: genomics, biogenesis, mechanism, and function. Cell. 2004;116:281–297. doi: 10.1016/s0092-8674(04)00045-5. [DOI] [PubMed] [Google Scholar]
- 6.Fiorino S, Bacchi-Reggiani ML, Visani M, Acquaviva G, Fornelli A, Masetti M, Tura A, Grizzi F, Zanello M, Mastrangelo L, Lombardi R, Di Tommaso L, Bondi A, Sabbatani S, Domanico A, Fabbri C, Leandri P, Pession A, Jovine E, de Biase D. MicroRNAs as possible biomarkers for diagnosis and prognosis of hepatitis B- and C-related-hepatocellular-carcinoma. World J Gastroenterol. 2016;22:3907–3936. doi: 10.3748/wjg.v22.i15.3907. [DOI] [PMC free article] [PubMed] [Google Scholar]
- 7.Xu D, Takeshita F, Hino Y, Fukunaga S, Kudo Y, Tamaki A, Matsunaga J, Takahashi RU, Takata T, Shimamoto A, Ochiya T, Tahara H. miR-22 represses cancer progression by inducing cellular senescence. J Cell Biol. 2011;193:409–424. doi: 10.1083/jcb.201010100. [DOI] [PMC free article] [PubMed] [Google Scholar]
- 8.Kitahara CM, Sosa JA. The changing incidence of thyroid cancer. Nat Rev Endocrinol. 2016;12:646–653. doi: 10.1038/nrendo.2016.110. [DOI] [PMC free article] [PubMed] [Google Scholar]
- 9.Costante G, Durante C, Francis Z, Schlumberger M, Filetti S. Determination of calcitonin levels in C-cell disease: clinical interest and potential pitfalls. Nat Clin Pract Endocrinol Metab. 2009;5:35–44. doi: 10.1038/ncpendmet1023. [DOI] [PubMed] [Google Scholar]
- 10.Varma RN. Survey of the Eastern Himalayas for endemicity of scrub typhus. Indian J Med Res. 1969;57:1228–1231. [PubMed] [Google Scholar]
- 11.Bae YJ, Schaab M, Kratzsch J. Calcitonin as biomarker for the medullary thyroid carcinoma. Recent Results Cancer Res. 2015;204:117–137. doi: 10.1007/978-3-319-22542-5_5. [DOI] [PubMed] [Google Scholar]
- 12.Indrasena BS. Use of thyroglobulin as a tumour marker. World J Biol Chem. 2017;8:81–85. doi: 10.4331/wjbc.v8.i1.81. [DOI] [PMC free article] [PubMed] [Google Scholar]
- 13.Pan C, Yan X, Li H, Huang L, Yin M, Yang Y, Gao R, Hong L, Ma Y, Shi C, Qin H, Zhang P. Systematic literature review and clinical validation of circulating microRNAs as diagnostic biomarkers for colorectal cancer. Oncotarget. 2017;8:68317–68328. doi: 10.18632/oncotarget.19344. [DOI] [PMC free article] [PubMed] [Google Scholar]
- 14.Zhou Q, Huang SX, Zhang F, Li SJ, Liu C, Xi YY, Wang L, Wang X, He QQ, Sun CC, Li DJ. MicroRNAs: a novel potential biomarker for diagnosis and therapy in patients with non-small cell lung cancer. Cell Prolif. 2017:50. doi: 10.1111/cpr.12394. [DOI] [PMC free article] [PubMed] [Google Scholar]
- 15.Nikiforova MN, Tseng GC, Steward D, Diorio D, Nikiforov YE. MicroRNA expression profiling of thyroid tumors: biological significance and diagnostic utility. J Clin Endocrinol Metab. 2008;93:1600–1608. doi: 10.1210/jc.2007-2696. [DOI] [PMC free article] [PubMed] [Google Scholar]
- 16.Mian C, Pennelli G, Fassan M, Balistreri M, Barollo S, Cavedon E, Galuppini F, Pizzi M, Vianello F, Pelizzo MR, Girelli ME, Rugge M, Opocher G. MicroRNA profiles in familial and sporadic medullary thyroid carcinoma: preliminary relationships with RET status and outcome. Thyroid. 2012;22:890–896. doi: 10.1089/thy.2012.0045. [DOI] [PMC free article] [PubMed] [Google Scholar]
- 17.Dettmer M, Vogetseder A, Durso MB, Moch H, Komminoth P, Perren A, Nikiforov YE, Nikiforova MN. MicroRNA expression array identifies novel diagnostic markers for conventional and oncocytic follicular thyroid carcinomas. J Clin Endocrinol Metab. 2013;98:E1–7. doi: 10.1210/jc.2012-2694. [DOI] [PMC free article] [PubMed] [Google Scholar]
- 18.Bartel DP. MicroRNAs: target recognition and regulatory functions. Cell. 2009;136:215–233. doi: 10.1016/j.cell.2009.01.002. [DOI] [PMC free article] [PubMed] [Google Scholar]
- 19.Shukla GC, Singh J, Barik S. MicroRNAs: processing, maturation, target recognition and regulatory functions. Mol Cell Pharmacol. 2011;3:83–92. [PMC free article] [PubMed] [Google Scholar]
- 20.Oliveto S, Mancino M, Manfrini N, Biffo S. Role of microRNAs in translation regulation and cancer. World J Biol Chem. 2017;8:45–56. doi: 10.4331/wjbc.v8.i1.45. [DOI] [PMC free article] [PubMed] [Google Scholar]
- 21.Saiselet M, Gacquer D, Spinette A, Craciun L, Decaussin-Petrucci M, Andry G, Detours V, Maenhaut C. New global analysis of the microRNA transcriptome of primary tumors and lymph node metastases of papillary thyroid cancer. BMC Genomics. 2015;16:828. doi: 10.1186/s12864-015-2082-3. [DOI] [PMC free article] [PubMed] [Google Scholar]
- 22.Matsui D, Zaidi AH, Martin SA, Omstead AN, Kosovec JE, Huleihel L, Saldin LT, DiCarlo C, Silverman JF, Hoppo T, Finley GG, Badylak SF, Kelly RJ, Jobe BA. Primary tumor microRNA signature predicts recurrence and survival in patients with locally advanced esophageal adenocarcinoma. Oncotarget. 2016;7:81281–81291. doi: 10.18632/oncotarget.12832. [DOI] [PMC free article] [PubMed] [Google Scholar]
- 23.Wang J, Tian X, Han R, Zhang X, Wang X, Shen H, Xue L, Liu Y, Yan X, Shen J, Mannoor K, Deepak J, Donahue JM, Stass SA, Xing L, Jiang F. Downregulation of miR-486-5p contributes to tumor progression and metastasis by targeting protumorigenic ARHGAP5 in lung cancer. Oncogene. 2014;33:1181–1189. doi: 10.1038/onc.2013.42. [DOI] [PMC free article] [PubMed] [Google Scholar]
- 24.Huang XP, Hou J, Shen XY, Huang CY, Zhang XH, Xie YA, Luo XL. MicroRNA-486-5p, which is downregulated in hepatocellular carcinoma, suppresses tumor growth by targeting PIK3R1. FEBS J. 2015;282:579–594. doi: 10.1111/febs.13167. [DOI] [PubMed] [Google Scholar]
- 25.Namløs HM, Meza-Zepeda LA, Barøy T, Østensen IH, Kresse SH, Kuijjer ML, Serra M, Bürger H, Cleton-Jansen AM, Myklebost O. Modulation of the osteosarcoma expression phenotype by microRNAs. PLoS One. 2012;7:e48086. doi: 10.1371/journal.pone.0048086. [DOI] [PMC free article] [PubMed] [Google Scholar]
- 26.Swierniak M, Wojcicka A, Czetwertynska M, Stachlewska E, Maciag M, Wiechno W, Gornicka B, Bogdanska M, Koperski L, de la Chapelle A, Jazdzewski K. In-depth characterization of the microRNA transcriptome in normal thyroid and papillary thyroid carcinoma. J Clin Endocrinol Metab. 2013;98:E1401–1409. doi: 10.1210/jc.2013-1214. [DOI] [PMC free article] [PubMed] [Google Scholar]
- 27.Ma X, Wei J, Zhang L, Deng D, Liu L, Mei X, He X, Tian J. miR-486-5p inhibits cell growth of papillary thyroid carcinoma by targeting fibrillin-1. Biomed Pharmacother. 2016;80:220–226. doi: 10.1016/j.biopha.2016.03.020. [DOI] [PubMed] [Google Scholar]
- 28.Gao Z, Liu R, Liao J, Yang M, Pan E, Yin L, Pu Y. Possible tumor suppressive role of the miR-144/451 cluster in esophageal carcinoma as determined by principal component regression analysis. Mol Med Rep. 2016;14:3805–3813. doi: 10.3892/mmr.2016.5691. [DOI] [PubMed] [Google Scholar]
- 29.Matsushita R, Seki N, Chiyomaru T, Inoguchi D, Ishihara T, Goto Y, Nishikawa R, Mataki H, Tatarano S, Itesako T, Nakagawa M, Enokida H. Tumour-suppressive microRNA-144-5p directly targets CCNE1/2 as potential prognostic markers in bladder cancer. Br J Cancer. 2015;113:282–289. doi: 10.1038/bjc.2015.195. [DOI] [PMC free article] [PubMed] [Google Scholar]
- 30.Ou L, Wang D, Zhang H, Yu Q, Hua F. Decreased expression of MiR-138-5p by LncRNA H19 in cervical cancer promotes tumor proliferation. Oncol Res. 2017 doi: 10.3727/096504017X15017209042610. [Epub ahead of print] [DOI] [PMC free article] [PubMed] [Google Scholar]
- 31.Zhuang Z, Xie N, Hu J, Yu P, Wang C, Hu X, Han X, Hou J, Huang H, Liu X. Interplay between DeltaNp63 and miR-138-5p regulates growth, metastasis and stemness of oral squamous cell carcinoma. Oncotarget. 2017;8:21954–21973. doi: 10.18632/oncotarget.15752. [DOI] [PMC free article] [PubMed] [Google Scholar]
- 32.Gao W, Lam JW, Li JZ, Chen SQ, Tsang RK, Chan JY, Wong TS. MicroRNA-138-5p controls sensitivity of nasopharyngeal carcinoma to radiation by targeting EIF4EBP1. Oncol Rep. 2017;37:913–920. doi: 10.3892/or.2017.5354. [DOI] [PubMed] [Google Scholar]
- 33.Zhao L, Yu H, Yi S, Peng X, Su P, Xiao Z, Liu R, Tang A, Li X, Liu F, Shen S. The tumor suppressor miR-138-5p targets PD-L1 in colorectal cancer. Oncotarget. 2016;7:45370–45384. doi: 10.18632/oncotarget.9659. [DOI] [PMC free article] [PubMed] [Google Scholar]
- 34.Yin Y, Hong S, Yu S, Huang Y, Chen S, Liu Y, Zhang Q, Li Y, Xiao H. MiR-195 inhibits tumor growth and metastasis in papillary thyroid carcinoma cell lines by targeting CCND1 and FGF2. Int J Endocrinol. 2017;2017:6180425. doi: 10.1155/2017/6180425. [DOI] [PMC free article] [PubMed] [Google Scholar]
- 35.Yang Z, Yuan Z, Fan Y, Deng X, Zheng Q. Integrated analyses of microRNA and mRNA expression profiles in aggressive papillary thyroid carcinoma. Mol Med Rep. 2013;8:1353–1358. doi: 10.3892/mmr.2013.1699. [DOI] [PubMed] [Google Scholar]
- 36.Garg M, Kanojia D, Okamoto R, Jain S, Madan V, Chien W, Sampath A, Ding LW, Xuan M, Said JW, Doan NB, Liu LZ, Yang H, Gery S, Braunstein GD, Koeffler HP. Laminin-5gamma-2 (LAMC2) is highly expressed in anaplastic thyroid carcinoma and is associated with tumor progression, migration, and invasion by modulating signaling of EGFR. J Clin Endocrinol Metab. 2014;99:E62–72. doi: 10.1210/jc.2013-2994. [DOI] [PMC free article] [PubMed] [Google Scholar]
- 37.Wang L, Yang D, Wang YH, Li X, Gao HM, Lv JY, Wang L, Xin SJ. Wnt5a and Ror2 expression associate with the disease progress of primary thyroid lymphoma. Tumour Biol. 2016;37:6085–6090. doi: 10.1007/s13277-015-4471-2. [DOI] [PMC free article] [PubMed] [Google Scholar]
- 38.Lee JM, Kim IS, Kim H, Lee JS, Kim K, Yim HY, Jeong J, Kim JH, Kim JY, Lee H, Seo SB, Kim H, Rosenfeld MG, Kim KI, Baek SH. RORalpha attenuates Wnt/beta-catenin signaling by PKCalpha-dependent phosphorylation in colon cancer. Mol Cell. 2010;37:183–195. doi: 10.1016/j.molcel.2009.12.022. [DOI] [PubMed] [Google Scholar]
- 39.Topol L, Jiang X, Choi H, Garrett-Beal L, Carolan PJ, Yang Y. Wnt-5a inhibits the canonical Wnt pathway by promoting GSK-3-independent beta-catenin degradation. J Cell Biol. 2003;162:899–908. doi: 10.1083/jcb.200303158. [DOI] [PMC free article] [PubMed] [Google Scholar]
- 40.Sato A, Yamamoto H, Sakane H, Koyama H, Kikuchi A. Wnt5a regulates distinct signalling pathways by binding to Frizzled2. EMBO J. 2010;29:41–54. doi: 10.1038/emboj.2009.322. [DOI] [PMC free article] [PubMed] [Google Scholar]
- 41.Kalluri R. Basement membranes: structure, assembly and role in tumour angiogenesis. Nat Rev Cancer. 2003;3:422–433. doi: 10.1038/nrc1094. [DOI] [PubMed] [Google Scholar]


