

Abstract
Animals must respond to various threats to survive. Neurons that express calcitonin gene-related peptide (CGRP) in the parabrachial nucleus (PBN) relay sensory signals that contribute to satiation and pain-induced fear behavior, but it is unknown how they encode these distinct processes. By recording calcium transients in vivo from individual CGRPPBN neurons, we reveal that most neurons are activated by noxious cutaneous (shock, heat, itch) and visceral stimuli (lipopolysaccharide). These same neurons are inhibited during feeding, but become activated during satiation, consistent with evidence that CGRPPBN neurons prevent overeating. CGRPPBN neurons are also activated during consumption of novel food or by an auditory cue that was previously paired with electrical foot shocks. Correspondingly, silencing CGRPPBN neurons attenuates expression of food neophobia and conditioned fear responses. Therefore, in addition to transducing primary sensory danger signals, CGRPPBN neurons promote affective-behavioral states that limit harm in response to potential threats.
INTRODUCTION
The PBN receives ascending input from many sensory modalities and relays this information to brain areas that transform sensory signals into autonomic, affective, and behavioral responses1,2. We have focused on CGRP neurons in the external lateral PBN, initially because disinhibition of these neurons following ablation of hypothalamic, orexigenic agouti-related peptide (AgRP) neurons causes severe anorexia3. Subsequently, we found that activation of CGRPPBN neurons contributes to meal termination4, indicating that these neurons play a physiological role in controlling appetite. Additional studies show that CGRPPBN neurons are directly activated by neurons that reside in the nucleus of the solitary tract (NTS)5, a nucleus that receives visceral satiety signals via vagal sensory afferents6. Intriguingly, CGRPPBN neurons are also part of a spino-parabrachial pathway critical for eliciting fear responses to cutaneous pain7. CGRPPBN neurons have axonal projections that activate the central amygdala (CeA) and bed nucleus of the stria terminalis (BNST)3, forebrain nuclei implicated in both feeding and pain-related sensory processing7–9. These observations raised the question of whether subpopulations of CGRPPBN neurons relay specific stimuli to the forebrain.
We hypothesized that CGRPPBN neurons perform a common function of signaling danger, whether it be cutaneous pain or consumption of food beyond physiological capacity, and reasoned that visualizing calcium dynamics (correlates of neural activity) of individual neurons in vivo10,11 would allow us to examine whether subpopulations of neurons respond to specific stimuli. We show that the same neurons respond to feeding and various noxious or painful stimuli. CGRPPBN neurons also respond to danger signals that require learning and memory. Together with loss-of-function studies using transgenic/viral techniques, our studies show that activation of CGRPPBN neurons significantly contributes to affective-behavioral states that limit harm.
RESULTS
Coding of painful stimuli by CGRPPBN neurons
We injected adeno-associated virus (AAV) expressing Cre-dependent GCaMP6m into the lateral PBN of transgenic mice with Cre recombinase targeted to the CGRP-encoding gene (CalcaCre/+), thereby introducing a calcium-sensitive fluorophore specifically into CGRPPBN neurons (Fig. 1a). This strategy allowed us to record calcium dynamics from individual neurons in mice implanted with a graded-index lens (Fig. 1b, c). Tail pinch transiently increased calcium activity in CGRPPBN neurons (Fig. 1d and Supplementary Video 1); all 384 neurons responded to at least four out of five tail pinches during a single recording session. Most neurons exhibited increased calcium activity following a pinch to the tail or any of the four paws (Fig. 1e, f). To determine whether CGRPPBN neurons are activated by noxious stimuli on the face, we placed a warm metal rod on the lip, which activated the same neurons that responded to tail pinch (Extended Data Fig. 1a, b). Intraperitoneal injection of lipopolysaccharide (LPS), which mimics bacterial infection and causes visceral malaise, also activated pinch-responsive neurons (Fig. 1g, h and Extended Data Fig. 1c). Thus, individual CGRPPBN neurons are activated by noxious stimuli applied to all body parts examined, consistent with studies examining electrical activity from unidentified PBN neurons12,13.
Figure 1. CGRPPBN neurons are activated by painful stimuli.
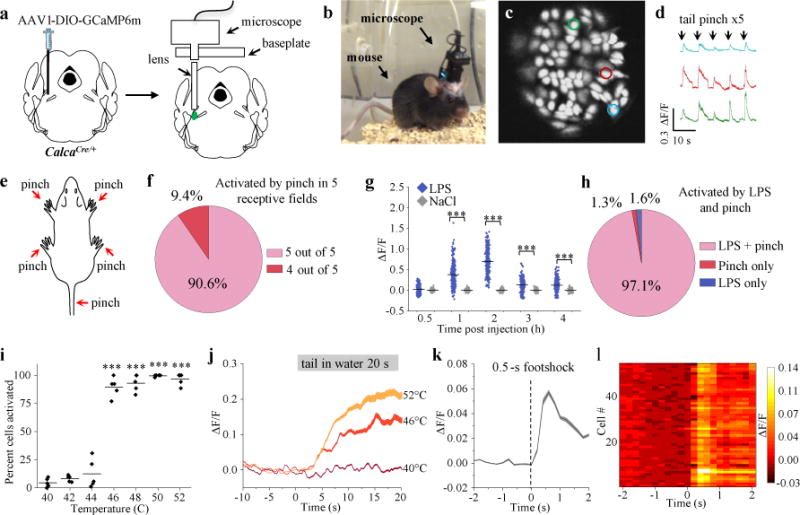
a, Schematic40 showing configuration for imaging of PBN CGRP neurons. b, Mouse with the microscope attached. c, Individual neurons identified with software. d, Calcium fluorescence activity (colors correspond to outlined neurons in panel c) of neurons recorded during tail pinch. e,f, The same neurons are activated by pinching the tail or any four paws of anesthetized mice (n = 5 mice, 384 neurons). g, Calcium activity following intraperitoneal injection of LPS or saline in awake mice (n = 6 mice, 324 neurons NaCl, 372 neurons LPS); data points are individual neurons and lines are means (Two-way ANOVA, Bonferroni’s post-hoc). Baseline was 5-min period before injection. h, Percentage of cells activated by LPS and tail pinch. i, Percentage of cells activated following placement of tail in heated water bath (40-52°C) for 20 s (n = 5 mice, 286 neurons; One-way RM ANOVA, Tukey’s post-hoc). j, Time course of calcium activity for temperature gradient study; baseline was 10-s period before water exposure. k, Calcium activity time course in response to footshock (0.5 mA, 0.5 s) in awake mice (n = 5 mice, 317 neurons); baseline was 2-s period before shock. l, Plot shows activity of neurons (rows) from a representative mouse that received footshock. Line graphs are mean ± SEM (shaded region). ΔF/F = (F-Fbaseline)/Fbaseline. ***P < 0.001. Statistical analysis in Supplementary Information.
To determine whether CGRPPBN neurons code for the intensity of noxious stimuli, we placed the tail of unconscious mice into a temperature-controlled water bath. Neurons were unresponsive to temperatures below 44°C, but most neurons were activated at 46°C and above (Fig. 1i). CGRPPBN neurons exhibited more calcium activity with increasing temperatures (Fig. 1j and Extended Data Fig. 2a-e), similar to studies examining unidentified PBN neurons12. Likewise, CGRPPBN neurons had more calcium activity in response to increasing intensities of electrical shock delivered to the tail (Extended Data Fig. 2f). In awake mice, neurons also exhibited more activity in response to increasing temperatures during a hot-plate test (Extended Data Fig. 2g, h), although they were able to mitigate some of the pain by alternating the paws making contact with the hot plate. We conclude that CGRPPBN neurons encode stimulus intensity.
In awake and anesthetized mice, electrical shock induced a rapid increase in the calcium activity of most CGRPPBN neurons (Fig. 1k, l and Extended Data Fig. 1d, e). We also measured calcium activity in oxytocin receptor-expressing neurons in the dorsal lateral PBN, a neighboring neuronal population that controls fluid intake14. Electrical shock did not rapidly affect the activity of those neurons (Extended Data Fig. 1e). The time-locked response of CGRPPBN neurons, but not neighboring PBN neurons, further implicates CGRPPBN neurons as a primary relay for pain signals7.
Response to non-painful noxious stimuli
Pain can signal ongoing harm, whereas itch is an adaptive response that may lead to avoidance of harmful plants and insects15. Although itch-responsive sensory neurons overlap with those that respond to painful stimuli15, little is known about brain circuits contributing to itch-related behaviors. We monitored calcium activity in anesthetized mice that received a subcutaneous injection of chloroquine, a drug that causes itching16. Chloroquine injection increased calcium activity in most CGRPPBN neurons (Fig. 2a).
Figure 2. CGRPPBN neurons are activated by non-painful noxious stimuli.
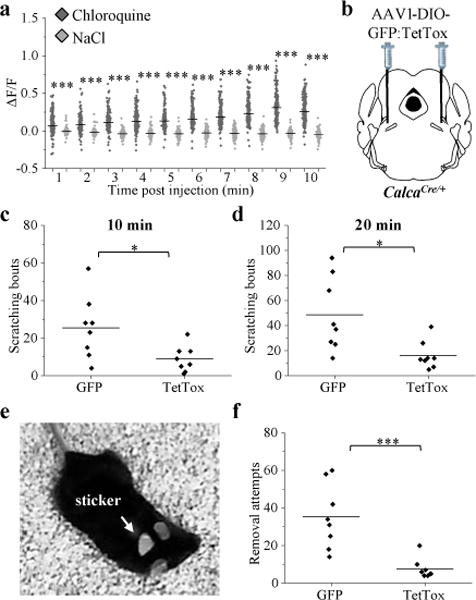
a, Calcium fluorescence activity in anesthetized mice that received subcutaneous injection of chloroquine (8 mM, 10 μl) or saline control; baseline was 2-min period before injection. Data points are individual neurons and horizontal lines are means (n = 4 mice, 231 neurons chloroquine, 216 neurons saline; Two-way ANOVA, Bonferroni’s post-hoc). b, Schematic40 showing bilateral PBN injection of CalcaCre/+ mice with AAV-DIO-TetTox:GFP to prevent neurotransmitter release from CGRP neurons or AAV-DIO-GFP control virus. c, d, Quantification of chloroquine-induced scratching bouts in GFP and TetTox mice 10 (P = 0.021) and 20 min (P = 0.011) after injection. e, Placement of sticker on neck area of mouse. f, Quantification of sticker removal attempts during the 5 min after placing the sticker on GFP and TetTox mice. Graphs (c,d,f) show data from individual mice (n = 8 per group; Student’s t-test, two-tailed); lines represent the mean. ΔF/F = (F-Fbaseline)/Fbaseline. *P < 0.05, ***P < 0.001. Statistical analysis in Supplementary Information.
To determine whether activation of CGRPPBN neurons is required for chloroquine-induced scratching, we injected an AAV expressing Cre-dependent tetanus toxin light chain (AAV-DIO-GFP:TetTox) bilaterally into the PBN of CalcaCre/+ mice (Fig. 2b). TetTox cleaves synaptobrevin, a synaptic-vesicle protein necessary for neurotransmitter release17 thereby completely preventing neurotransmitter release from Cre-expressing neurons7,18. Compared to mice injected with GFP-control virus, chloroquine-induced scratching was attenuated in mice with TetTox ‘silencing’ of CGRPPBN neurons (Fig. 2c, d). We examined whether activation of CGRPPBN neurons also contributes to scratching induced by a non-chemical stimulus by placing an adhesive sticker on the neck of mice (Fig. 2e). This manipulation activates mechanoreceptors and elicits scratching and paw swipes to remove the sticker, but is not thought to be painful19; TetTox silencing of CGRPPBN neurons attenuated sticker-removal attempts (Fig. 2f). Therefore, CGRPPBN neurons can be activated by non-painful noxious stimuli and their activation is required to elicit appropriate behavioral responses. These findings identify a specific population of PBN neurons that contribute to itch-related behavior20.
CGRP neuron activity during feeding
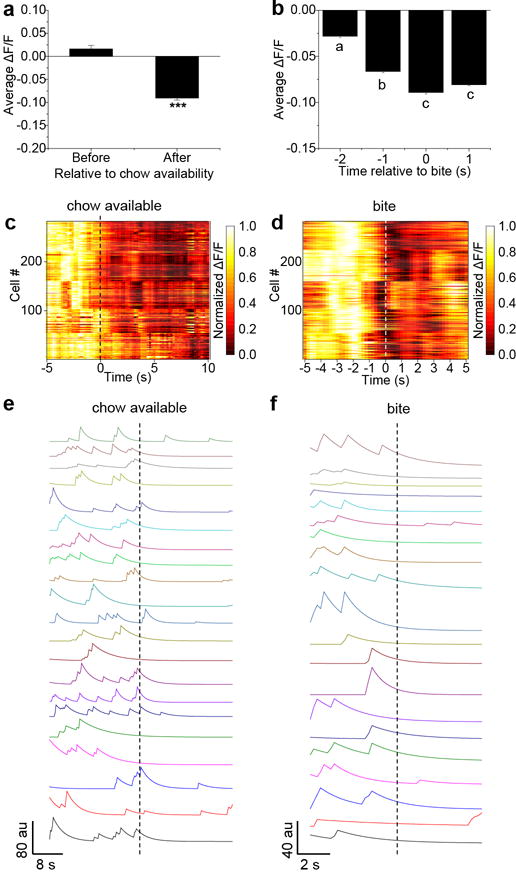
Because CGRPPBN neurons contribute to satiation4, we examined whether they are modulated by feeding-related stimuli in mice that were food-deprived overnight and then given access to their familiar chow pellet. Calcium activity of CGRPPBN neurons was rapidly inhibited when food was presented (Supplementary Video 2), even before taking the first bite (Fig. 3a, b and Extended Data Fig. 3a). We also observed rapid decreases in calcium activity before bites (Fig. 3c and Extended Data Fig. 3b). The homogeneity of inhibitory responses was notable (Extended Data Fig. 3c, d). To ensure that these effects were not due movement artifacts, we analyzed fluorescence in regions of interest lacking neurons and observed no changes before or during feeding (data not shown). We also analyzed calcium recordings using constrained nonnegative matrix factorization (CNMF)21. Individual traces extracted from CNMF analysis show that calcium transients are not synchronized, but all neurons are similarly inhibited upon presentation of food and before bites (Fig. 3d, e and Extended Data Fig. 3e, f). Since activation of CGRPPBN neurons suppresses appetite3, their inhibition should support feeding.
Figure 3. Rapid control of CGRPPBN neurons before and during feeding.
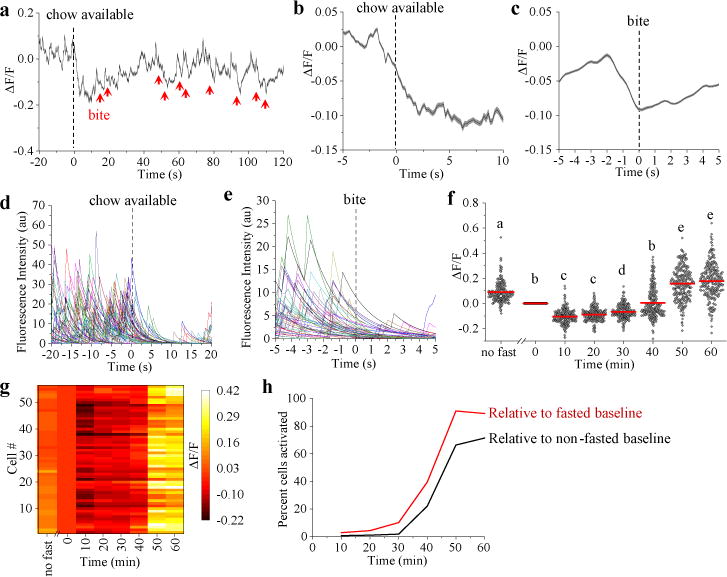
a, Average calcium fluorescence activity from a representative mouse (63 neurons) relative to chow being available (dashed line) and each bite taken (red arrows) during a fast-refeed study. b, Calcium activity relative to placement of chow in cage (n = 5 mice, 282 neurons). Data are mean ± SEM (shaded region). c, Calcium activity relative to taking a bite. Multiple bites were analyzed and averaged for each neuron (n = 5 mice, 282 neurons). Data are mean ± SEM (shaded region). d,e Forty-seven neuron traces from a representative mouse extracted using CNMF analysis, relative to chow availability (d) and to a bite (e). f, Calcium activity after refeeding. Data are normalized to time-point 0 min, which was a 60-s baseline before food availability; “no fast’ data was recorded 24 h before fast. Data points are individual neurons and the lines are means (n = 5 mice, 282 neurons; One-way RM ANOVA, Tukey’s post-hoc). Dissimilar letters above columns of data points indicate statistical differences between time points. g, Calcium activity of neurons from a representative mouse after refeeding. h, Percentage of neurons activated relative to fasted or non-fasted baseline conditions. ΔF/F = (F-Fbaseline)/Fbaseline. Statistical analysis in Supplementary Information.
We also examined calcium activity as feeding progressed. Food deprivation lowered the activity of CGRPPBN neurons relative to the sated state (Fig. 3f), consistent with increased inhibitory input from AgRP neurons, which are activated during food deprivation22, and/or decreased excitatory input from anorexigenic neurons in the NTS4,5. After 30 min of feeding, neurons became more active (Fig. 3f), which corresponded to a decrease in food intake compared to the first 30 min (0-30 min, 0.71 ± 0.04 g, 30-60 min, 0.22 ± 0.02 g; mean ± SEM). In general, these neurons became more active as feeding progressed (Fig. 3g), with the majority of neurons exhibiting more calcium activity relative to either non-fasted or fasted baseline conditions (Fig. 3h). All neurons that were analyzed in the feeding study also responded to tail pinch (data not shown).
Coding of food neophobia
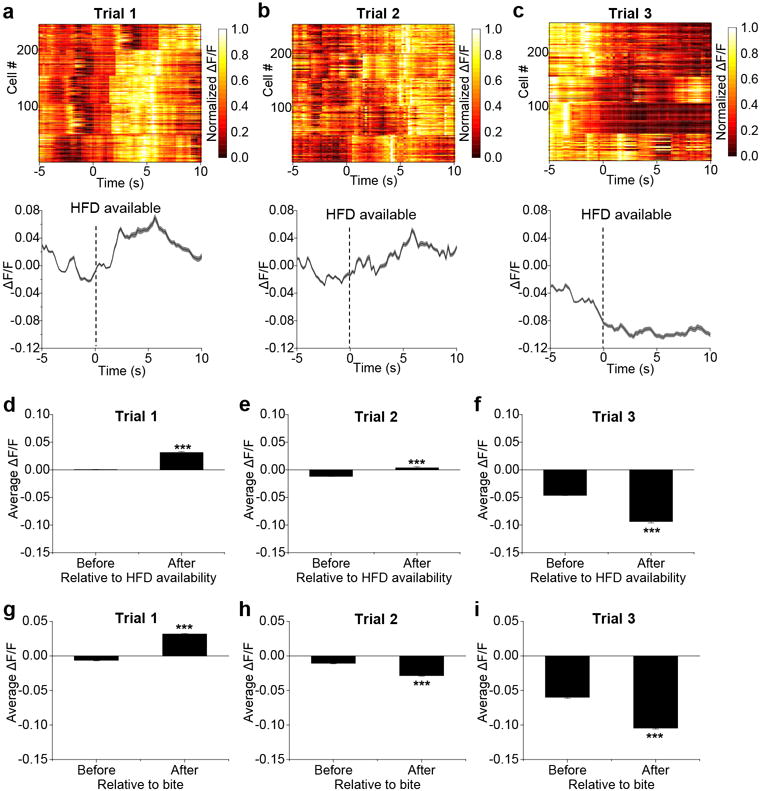
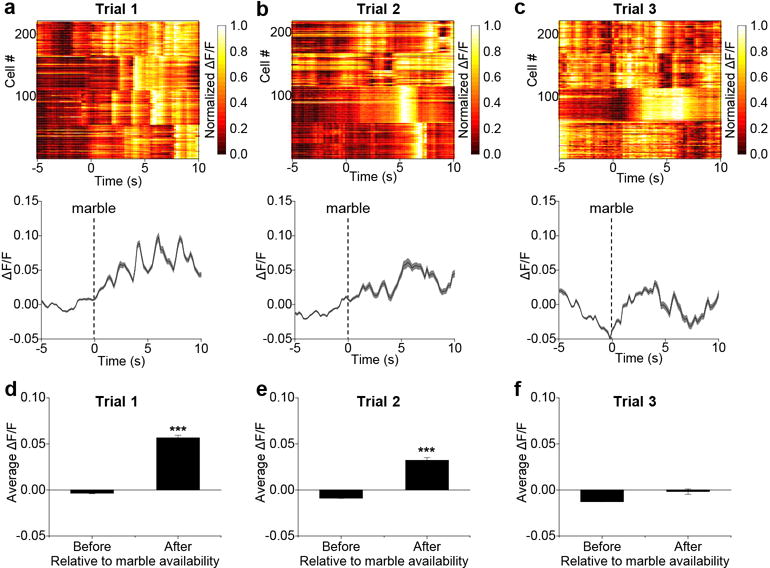
Given that CGRPPBN neurons respond to anticipatory signals before food consumption, we asked whether they respond to other complex sensory inputs by examining the neophobia response to a novel food, an adaptive trait that limits consumption of unfamiliar, potentially toxic foods. In contrast to their response to the familiar diet, we observed increased calcium activity when mice were presented with a novel, high-fat food pellet (Extended Data Fig. 4a-f and Supplementary Video 3). CGRPPBN neurons were also activated following each bite during the first trial (Fig. 4a and Extended Data Fig. 4g). However, after acclimation, CGRPPBN neurons became inhibited before and during consumption of the palatable diet (Fig. 4b,c and Extended Data Fig. 4h,i), similar to consumption of their normal diet. The change in the pattern of calcium activity corresponded with a decreased latency to begin consumption during the last trial (20.4 ± 4.1 s; mean ± SEM) compared to the first trial (115.2 ± 16.0 s; mean ± SEM). We also monitored calcium activity in response to an inedible novel object (marble). Neurons were activated upon first presentation (Supplementary Video 4), a response that dissipated as mice became acclimated to the object (Extended Data Fig. 5). After acclimation, neuronal activity did not decline as with the palatable diet, likely because food is appetitive whereas the marble becomes neutral after acclimation.
Figure 4. CGRPPBN neurons are activated in response to a novel and palatable high-fat diet.
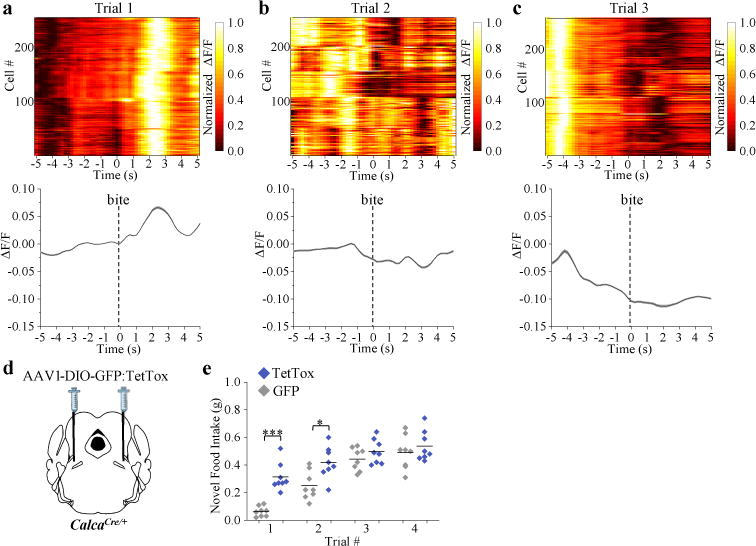
a-c, Calcium fluorescence activity in response to taking a bite from a novel, high-fat diet (HFD) pellet. Line graphs are means ± SEM (shaded region) for raw ΔF/F values and plots show normalized ΔF/F values for neurons (rows) of all experimental mice (trial 1, n = 5 mice, 247 neurons; trial 2, n = 5 mice, 244 neurons; trial 3, n = 5 mice, 254 neurons). Test trials were conducted on consecutive days. d, Schematic40 showing bilateral PBN injection of CalcaCre/+ mice with AAV-DIO-TetTox:GFP (to silence CGRP neurons) or AAV-DIO-GFP control virus. e, Non-food-deprived mice received 20 min access to a novel HFD pellet on four consecutive days; data points are individual mice (8 mice per group; Two-way RM ANOVA, Bonferroni’s post-hoc). ΔF/F = (F-Fbaseline)/Fbaseline, baseline was a 60-s period before HFD pellet was presented. ***P < 0.001, *P < 0.05. Statistical analysis in Supplementary Information.
We examined the necessity of CGRPPBN neurons for behavioral expression of food neophobia by silencing them with TetTox (Fig. 4d). Compared to control mice, TetTox-injected mice exhibited an attenuated food neophobia response, which was apparent during the first two exposures to a novel palatable diet (Fig. 4e), indicating that CGRPPBN neurons contribute to food neophobia. This result is consistent with attenuation of food neophobia caused by lesions of the lateral PBN23.
Reactivation of CGRPPBN neurons by fear memory
With food neophobia, fear behavior dissipates after repeated exposures, suggesting that a positive memory was formed and that CGRPPBN neurons are sensitive to learning processes. We postulated that CGRPPBN neurons might also respond to a negative memory, such that exposure to a stimulus paired with a painful event would lead to activation of CGRPPBN neurons by that conditioned stimulus.
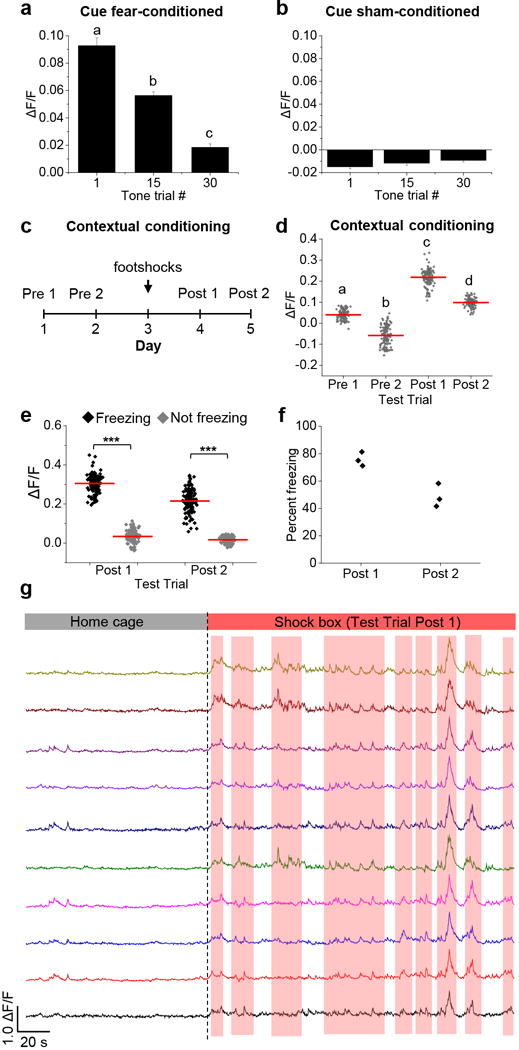
Mice were subjected to footshock/tone conditioning, an experimental paradigm in which mice learn to associate a neutral stimulus (tone) with an electrical footshock (Fig. 5a). These mice formed a fear memory, made evident by the fact that the tone alone was sufficient to elicit ‘freezing’ (rodent fear response) the next day (Fig. 5b). After conditioning, CGRPPBN neurons were activated during the 10-s tone presentation (Fig. 5c and Extended Data Fig. 6a). Neuronal activation became less robust during extinction with repeated presentations of the tone in the absence of footshock (Fig. 5d, e and Extended Data Fig. 6a), which corresponded with a decrease in freezing behavior (Fig. 5b). Mice that did not receive footshocks with the tone during conditioning did not exhibit tone-induced freezing or increased calcium activity in CGRPPBN neurons (Fig. 5f-j and Extended Data Fig. 6b). We also examined whether non-specific contextual cues can activate CGRPPBN neurons in mice that underwent footshock fear conditioning (Extended Data Fig. 6c). Compared to test trials before conditioning, placing mice in the shock chamber after conditioning was sufficient to increase calcium activity in CGRPPBN neurons (Extended Data Fig. 6d-g). Therefore, in addition to being a primary relay of pain signals necessary and sufficient to form a fear memory7,24, CGRPPBN neurons also become activated during recall of that aversive memory.
Figure 5. CGRPPBN neurons are activated during recall of a pain memory.
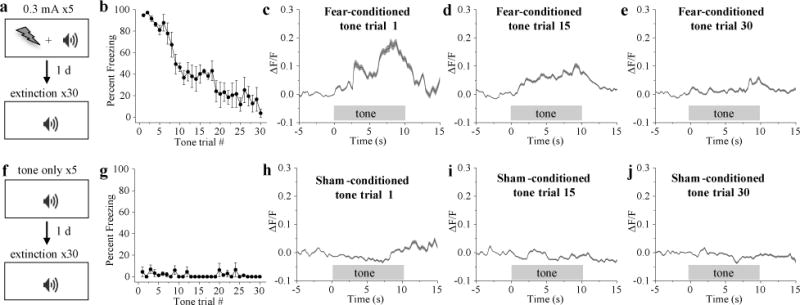
a, Fear-conditioning paradigm in which mice received a foot shock (0.3 mA; 0.5 s duration) that co-terminated with a 10-s tone (5 pairings). b, Percent of time spent freezing (fear-conditioned mice) in response to 10-s tone presentations during the extinction training sessions. c-e, Calcium fluorescence activity of fear-conditioned mice during presentation of tone trial 1, 15, and 30. f, Sham-conditioning paradigm. g, Percent of time spent freezing (sham-conditioned mice) in response to 10-s tone presentations during the extinction training sessions. h-j, Calcium activity of sham-conditioned mice during presentation of tone trial 1, 15, and 30. Fear-conditioned mice, n = 4 mice, 214 neurons; sham-conditioned mice, n = 4 mice, 169 neurons. Line graphs are mean ± SEM (shaded region). ΔF/F = (F-Fbaseline)/Fbaseline; baseline was 5-s period before tone presentation. Statistical analysis in Supplementary Information.
To examine whether activation of CGRPPBN neurons contributes to learned behavioral fear responses, mice underwent footshock fear conditioning (Fig. 6a) followed by CGRPPBN neuron silencing with TetTox after the fear memory had been formed (Fig. 6b). We used greater shock intensities than in the previous experiment to form a more robust fear memory because extinction training occurred weeks after conditioning to allow sufficient time for TetTox expression. Compared to GFP control, mice with TetTox silencing of CGRPPBN neurons rapidly extinguished their freezing response during repeated presentations of the tone without footshocks (Fig. 6c). By the second fear-extinction training session, fear-conditioned TetTox mice exhibited minimal freezing behavior (Fig. 6d), similar to control mice that did not undergo fear conditioning (Fig. 6e-h). Conversely, fear-conditioned GFP-control mice continued to freeze in response to the tone during the second extinction training session (Fig. 6d). Thus, activation of CGRPPBN neurons significantly contributes to fear responses during recall of an aversive memory.
Figure 6. Silencing of CGRPPBN neurons attenuates fear response during recall of pain memory.
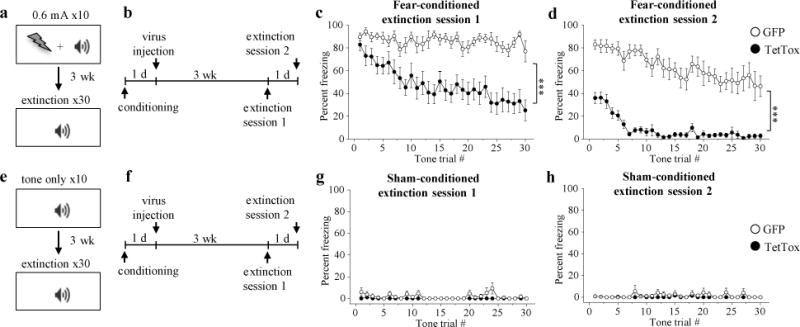
a, Fear-conditioning paradigm in which mice received a footshock (0.6 mA; 0.5-s duration) that co-terminated with a 10-s tone (10 pairings). b, Timeline for experiments and surgeries of mice that underwent fear conditioning. After fear-conditioning, mice received bilateral PBN injections of AAV-DIO-TetTox:GFP to inhibit CGRP neurons or AAV-DIO-GFP control virus. c, d, Percentage of time spent freezing (fear-conditioned mice) in response to 10-s tone presentations during extinction sessions (n = 12 per group; Two-way RM ANOVA). e, Sham-conditioning paradigm. f, PBN virus injections after sham conditioning. g, h, Percentage of time spent freezing (sham-conditioned mice) in response to 10-s tone presentations during extinction training sessions (n = 6 per group). Line graphs are mean ± SEM. ***P < 0.001. Statistical analysis in Supplementary Information.
DISCUSSION
Here we show that CGRPPBN neurons become activated in response to danger signals of diverse sensory modalities – visceral and cutaneous pain (chemical, mechanical, thermal, electrical), itch, and meal-related satiety signals – that involve various ascending sensory pathways (trigeminal, spinal, vagal). CGRPPBN neurons are also activated by danger signals that require cognition as shown by the food-neophobia and fear-conditioning assays, and TetTox loss-of-function studies reveal that these neurons contribute to both innate and learned fear behaviors. Thus, CGRPPBN neurons convey negative valence, while parallel pathways likely provide information regarding sensory modality and stimulus origin25 to help elicit appropriate responses. In addition to modalities examined here, we hypothesize that CGRPPBN neurons respond to gustatory26, olfactory27, auditory28, vestibular29, and other visceral stimuli30.
Calcium recordings show that CGRPPBN neurons as a population are activated or inhibited in response to (putative) salient stimuli. This arrangement is observed in AgRP ‘hunger’ neurons22 and in that case separate projections to distinct brain regions contribute to various aspects of hunger-related behaviors and physiology31–33. CGRPPBN neurons project to the CeA and BNST3,7, nuclei that mediate behavioral and physiological responses to ingestive and fear-related stimuli7,8,34. Downstream CeA neurons express the CGRP receptor7, and a subpopulation of those neurons co-express protein kinase C-δ7,35, but the identity of downstream BNST neurons is unknown. We postulate that the CeA and BNST contribute to different aspects of behavior and/or alter behaviors over different timescales. Behaviors may also be tuned by the magnitude and duration of CGRPPBN neuronal activation, which could lead to differential activation of postsynaptic targets.
Although we focused on aversive stimuli, pain-responsive CGRPPBN neurons also respond to feeding-related stimuli. CGRPPBN neurons are rapidly inhibited before food consumption, indicating that there is bidirectional control of their activity and revealing that they also participate in a normal, non-aversive behavior. Inhibition from AgRP neurons or decreased input from anorexigenic neurons in the NTS5 likely dampens CGRPPBN neuron activity during fasting4, but the decreases in calcium activity during food consumption are unlikely to come from AgRP neurons because they are inactive during feeding22,36. Because CGRPPBN neurons transmit potential danger signals, their inhibition during starvation might contribute to adaptive behaviors, such as increased risk taking to acquire food31, in addition to permitting increased food intake.
Numerous forebrain projections to the PBN have been described37,38 that are candidates for control of CGRPPBN neurons in response sensory signals requiring complex processing during neophobia and learning. Interestingly, we observed similar behavioral responses between fear-conditioned mice with either intact or inhibited CGRPPBN neurons during the first tone trial of extinction training, but the TetTox-treated mice extinguished their fear memory faster. This result suggests that activation of other brain areas is initially sufficient to elicit a learned fear response, but CGRPPBN neuronal activation is critical for maintaining a persistent fear state and retarding extinction. Current fear-extinction hypotheses suggest that extinction of a fear memory involves weakening of the original associative memory and/or consolidation of a newly acquired “safe” memory that overrides the original fear memory39. Our findings are congruent with either interpretation, since activation of CGRPPBN neurons could strengthen the original fear memory or preclude formation of a “safe” memory.
We expect that future studies will reveal how CGRPPBN neurons are rapidly controlled by various neuronal inputs and shed light on how core brainstem circuits are recruited to produce complex behaviors. These endeavors may ultimately lead to a better understanding of how CGRPPBN neurons alter affective-motivational behaviors associated with transient7 and chronic threats40, and mental disorders that might involve dysregulation of upstream neurocircuitry.
METHODS
All experimental protocols were conducted according to US National Institutes of Health guidelines for animal research and approved by the Institutional Animal Care and Use Committee at the University of Washington.
Animals
Heterozygous CalcaCre/+ mice and OxtrCre/+ mice (C57Bl/6 background) were generated and maintained as previously described3,14. Male mice, ranging from 3-6 months of age, were used for all studies. Mice from each litter were randomly assigned into treatment groups. Following stereotaxic surgery, mice were singly housed for at least three weeks prior to and during experimentation, with ad libitum access (unless noted otherwise) to standard chow diet (LabDiet 5053) in temperature- and humidity-controlled facilities with 12-h light/dark cycles. Behavioral experiments were conducted during the light cycle, starting at approximately 3 h into the light cycle.
Virus production
AAV1-CBA-DIO-GCaMP6m, AAV1-CBA-DIO-GFP:TetTox, and AAV1-EF1a-DIO-GFP viral vectors were produced by transfecting HEK cells and then purifying cell extracts by pelleting through sucrose and by CsCl-gradient ultracentrifugation. Final pellets were suspended in 0.1 M PBS. Viruses were titered as described4. In pilot experiments, we injected varying concentrations of AAV1-CBA-DIO-GCaMP6m, examined histological sections four weeks after virus injection, and then chose the highest virus titer that produced GCaMP6m that was limited to the soma.
Stereotaxic surgeries
All mice were anesthetized with 1.5 to 2.0% isoflurane (mixed with 0.8 L per min of oxygen) for stereotaxic surgeries and virus injections. For calcium imaging, CalcaCre/+ mice received a unilateral PBN injection AAV1-DIO-GCaMP6m (0.5 μl). Virus was injected using a glass capillary attached to a Nanoject (Drummond, catalogue #3-00-204) using the following coordinates: −4.65 mm posterior to bregma, −1.30 mm lateral from midline, and −2.90 mm ventral to dura. These coordinates were verified with Fluoro-Gold (Sigma-Aldrich, catalogue #39286) injections in non-experimental mice, which produced Fluoro-Gold labeling that was restricted to the lateral PBN. AAV1-DIO-GFP and AAV1-DIO-GFP:TetTox viruses (for loss-of-function studies) were injected bilaterally.
Mice were prepared for calcium imaging as described41. Briefly, three weeks after AAV1-CBA-DIO-GCaMP6m virus injection, CalcaCre/+ mice were anesthetized (as described above) and implanted with a microendoscope lens (6.1 mm length, 0.5 mm diameter; Inscopix, catalogue #100-000588) with assistance of a ProView implant kit (Inscopix, catalogue #100-000754) that allowed for visualizing the fluorescent activity during the lens implant. The lens was targeted to be ~200–300 μm above the neurons using the following coordinates: −4.80 mm posterior to bregma, −1.70 mm lateral from midline, and −3.20 to −3.40 mm ventral to skull surface. Some lenses were purposely implanted deeper to record from ventral CGRPPBN neurons. To visualize oxytocin receptor neurons, the lens was targeted more dorsal and medial: −4.80 mm posterior to bregma, −1.40 mm lateral from midline, and −3.00 ventral to skull surface. One week after lens implantation, mice were anesthetized and a baseplate (Inscopix, catalogue #100-000279) was implanted above the lens. The baseplate provides an interface for attaching the miniature microscope during calcium-imaging experiments, but during other times a baseplate cover (Inscopix, catalogue #100-000241) was attached to prevent damage to the microendoscope lens. Post-hoc histological analysis showed variability in the lens placement relative to the rostral-caudal ext ent of the PBN, suggesting that CGRPPBN neurons in different parts of the PBN were sampled (Extended Data Fig. 7). Out of approximately 60 mice that were injected with GCaMP6m virus, 20 had successful lens implant and were used for studies.
Calcium imaging studies
All calcium imaging was recorded at 5 frames per second, 200-ms exposure time, and 10-30% LED power using a miniature microscope from Inscopix (nVista). The recording parameters were based on pilot studies that demonstrated minimal photo-bleaching using these settings. In our pilot studies we also recorded calcium activity with higher frame-rates (10 and 15 frames per second), but we were unable to find an optimal virus titer that produced sufficient fluorescent activity (to record at high frame-rates) while maintaining the ability to discriminate individual neurons. CGRPPBN neurons are densely-packed in a small brain area and higher GCaMP6m virus titers produced dense dendritic labeling that overlapped with the soma of neighboring neurons. Ethovision (Noldus, XT 10) was used to trigger and synchronize behavioral video recordings with calcium recordings.
Order of experiments
In one cohort of CalcaCre/+ mice (n = 5), fast and refeeding studies were conducted first, followed by neophobia studies, and then studies involving noxious stimuli (pinch, shock, LPS, itch, and temperature studies). A second cohort of naïve CalcaCre/+ mice were used for fear conditioning studies (n = 4 per group). A third group of CalcaCre/+ mice (n = 3) were used to examine graded shock intensities. OxtrCre/+ mice (n = 3) were used for a shock study. A fourth group of CalcaCre/+ mice (n = 3) were used for the hot-plate test and contextual fear conditioning.
Fasting-refeeding
Feeding studies (including food neophobia experiments) were conducted prior to the pain studies. Mice were acclimated to handling and attachment of the miniature microscope for approximately one hour per day for two weeks. After the acclimation period, mice were food deprived overnight, and a standard chow pellet (their normal food) was placed on the floor of their cage following a 1-min baseline recording period. Calcium activity was recorded continuously for 5 min after receiving access to food, followed by 2-min duration recordings 10, 20, 30, 40, 50, and 60 min after refeeding. For analysis of fluorescent activity relative to taking a bite from the food pellet, we analyzed bites during the first 2 min of fasting-refeeding, and averaged these values for each neuron. The timing of bites was confirmed using visual confirmation of the behavioral videos.
Food neophobia
After a baseline recording period (1 min), non-food-deprived mice were given access to a novel, palatable food pellet (45 kcal% high-fat diet; Research Diets, catalogue #D12451). Calcium activity was recorded continuously for 10 min after receiving access to the novel food. Mice had access to the food pellet for 20 min. Bites were confirmed using visual confirmation of the behavioral videos. Test trials were conducted on consecutive days.
Novel object
We used the same experimental design as with the food neophobia studies, except a dark blue marble (1 cm diameter) was placed in the cage instead of a novel food pellet.
Cutaneous pain
For analysis of calcium activity in response to pinch, mice were anaesthetized with 1.5 to 2.0% isoflurane (mixed with 0.8 L per min of oxygen). Once the calcium activity was stable under baseline conditions, mice received five tail pinches using forceps (5-s duration, 2-min interval between pinches). In a separate recording session, we analyzed calcium activity in response to pinch of the tail and paws (5-s duration, 2-min interval between pinches). In another recording session, the tail was placed in a temperature-controlled water bath ranging from 40°C to 52°C (20-s duration, 3-min interval between each temperature gradient). Calcium responses to the tail being placed in 56°C and 60°C water (10-s duration, 5-min interval between trials) were examined on a separate day. To examine calcium responses to facial stimuli, a heated metal rod (the probing surface area was ~1 cm2) at ~52°C (the metal rod was in 52°C water for 10 min) was placed on the lip area for 20 s. Pinches and thermal stimuli were manually synchronized to calcium recordings by applying the stimulus at a designated time during the recording. Mice underwent a 0.5-mA foot shock (0.5-s duration) that was synchronized to the calcium imaging recordings by triggering the shock with the calcium imaging acquisition software (Inscopix, nVista HD) and Ethovision (Noldus, XT 10). For tail shock, electrode gel (Spectra 360, Parker Laboratories) was placed on the tail and the positive and negative leads (18-ga copper wire) from an electrical stimulator (model #A320D, World Precision Instruments) were placed 1 cm apart. A TTL pulse to the stimulator was used to synchronize calcium recordings with delivery of an electrical current (2-6 mA, 2 s duration). The hot-plate test involved removing the mouse from its home cage and placing it onto a pre-heated aluminum plate (15 × 15 cm) that is enclosed with a transparent Plexiglas chamber that prevents the mouse from escaping (Coulbourne Instruments). We examined temperatures between 40°C to 56°C (20-s duration, 3-min interval between each temperature gradient, animal placed in home cage during 3-min interval). Except for the footshock and hot-plate studies, all experiments were conducted under anesthesia. Recording sessions were conducted once every other day.
Visceral pain
After a 5-min baseline recording period, awake and freely-moving mice received an i.p. injection of lipopolysaccharide (LPS; 50 μg/kg; Calbiochem, catalogue #437650). Calcium activity was recorded 0.5, 1, 2, 3, and 4 h after injection (2 min duration for each time point). Using a similar experimental design, mice received a control saline (0.9%) injection on a separate day.
Chloroquine-induced itch
Mice were anaesthetized with 1.5 to 2.0% isoflurane (mixed with 0.8 L per min of oxygen). Once the calcium activity was stable under baseline conditions, mice received either a chloroquine (10 μl; 8 mM dissolved in 0.9% saline; Acros Organics) or saline control injection with a Hamilton syringe (26s ga; catalogue #204001). After injection, calcium activity was monitored for 10 s every minute for 10 min.
Footshock fear conditioning
A separate cohort of animals was used for the fear-conditioning studies. After acclimation to handling and to the miniature microscope, mice underwent foot-shock fear conditioning in shock chamber (Med Associates), which involved 5 cue pairings (3 kHz, 80 dB, 10-s duration) that co-terminated with a foot shock (0.3 mA, 0.5-s duration, randomized intertrial interval with a range of 70-140 s and average of 90 s). Sham-conditioned control mice did not receive a foot shock. One week later, mice were fitted with the miniature microscope for calcium recordings, and underwent fear extinction in a different but similar-sized chamber (white walls and floor instead of shock chamber that had Plexiglas walls and shock grid floor). During the extinction training session, mice received 30 tone cues (in the absence of foot shock) using the same intertrial interval parameters as during conditioning. A TTL pulse to the shock chamber (Med Associates) was used to trigger and synchronize tones with calcium recordings. Time spent freezing (during the tone), defined as any movement of the head or body, was manually scored with a stopwatch (experimenter was blind to treatments). For contextual fear conditioning, mice were placed in the shock chamber for 15 min on two consecutive days before conditioning to measure baseline calcium activity. On the third day, mice were placed in the shock chamber and received 10 foot shocks (0.6 mA, 0.5-s duration, randomized intertrial interval with a range of 70-140 s and average of 90 s). On two consecutive days after conditioning, mice were placed in the same shock chamber (shock grids exposed) for 15min each day to measure calcium activity after fear conditioning. Calcium activity was recorded during the first 5 min of each trial.
Calcium-image processing
Calcium recording files were down-sampled (spatial binning factor of 2) to reduce processing time and file size, followed by correction of rigid brain movement using the motion correction application (Inscopix, Mosaic v1.2). For analysis of recordings conducted in anaesthetized mice, individual component analysis and principle component analysis (ICA/PCA) applications were used to identify individual cells and to extract their respective calcium traces. Because the microendoscope lens was implanted in between the cerebellum and brainstem, this resulted in a slightly unstable lens and non-rigid motion that could not be corrected with recordings from awake mice. Consequently, we were unable to use ICA/PCA to extract traces from individual cells, manually draw small regions of interest to extract calcium traces from cells. Raw traces were converted to ΔF/F (F-Fbaseline average/Fbaseline average), where F was the fluorescence at any given time-point and Fbaseline average was the average fluorescence during a designated baseline period. Additional analyses were conducted using CNMF for microendoscopic data21.
CGRPPBN TetTox studies
Chloroquine-induced scratching
Approximately one month after bilateral PBN injections of AAV1-DIO-GFP:TetTox or AAV1-DIO-GFP, mice were habituated to the experimental paradigm for two consecutive days. On the test day, mice were placed in a cage with a small amount of bedding for 40 min, followed by a subcutaneous injection of chloroquine (10 μl, 8 mM in 0.9% saline) in the nape of the neck while scruffing the animal. After returning the animal to the cage, behavior was videotaped for 20 min and scratching bouts were analyzed. One or many consecutive scratches with any paw were counted as a single bout. Scratches interrupted by the animal licking the paw used for scratching or putting the paw back on the floor of the cage were counted as separate bouts.
Adhesive sticker removal test
The same experimental cohort of animals that were used to examine chloroquine-induced scratching were also used to determine whether inhibition of CGRPPBN neurons prevents sticker-induced scratching. One week after the itch study, mice were placed in a cage with a small amount of bedding for 5 min before a red adhesive sticker (1/4 of a Shamrock brand dot label; catalogue #SDL-75-21 dark red) was placed on the back of the animal (near the nape of the neck). After returning the animal to the cage, behavior was videotaped for 5 min. This manipulation induced scratching (similar to chloroquine injection) and behind-the-ear swipes with the front paw(s). A scratching bout or a behind-the-ear swipe was counted as a single removal attempt.
Food neophobia
One group of CalcaCre/+ mice received bilateral PBN injections of AAV1-DIO-GFP:TetTox to inhibit CGRPPBN neurons, whereas a second group received control injections of AAV1-DIO-GFP. Three weeks after surgery, including a one-week period of acclimation to handling, non-food-deprived mice were presented with a novel and palatable food pellet (45 kcal% high-fat diet) for 20 min. This study was repeated three more times on consecutive days. Mice were not food deprived prior to the study and they had ad libitum access to standard chow and water during the experiment.
Fear conditioning
Prior to fear conditioning or sham conditioning, mice were randomly assigned to the following groups: TetTox fear conditioning, GFP fear conditioning, TetTox sham conditioning, and GFP sham conditioning. Mice in fear conditioning groups underwent foot-shock fear conditioning, which involved 10 tone pairings (3 kHz, 80 dB, 10-s duration) that co-terminated with a foot shock (0.6 mA, 0.5-s duration, randomized intertrial interval with a range of 70-140 s and average of 90 s). Sham-conditioned control mice did not receive a foot shock. After the conditioning phase, mice received bilateral PBN injections of AAV1-DIO-GFP:TetTox or AAV1-DIO-GFP (based on their assignment prior to conditioning). Three weeks later, mice underwent fear extinction training (as described in the calcium imaging study), followed by a second extinction training session the following day. We chose this conditioning paradigm (0.6 mA shock/10 pairings compared to 0.3 mA/5 pairings in calcium imaging study) because the extinction training occurred 3 wk after conditioning (as opposed to 1 d for calcium imaging study) to allow for expression of the virus.
Statistical analysis
Data were analyzed using OriginPro 2016 (OriginLab). For calcium-imaging studies, sample sizes were based on published studies22,36. Neurons were considered activated if stimuli produced an increase in fluorescent activity three standard deviations above baseline fluorescent activity. For CGRPPBN neuron inhibition studies, post-hoc histological analysis showed bilateral transduction of CGRPPBN neurons with GFP:TetTox or GFP; therefore, all animals were included for final analyses. For graphs comparing multiple treatments (one time-point), we utilized repeated-measures one-way ANOVA tests, with Tukey’s post-hoc multiple comparisons test. Data sets with multiple treatments and time-points were analyzed with repeated-measures two-way ANOVA tests (time repeated factor), followed by Bonferroni’s post-hoc tests. Two-tailed Student’s t-tests were used where appropriate.
Data availability
The datasets generated during the current study are available from the corresponding author on reasonable request.
Extended Data
Extended Data Figure 1. CGRPPBN neurons are activated by facial pain and electrical shock.
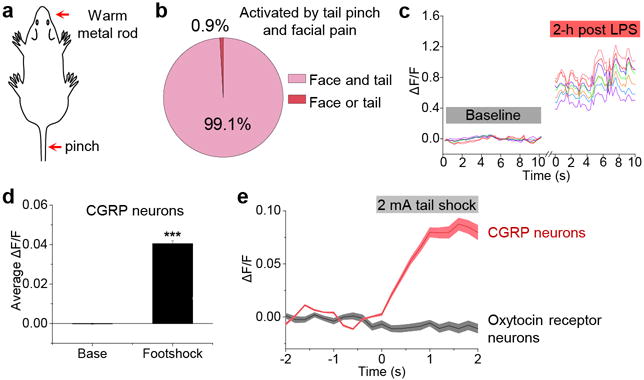
a, b, Percentage of cells activated by tail pinch and placing a warm metal rod on the lip of anesthetized mice (n = 6 mice, 397 neurons). c, Representative calcium traces of the same individual CGRP neurons during baseline and 2-h post LPS injection in awake mice. d, Average calcium fluorescence activity 1 s before (Base) and during a foot shock (0.5 mA, 0.5 s duration; n = 5 mice, 317 neurons); bar graph is mean ± SEM. e, Calcium activity time course of CGRP neurons (n = 3 mice, 158 neurons) and Oxytocin receptor neurons (n = 3 mice, 65 neurons) in response to electrical tail shock (2 mA, 2 s duration) in anesthetized mice; baseline was 2-s period before shock. AAV-DIO-GCaMP6m was injected into the lateral PBN of CalcaCre/+ and OxtrCre/+ mice. For imaging oxytocin receptor neurons, the lens was placed over the dorsal lateral PBN, in contrast to external lateral PBN targeting for CGRP neurons. ΔF/F = (F-Fbaseline)/Fbaseline. Line graph is mean ± SEM (shaded region). ***P < 0.001, paired Student’s t-test (two-tailed). Related to Figure 1. Statistical analysis in Supplementary Information.
Extended Data Figure 2. CGRPPBN neurons encode stimulus intensity.
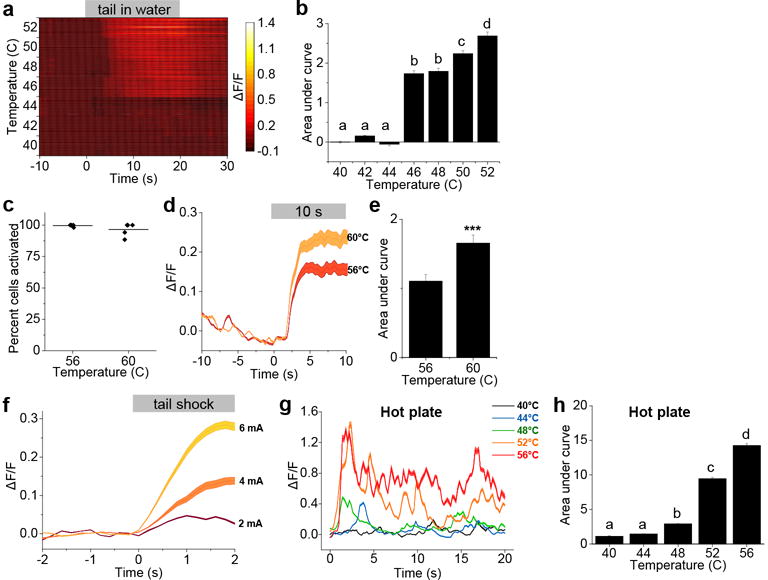
a, Plot shows calcium fluorescence activity of neurons (anaesthetized mouse) following placement of tail in a water bath ranging from 40°C to 52°C (n = 56 neurons). b, Area under the curve of calcium activity following placement of tail in 40-52°C water bath (n = 5 mice, 286 neurons). c, Percentage of cells activated in 56 or 60°C water in anaesthetized mice; data points are individual mice (n = 4 mice) and line represents mean. d, Time course and peak neuronal responses to tail being placed in 56 or 60°C water (n = 4 mice, 111 neurons). Baseline was 10-s period before placing tail in water. e, Area under the curve of calcium activity following placement of tail in water bath. f, Time course and peak neuronal responses to tail receiving graded intensities of electrical current (2-6 mA, 2 s duration; n = 3 mice, 105 neurons) in anaesthetized mice. Baseline was 2-s period before shock. g, Time course and peak calcium activity from an awake mouse (46 neurons) during exposure to a hot plate (40-56°C, 20-s duration). Baseline was 2-min period in home cage before the hot-plate test. h, Area under the curve of calcium activity following placement of awake mice onto the hot plate (n = 3 mice, 126 neurons). Bar graphs are mean ± SEM; line graphs are mean ± SEM (shaded region). ***P < 0.001; dissimilar letters above columns indicate statistical differences between treatments; b, h, One-way RM ANOVA, Tukey’s post-hoc; e, paired Student’s t-test (two-tailed). ΔF/F = (F-Fbaseline)/Fbaseline. Related to Figure 1. Statistical analysis in Supplementary Information.
Extended Data Figure 3. Additional analysis of calcium imaging from fast-refeed study.
a, Average calcium fluorescence activity 5 s before and 5 s after presentation of standard chow pellet (n = 5 mice, 282 neurons); mean ± SEM. b, Calcium activity relative to taking a bite (n = 5 mice, 286 neurons). c, d, Plot showing calcium activity (normalized ΔF/F) relative to placement of chow in cage (c) and relative to bite (d). Plots show neurons (rows) from all experimental mice (n = 5 mice, 282 neurons). e, f, Representative calcium traces extracted using CNMF analysis, relative to chow availability (e) and taking a bite (f). ΔF/F = (F-Fbaseline)/Fbaseline, baseline was 60-s period before chow availability for all data shown. ***P < 0.001; dissimilar letters above columns indicate statistical differences between time points; a, paired Student’s t-test (two-tailed); c, One-way RM ANOVA, Tukey’s post-hoc. Related to Figure 3. Statistical analysis in Supplementary Information.
Extended Data Figure 4. Additional analysis of calcium imaging from food-neophobia studies.
a-c, Change in calcium fluorescence activity in response to a novel, high-fat diet (HFD) pellet. Test trials were conducted on consecutive days. Line graphs are means ± SEM (shaded region) for raw ΔF/F values and plots show normalized ΔF/F values for neurons (rows) of all experimental mice. d-f, Average calcium activity 5 s before and 5 s after presentation of HFD pellet during three test trials. g-i, Average calcium activity 5 s before and 5 s after relative to taking a bite from the HFD pellet. Bar graphs are means ± SEM. Test trial 1, n = 5 mice, 247 neurons; trial 2, n = 5 mice, 244 neurons; trial 3, n = 5 mice, 254 neurons. ΔF/F = (F-Fbaseline)/Fbaseline, baseline was 60-s period before HFD pellet was presented. ***P < 0.001; d-i, paired Student’s t-test (two-tailed). Related to Figure 4. Statistical analysis in Supplementary Information.
Extended Data Figure 5. CGRPPBN neurons are activated during exposure to a novel marble.
a-c, Change in calcium activity in response to a marble being placed in home cage. Line graphs are means ± SEM (shaded region) for raw ΔF/F values and plots show normalized ΔF/F values for neurons (rows) of all experimental mice. d-f, Average calcium activity 5 s before and 10 s after placing a marble in the cage. Graphs are means ± SEM. Test trial 1, n = 4 mice, 220 neurons; trial 2, n = 4 mice, 218 neurons; trial 3, n = 4 mice, 222 neurons. ΔF/F = (F-Fbaseline)/Fbaseline, baseline was 60-s period before marble was presented. ***P < 0.001; d-f, paired Student’s t-test (two-tailed). Related to Figure 4. See also Supplementary Video 4. Statistical analysis in Supplementary Information.
Extended Data Figure 6. Additional calcium imaging analysis from fear-recall studies.
a,b, Average calcium fluorescence activity during 10-s tone presentations of fear-conditioned (a) and sham-conditioned (b) mice during tone trials 1, 15, and 30. Relative fluorescence was calculated from a 5-s baseline period before tone presentation. Graphs are mean ± SEM; fear-conditioned mice, n = 4 mice, 214 neurons; sham-conditioned mice, n = 4 mice, 169 neurons. c, Contextual fear conditioning paradigm in which mice were placed in a shock chamber before (Pre 1 and Pre 2) and after (Post 1 and Post 2) footshock conditioning. d, Calcium activity of individual neurons (horizontal lines are means) during a 5-min exposure to the shock chamber before and after fear conditioning (Pre 1, n = 3 mice, 120 neurons; Pre 2, n = 3 mice, 125 neurons; Post 1, n = 3 mice, 124 neurons; Post 2, n = 3 mice, 121 neurons). Relative fluorescence was normalized to a 2-min baseline recording period. e, Calcium activity of individual neurons (horizontal lines are means) during freezing and non-freezing behavior after conditioning. f, Percent of time spent freezing during exposure to the shock chamber after conditioning. Data points represent individual mice (n = 3). g, Representative individual neuron traces showing calcium activity while in home cage versus shock chamber after contextual fear conditioning. The dotted line denotes when the shock chamber recording began. The shaded regions annotate when the mouse was freezing. ΔF/F = (F-Fbaseline)/Fbaseline. Dissimilar letters above columns indicate statistical differences between trials. ***P < 0.001; a,d,e, One-way RM ANOVA, Tukey’s post-hoc. Related to Figure 5. Statistical analysis in Supplementary Information.
Extended Data Figure 7. Lens placement over CGRPPBN neurons.
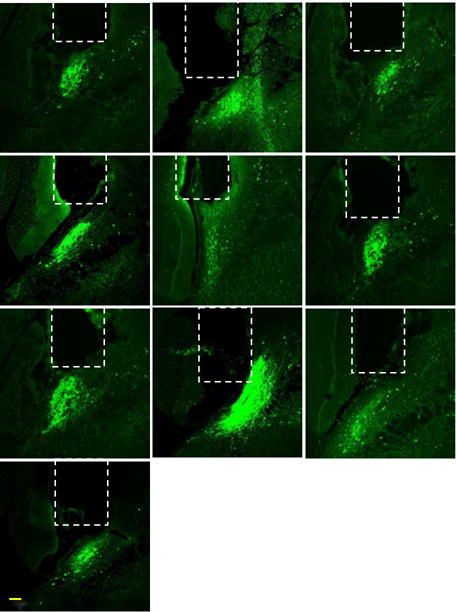
Representative images of lens placement for imaging CGRP neurons. Dashed lines are approximations of lens placement. Scale bar is 100 μm.
Supplementary Material
Acknowledgments
Research was supported by a fellowship grant from Hope Funds for Cancer Research (C.A.C.), National Institutes of Health (NIH) training grant (C.W.R., T32DK007247), and an NIH grant (R.D.P., R01-DA24908). Inscopix provided the calcium imaging equipment via their DECODE program. We thank Camille de Solages and Lara Cardy (Inscopix) for their advice regarding calcium imaging, Yong Sang Jo for help with conditioning equipment, Megan Chiang for maintaining the mouse colony, and Sung Han for making the GCaMP6m virus.
Footnotes
Supplementary Information Detailed statistics are provided.
Author Contributions C.A.C. designed and conducted the calcium imaging studies. A.J.B. did the stereotaxic surgeries for loss-of-function studies. C.A.C. and A.J.B. designed and conducted the fear studies. C.A.C. and C.W.R. designed and conducted the itch studies. R.D.P. provided guidance and resources. C.A.C. wrote the manuscript with input from the other authors.
Disclosure summary The authors have no conflicts of interest to disclose.
References
- 1.Saper CB. The House Alarm. Cell Metab. 2016;23:754–755. doi: 10.1016/j.cmet.2016.04.021. [DOI] [PubMed] [Google Scholar]
- 2.Saper CB, Loewy AD. Efferent connections of the parabrachial nucleus in the rat. Brain Res. 1980;197:291–317. doi: 10.1016/0006-8993(80)91117-8. [DOI] [PubMed] [Google Scholar]
- 3.Carter ME, Soden ME, Zweifel LS, Palmiter RD. Genetic identification of a neural circuit that suppresses appetite. Nature. 2013;503:111–114. doi: 10.1038/nature12596. [DOI] [PMC free article] [PubMed] [Google Scholar]
- 4.Campos CA, Bowen AJ, Schwartz MW, Palmiter RD. Parabrachial CGRP Neurons Control Meal Termination. Cell Metab. 2016;23:811–820. doi: 10.1016/j.cmet.2016.04.006. [DOI] [PMC free article] [PubMed] [Google Scholar]
- 5.Roman CW, Derkach VA, Palmiter RD. Genetically and functionally defined NTS to PBN brain circuits mediating anorexia. Nature Comm. 2016;7:11905. doi: 10.1038/ncomms11905. [DOI] [PMC free article] [PubMed] [Google Scholar]
- 6.Ritter RC. Gastrointestinal mechanisms of satiation for food. Physiol & Behav. 2004;81:249–273. doi: 10.1016/j.physbeh.2004.02.012. [DOI] [PubMed] [Google Scholar]
- 7.Han S, Soleiman MT, Soden ME, Zweifel LS, Palmiter RD. Elucidating an Affective Pain Circuit that Creates a Threat Memory. Cell. 2015;162:363–374. doi: 10.1016/j.cell.2015.05.057. [DOI] [PMC free article] [PubMed] [Google Scholar]
- 8.Cai H, Haubensak W, Anthony TE, Anderson DJ. Central amygdala PKC-delta(+) neurons mediate the influence of multiple anorexigenic signals. Nat Neurosci. 2014;17:1240–1248. doi: 10.1038/nn.3767. [DOI] [PMC free article] [PubMed] [Google Scholar]
- 9.Lebow MA, Chen A. Overshadowed by the amygdala: the bed nucleus of the stria terminalis emerges as key to psychiatric disorders. Mol Psychiatr. 2016;21:450–463. doi: 10.1038/mp.2016.1. [DOI] [PMC free article] [PubMed] [Google Scholar]
- 10.Flusberg BA, et al. High-speed, miniaturized fluorescence microscopy in freely moving mice. Nat Methods. 2008;5:935–938. doi: 10.1038/nmeth.1256. [DOI] [PMC free article] [PubMed] [Google Scholar]
- 11.Ghosh KK, et al. Miniaturized integration of a fluorescence microscope. Nat Methods. 2011;8:871–878. doi: 10.1038/nmeth.1694. [DOI] [PMC free article] [PubMed] [Google Scholar]
- 12.Bernard JF, Besson JM. The spino(trigemino)pontoamygdaloid pathway: electrophysiological evidence for an involvement in pain processes. J Neurophysiol. 1990;63:473–490. doi: 10.1152/jn.1990.63.3.473. [DOI] [PubMed] [Google Scholar]
- 13.Bernard JF, Huang GF, Besson JM. The parabrachial area: electrophysiological evidence for an involvement in visceral nociceptive processes. J Neurophysiol. 1994;71:1646–1660. doi: 10.1152/jn.1994.71.5.1646. [DOI] [PubMed] [Google Scholar]
- 14.Ryan PJ, Ross SI, Campos CA, Derkach VA, Palmiter RD. Oxytocin receptor-expressing neurons in the parabrachial nucleus regulate fluid intake. Nat Neurosci. 2017 doi: 10.1038/s41593-017-0014-z. In press. [DOI] [PMC free article] [PubMed] [Google Scholar]
- 15.Braz J, Solorzano C, Wang XD, Basbaum AI. Transmitting Pain and Itch Messages: A Contemporary View of the Spinal Cord Circuits that Generate Gate Control. Neuron. 2014;82:522–536. doi: 10.1016/j.neuron.2014.01.018. [DOI] [PMC free article] [PubMed] [Google Scholar]
- 16.Liu Q, et al. Sensory Neuron-Specific GPCR Mrgprs Are Itch Receptors Mediating Chloroquine-Induced Pruritus. Cell. 2009;139:1353–1365. doi: 10.1016/j.cell.2009.11.034. [DOI] [PMC free article] [PubMed] [Google Scholar]
- 17.Schiavo G, Matteoli M, Montecucco C. Neurotoxins affecting neuroexocytosis. Physiol Rev. 2000;80:717–766. doi: 10.1152/physrev.2000.80.2.717. [DOI] [PubMed] [Google Scholar]
- 18.Kim JC, et al. Linking genetically defined neurons to behavior through a broadly applicable silencing allele. Neuron. 2009;63:305–315. doi: 10.1016/j.neuron.2009.07.010. [DOI] [PMC free article] [PubMed] [Google Scholar]
- 19.Ranade SS, et al. Piezo2 is the major transducer of mechanical forces for touch sensation in mice. Nature. 2014;516:121–U330. doi: 10.1038/nature13980. [DOI] [PMC free article] [PubMed] [Google Scholar]
- 20.Mu D, et al. A central neural circuit for itch sensation. Science. 2017;357:695–699. doi: 10.1126/science.aaf4918. [DOI] [PubMed] [Google Scholar]
- 21.Zhou P, Resendez SL, Stuber GD, Kass RE, Paninski L. Efficient and accurate extraction of in vivo calcium signals from microendoscope video data. 2016 doi: 10.7554/eLife.28728. Preprint at https://arxiv.org/abs/1605.07266. [DOI] [PMC free article] [PubMed]
- 22.Betley JN, et al. Neurons for hunger and thirst transmit a negative-valence teaching signal. Nature. 2015;521:180–185. doi: 10.1038/nature14416. [DOI] [PMC free article] [PubMed] [Google Scholar]
- 23.Reilly S, Trifunovic R. Lateral parabrachial nucleus lesions in the rat: Neophobia and conditioned taste aversion. Brain Res Bull. 2001;55:359–366. doi: 10.1016/s0361-9230(01)00517-2. [DOI] [PubMed] [Google Scholar]
- 24.Carter ME, Han S, Palmiter RD. Parabrachial calcitonin gene-related peptide neurons mediate conditioned taste aversion. J Neurosci. 2015;35:4582–4586. doi: 10.1523/JNEUROSCI.3729-14.2015. [DOI] [PMC free article] [PubMed] [Google Scholar]
- 25.Tovote P, Fadok JP, Luthi A. Neuronal circuits for fear and anxiety. Nat Rev Neurosci. 2015;16:317–331. doi: 10.1038/nrn3945. [DOI] [PubMed] [Google Scholar]
- 26.Ricardo JA, Koh ET. Anatomical evidence of direct projections from the nucleus of the solitary tract to the hypothalamus, amygdala, and other forebrain structures in the rat. Brain research. 1978;153:1–26. doi: 10.1016/0006-8993(78)91125-3. [DOI] [PubMed] [Google Scholar]
- 27.Day HEW, Masini CV, Campeau S. The pattern of brain c-fos mRNA induced by a component of fox odor, 2.5-dihydro-2,4,5-trimethylthiazoline (TMT), in rats, suggests both systemic and processive stress characteristics. Brain Res. 2004;1025:139–151. doi: 10.1016/j.brainres.2004.07.079. [DOI] [PubMed] [Google Scholar]
- 28.Illing RB, Michler SA, Kraus KS, Laszig R. Transcription factor modulation and expression in the rat auditory brainstem following electrical intracochlear stimulation. Experimental Neurology. 2002;175:226–244. doi: 10.1006/exnr.2002.7895. [DOI] [PubMed] [Google Scholar]
- 29.Suzuki T, Sugiyama Y, Yates BJ. Integrative responses of neurons in parabrachial nuclei to a nauseogenic gastrointestinal stimulus and vestibular stimulation in vertical planes. Am J Physiol Regul Integr Comp Physiol. 2012;302:R965–975. doi: 10.1152/ajpregu.00680.2011. [DOI] [PMC free article] [PubMed] [Google Scholar]
- 30.Kaur S, et al. Glutamatergic signaling from the parabrachial nucleus plays a critical role in hypercapnic arousal. J Neurosci. 2013;33:7627–7640. doi: 10.1523/JNEUROSCI.0173-13.2013. [DOI] [PMC free article] [PubMed] [Google Scholar]
- 31.Padilla SL, et al. Agouti-related peptide neural circuits mediate adaptive behaviors in the starved state. Nat Neurosci. 2016;19:734–741. doi: 10.1038/nn.4274. [DOI] [PMC free article] [PubMed] [Google Scholar]
- 32.Steculorum SM, et al. AgRP Neurons Control Systemic Insulin Sensitivity via Myostatin Expression in Brown Adipose Tissue. Cell. 2016;165:125–138. doi: 10.1016/j.cell.2016.02.044. [DOI] [PMC free article] [PubMed] [Google Scholar]
- 33.Betley JN, Cao ZF, Ritola KD, Sternson SM. Parallel, redundant circuit organization for homeostatic control of feeding behavior. Cell. 2013;155:1337–1350. doi: 10.1016/j.cell.2013.11.002. [DOI] [PMC free article] [PubMed] [Google Scholar]
- 34.Kim SY, et al. Diverging neural pathways assemble a behavioural state from separable features in anxiety. Nature. 2013;496:219–223. doi: 10.1038/nature12018. [DOI] [PMC free article] [PubMed] [Google Scholar]
- 35.Kim J, Zhang X, Muralidhar S, LeBlanc SA, Tonegawa S. Basolateral to Central Amygdala Neural Circuits for Appetitive Behaviors. Neuron. 2017;93:1464–1479. doi: 10.1016/j.neuron.2017.02.034. [DOI] [PMC free article] [PubMed] [Google Scholar]
- 36.Chen Y, Lin YC, Kuo TW, Knight ZA. Sensory detection of food rapidly modulates arcuate feeding circuits. Cell. 2015;160:829–841. doi: 10.1016/j.cell.2015.01.033. [DOI] [PMC free article] [PubMed] [Google Scholar]
- 37.Tokita K, Inoue T, Boughter JD. Afferent Connections of the Parabrachial Nucleus in C57bl/6j Mice. Neuroscience. 2009;161:475–488. doi: 10.1016/j.neuroscience.2009.03.046. [DOI] [PMC free article] [PubMed] [Google Scholar]
- 38.Zseli G, et al. Elucidation of the anatomy of a satiety network: Focus on connectivity of the parabrachial nucleus in the adult rat. J Comp Neurol. 2016;524:2803–2827. doi: 10.1002/cne.23992. [DOI] [PMC free article] [PubMed] [Google Scholar]
- 39.Myers KM, Davis M. Mechanisms of fear extinction. Mol Psychiatr. 2007;12:120–150. doi: 10.1038/sj.mp.4001939. [DOI] [PubMed] [Google Scholar]
- 40.Campos CA, et al. Cancer-induced anorexia and malaise are mediated by CGRP neurons in the parabrachial nucleus. Nat Neurosci. 2017;20:934–942. doi: 10.1038/nn.4574. [DOI] [PMC free article] [PubMed] [Google Scholar]
- 41.Resendez SL, et al. Visualization of cortical, subcortical and deep brain neural circuit dynamics during naturalistic mammalian behavior with head-mounted microscopes and chronically implanted lenses. Nat Protoc. 2016;11:566–597. doi: 10.1038/nprot.2016.021. [DOI] [PMC free article] [PubMed] [Google Scholar]
Associated Data
This section collects any data citations, data availability statements, or supplementary materials included in this article.
Supplementary Materials
Data Availability Statement
The datasets generated during the current study are available from the corresponding author on reasonable request.