

Abstract
The current study used the self-fitting algorithm to allow listeners to self-adjust hearing-aid gain or compression parameters to select gain for speech understanding in a variety of quiet and noise conditions. Thirty listeners with mild to moderate sensorineural hearing loss adjusted gain parameters in quiet and in several types of noise. Outcomes from self-adjusted gain and audiologist-fit gain indicated consistent within-subject performance but a great deal of between-subject variability. Gain selection did not strongly affect intelligibility within the range of signal-to-noise ratios tested. Implications from the findings are that individual listeners have consistent preferences for gain and may prefer gain configurations that differ greatly from National Acoustic Laboratories-based prescriptions in quiet and in noise.
Keywords: hearing aids, self-fit, hearing-aid outcomes
Introduction
Hearing-aid fitting formulae typically have been designed to improve the audibility of speech in quiet settings (e.g., Johnson, 2013) by applying a gain prescription formula based on hearing thresholds. Recent surveys (e.g., Kochkin, 2012) show hearing-aid users are very satisfied with their hearing aids for understanding speech in quiet. However, it is unusual for a hearing-aid user’s experience to only include quiet listening situations. Noisy environments are ubiquitous, and the same surveys that show satisfaction with quiet performance also show that there is much room for improvement in noisy surroundings (Kochkin, 2012). Modern hearing aids employ multiple programs and “noise reduction” algorithms in an attempt to increase comfort in noisy situations, by decreasing the amount of gain in frequency bands where noise dominates. A variety of algorithms—including Wiener filtering—is used to estimate signal-to-noise ratio (SNR) in different frequency bands. The effects of these gain changes are not fully understood.
Preferred gain-frequency responses for hearing aids have previously been investigated using a variety of paradigms. Comparison or rating methods require listeners to make judgments about their preference for or perception of sounds after amplification with different gain-frequency responses, either as paired comparisons (Amlani & Schafer, 2009; Byrne, 1986; Keidser, et al., 2005; Keidser, Dillon, & Byrne, 1995, Kuk, Harper, & Doubek, 1994; Kuk & Lau, 1995a, 1995b; Kuk & Lau, 1996b; Kuk & Pape, 1992, 1993; Moore, Füllgrabe, & Stone, 2011; Neuman, Levitt, Mills, & Schwander, 1987; Preminger, Neuman, Bakke, Walters, & Levitt, 2000; Punch & Howard, 1978; Punch & Parker, 1981; Punch, Rakerd, & Amlani, 2001; Smeds, 2004; Stelmachowicz, Lewis, & Carney, 1994) or individual, unpaired ratings (Kuk & Lau, 1996a; van Buuren, Festen, & Plomp, 1995). Another approach is to use adjustment methods which entail assessing the output of a hearing aid after it has been adjusted—often using the volume control—to better match the preferred listening level (Boothroyd & Mackersie, 2017; Boymans & Dreschler, 2012; Cox & Alexander, 1991, 1992; Dreschler, Keidser, Convery, & Dillon, 2008; Hornsby & Mueller, 2008; Horwitz & Turner, 1997; Humes,Wilson, Barlow, & Garner, 2002; Keidser, Dillon, & Convery, 2008; Marriage, Moore, & Alcántara, 2004; Polonenko et al., 2010; Smeds et al., 2006; Souza & Kitch, 2001) or by analyzing the output of trainable hearing aids after completion of a training regime (Keidser & Alamudi, 2013; Mueller, Hornsby, & Weber, 2008; Zakis, Dillon, & McDermott, 2007).
Although a few studies indicate that average preferred gain is similar to gain fit according to a clinical formula (Hornsby & Mueller, 2008; Polonenko et al., 2010), a common trend in the literature is that listeners with hearing loss generally prefer less overall gain than their formula-fitted settings (Boymans & Dreschler, 2012; Humes et al., 2002; Keidser & Alamudi, 2013; Smeds, 2004; Smeds et al., 2006). For studies in which gain in the high and low frequencies were varied separately, a common pattern is that listeners typically prefer less high frequency (>1000 Hz) gain than their fitted settings and more low-frequency gain than their fitted settings (Boothroyd & Mackersie, 2017; Kuk & Pape, 1992, 1993; Moore et al., 2011; Preminger et al., 2000; Zakis et al., 2007). However, the opposite of this trend has also been reported, with listeners preferring less gain in the low frequencies and more gain in the high frequencies (Punch et al., 2001). For listening in noise, the spectral characteristics of preferred gain may depend on the spectrum of sound in which preference is assessed, such that listeners tend to prefer the gain-frequency responses which reduce gain in spectral regions containing relatively higher levels of noise (Keidser et al., 1995, 2005).
The presence or absence of competing sounds may itself influence listener preferences for hearing-aid gain. Due in part to differences in study methods and reporting, the relationship between preferred gain in noise and preferred gain in quiet is somewhat unclear. Cox and Alexander (1991) found that listeners preferred less gain in a noisy or reverberant environment than in a quiet environment, but the level of speech and the overall level in each environment differed substantially, introducing a potential confound. Likewise, Keidser et al. (2005) assessed the preferred spectral tilt of the gain-frequency response across a variety of noise conditions and found that listeners preferred less gain when SNRs were poor. However, the SNRs used did not vary independently of the presentation level. Both studies are consistent with a preference for lower gain at higher listening levels. Indeed, studies which include some variation of input level generally find that listeners prefer less gain as levels increase, which is consistent with the normal operation of compression gain (Kuk & Pape, 1993). Other studies which vary the characteristics of the listening environment without large changes on the input listening level have reported only small differences in gain preference for environments that differ in amount of reverberation or noise (Kuk & Pape, 1992, 1993; Stelmachowicz et al., 1994).
When assessed and reported, the stability, or test–retest reliability, of gain-frequency response preferences appears to differ with the method and materials used. Several studies report that listeners with hearing loss show better consistency in preferred gain-frequency response when listening in noise than in quiet (e.g., Keidser et al., 2005; Kuk & Pape, 1992; Stelmachowicz et al., 1994). Byrne (1986) found that the reliability of intelligibility and pleasantness judgments made by listeners with hearing loss depended on the presence of noise during evaluation, with greater reliability of intelligibility judgments in quiet than in noise and greater reliability of pleasantness in noise than in quiet. In general, the literature indicates that most individuals are moderately consistent in their judgments and preferences for gain-frequency responses across repeated assessments, with most listeners arriving at the same or a similar result upon retest (Kuk & Pape, 1992) or preferring a single-frequency response over nearly all others (Byrne, 1986). Test–retest Pearson correlation coefficients, when reported in the literature, range from about 0.6 to about 0.8 (Boothroyd & Mackersie, 2017; Punch & Parker, 1981) and within-subjects test–retest standard deviations (when reported) are typically 5 dB or less (Dreschler et al., 2008; Keidser et al., 2005). Many different gain-frequency responses produce similar speech recognition outcomes (van Buuren et al., 1995), and estimates of within-subject consistency may reflect that some listeners are willing to accept many gain-frequency responses as preferable (Keidser et al., 2005; Kuk & Lau, 1996a).
When between-subjects variability for preferred gain is reported, it can be substantial (e.g., Hornsby & Mueller, 2008). The preferences of individual listeners can deviate greatly from average trends, and a need to match hearing-aid gain to the preferences of each hearing-aid user provides strong motivation for using self-adjustment technology to investigate preferences for hearing-aid amplification.
It is not clear that hearing professionals know what a hearing-aid user would choose as a gain profile in quiet and noisy situations. That is, would a user choose to have the gain decreased for added comfort in noise but reduced audibility and speech understanding? Alternatively, would they prefer to tolerate a bit more noise in the hopes of improving their understanding of the speech signal? Along those lines, would their preferred adjustment for different environments be the same across hearing-impaired (HI) listeners or would it vary across listener? Given the heterogeneous nature of the HI population, it is hypothesized that the latter would be true, but this has not been directly tested.
This study used self-adjusting simulated hearing aids to determine user-selected gain settings for a group of HI listeners with varying degrees of hearing loss in several noisy settings. The self-fitting process has been used previously to determine listeners’ ability to select gain (e.g., Keidser & Alamudi, 2013; Wong, 2011). While self-fitting hearing aids have been tested as a means of getting much-needed amplification to HI listeners in developing countries (i.e., Convery, Keidser, Dillon, & Hartley, 2011), this article examines the use of self-adjustment or fitting to find preferred settings in varying quiet and noisy conditions. In the current experiment, self-adjustment was used to determine listener preference and performance specifically for listening to speech in quiet and in noise. Findings can inform audiology practice. If most listeners set their gain to a lower (or higher) level in the presence of noise, it would argue that automatic gain changes would be satisfactory, and preset noise-reduction algorithms would satisfy most users. The data, then, could inform the details of proposed gain settings for noisy conditions. However, if different listeners set their gain differently for a given listening condition, this would suggest that preset noise-reduction programs are not ideal, and that self-adjustment is a valuable tool with which to quickly and accurately find a HI listener’s uniquely preferred settings. In addition, the results of speech recognition testing can provide information about listeners’ potential trade off between comfort in noise and intelligibility. An important secondary question is whether listeners sacrifice intelligibility for comfort when given self-adjustment options.
Methods
Data are presented from 30 listeners aged 59 to 78 years with mild to moderate hearing loss who self-adjusted amplification parameters in laboratory-simulated restaurant environments.
Recordings (Background Noise)
Noisy restaurant conditions were chosen because they are among the most challenging environments for hearing-aid users and are the source of dissatisfaction for many (e.g., Kochkin, 2012). Therefore, recordings were made of three local area restaurants during the lunch hour, along with a quiet conference room to mimic a “living room” setting. Stereo recordings approximately 5 min in length were made of the background noise in each restaurant. The set-up for each set of recordings was a Schoeps CMC6 MK4 stereo cardioid microphone in an ORTF configuration (two cardioid microphones spread to a 110°, after Killion, 1979) and a Roland R-4 portable sound recorder with 24-bit quantization and a 48 kHz sampling rate. Long-term spectra of the restaurant noises are shown in Figure 1. Sound levels were naturally varying.
Figure 1.
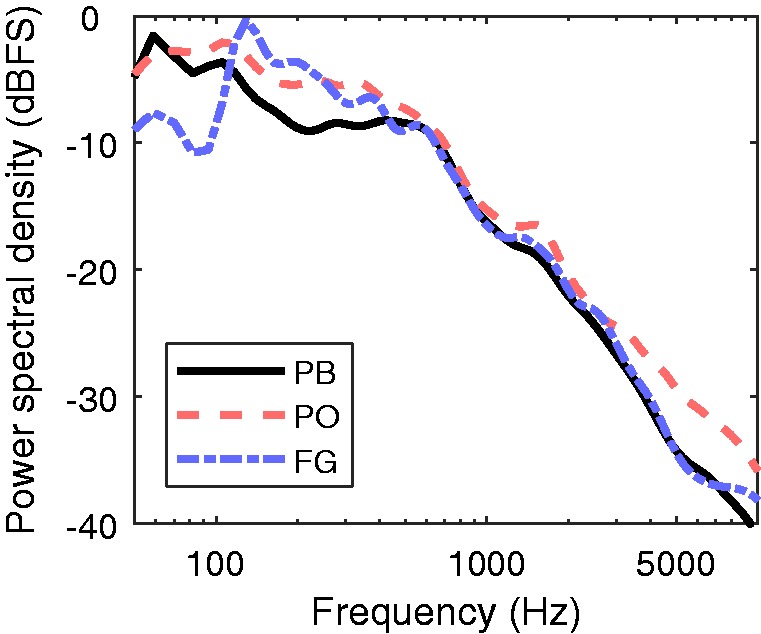
Long-term average spectra of the three restaurant recordings. The steady PB noise had the same long-term spectrum as the PB recording.
Laboratory or Sound Booth
Laboratory characteristics include a 10′ × 13′ × 8.5′ double-walled sound chamber, 48 speaker array (Anthony Gallo Acoustics—A’Diva ti speakers), 24 Crown XLS 1500 power amplifiers, and 3 Lynx Aurora 16 D/A converters. The experimental routine was run on a Dell desktop computer running Matlab.
Stimuli (Room Noise)
The recorded binaural room recordings were spatialized to the 48-channel loudspeaker system by presenting the left portion of the signal to all loudspeakers on the left hemisphere and vice versa for the right portion of the signal. For six loudspeakers along the interaural axis, both the left and right signals were summed, and the resulting amplitude divided by half before presented to these six loudspeakers. A steady noise with the same frequency spectrum as the PB restaurant was included as an additional noisy environment. In this condition, the PB steady-state noise was played through the entire 48-channel loudspeaker array but without any spatial processing applied in order to approximate a diffuse noise environment.
Stimuli (Connected Speech Test—Target Speech)
Recordings from the Connected Speech Test (CST; Cox, Alexander, & Gilmore, 1987) were used in this study. During gain adjustment, the speech stimuli consisted of 30-s CST passages spoken by a female talker presented on a loop. To make the speech stimuli seem to originate from the same room as the background noise, the speech stimuli were spatialized to match the measured restaurant sizes (see later) and the estimated reverberation times of the recorded rooms.
This gave the desired effect in that a listener in that soundfield was surrounded by the restaurant- (or living room-) recorded stimuli, similar to how they would be if they were actually seated in the middle of the restaurant (or quiet room). The room dimensions used for spatialization were as follows:
Restaurant 1 (FG): 58′ × 24′ × 9′
Restaurant 2 (PB): 38′ × 30′ × 25′
Restaurant 3 (PO): 80′ × 56′ × 13′
Conference room (“living room”): 16′ × 14′ × 9′
This process used a virtual room model to simulate reflections in an acoustic space. This room simulation used an image-based model (Allen & Berkley, 1979) to calculate 10,000 individual reflections for each room based on a source to receiver distance of 1.3 m. Custom software then assigned the calculated reflections to an appropriate loudspeaker in the sound booth using appropriate timing and power adjustments based on the inverse-square law. The resulting set of 48 impulses responses was then convolved with the speech stimuli, combined with the matching background noise, and played out through a 48-channel loudspeaker array. This processing strategy attempted to approximate a listener’s experience of being seated in the middle of a restaurant (or quiet room) and listening to the female talker at a short distance.
In other words, the CST spatialized to match the PB restaurant was only used when samples of the PB noise were played, and the same was true for the other background noises. A steady noise with the same frequency spectrum as the PB restaurant was included as an additional noisy environment. The PB steady-state noise was played through the entire speaker array but without spatialization.
Simulated Hearing Aid—Ear Machine
Self-adjustment was used to determine the preferred settings of the listeners. For our study, listeners used a mobile application developed by Ear Machine LLC, running on the Apple iOS platform and implemented on an iPod Touch (fourth generation). The device was coupled to the listeners’ ears using Etymotic foam ear tips. The sound in the booth was picked up by the microphone of the iPod and delivered diotically to both ears. The iPod was held in front of the listener at approximately chin height. The application was designed to simulate a nine-channel hearing aid with slow-acting compression. Specifically, the application used a nine-channel multiband wide-dynamic range compressor or limiter with fast attack (approximately 1 ms) and slow release (approximately 500 ms) times. Compression center frequencies were as follows: 125, 500, 1000, 1500, 2250, 3250, 4625, 6750, and 15025 Hz. Compression ratios ranged from 1:1 to 2.3:1 for 90% of the possible settings (maximum compression ratios up to 5:1 were possible). The app included a 12-band equalizer, and the signal processing (proprietary) was designed to provide a close match to a commercial hearing aid.
There were two controllers on the screen of the iPod that functioned as wheels which the listeners could turn up or down (earmachine.com). One controller was labeled “loudness,” and the other was labeled “fine tuning.” The loudness controller changed gain, compression, and limiting parameters in all nine compression channels simultaneously based on fits to multiple audiograms from the NHANES database (https://wwwn.cdc.gov/nchs/nhanes/Default.aspx). The fine tuning controller changed frequency tilt by changing overall frequency response in the 12 equalization bands: As the controller wheel was moved upwards, frequencies above 2 kHz were emphasized and frequencies below 2 kHz were de-emphasized. Moving the wheel downward had the opposite effect.
Calibration
Calibration was done using noises that were equivalent to the long-term average spectra (digital RMS) of the various background noises. They were not spatialized. In addition, the CST noise (included on the CD) was used to calibrate the CST passages. A chair in the laboratory was set approximately 3 feet from the 0° azimuth speaker (where the CST was played). A sound level meter was held in the approximate head position (head absent) as each calibration noise was set to 65 dBC.
Participants
Listeners who participated in the study included 30 adults with symmetric mild to moderate sensorineural hearing loss (see Figure 2 for the average audiograms). The average age was 70 years, with ages ranging from 59 to 78 years. Seventeen of the participants were male. Twelve participants were new users of hearing aids; the others had used hearing aids for varying durations from 1 year to 25 years.
Figure 2.

Mean participant audiograms for left and right ears. The dashed blue lines and dotted red lines indicate 1 standard deviation from mean thresholds for left and right ears, respectively.
Listener instructions
Each listener was instructed that the goal of the task was to turn the wheels on the iPod until the talker’s voice (i.e., CST passages) was as clear as possible in the background noise. They were asked to adjust each wheel separately but were told they could adjust each wheel as much as they wanted to and in any order.
Several listeners had participated in previous trials during pilot testing, so no practice was required for them. New listeners practiced in the booth during seven actual trials, with an experimenter standing close by to answer any questions.
Each experimental trial began with the user’s custom prescriptive settings of National Acoustic Laboratories (NAL)-NL2, derived from the stand-alone clinical software and verified using real-ear speech mapping techniques. This was chosen as the default position because it has been shown more than once that the starting settings of a self-adjust device dictate to some extent the end configuration (e.g., Dreschler et al., 2008, Keidser et al., 2008 and Mueller et al., 2008). Once the experimental trials began and the listener had adjusted the wheels such that they were satisfied that they could hear the CST voice as clearly as possible, they indicated this by tapping a star-shaped virtual button on the user interface, ending the current trial. This stopped sound playback momentarily and sent the preferred settings via Internet to a virtual server system. There were a total of 34 trials with the CST stimuli set to 65 dBC (2 repetitions per 4 noises; 4 SNRs: −10, −5, 0, and 5; and 2 quiet living room repetitions). Noise levels varied in order to achieve the desired SNR for each condition.
Speech recognition testing
Speech understanding was assessed using Harvard or IEEE sentences (IEEE Transactions, 1969) spoken by a female talker. The talker’s voice was presented at 65 dBC from the front speaker in the presence of diffuse steady noise (i.e., presented through the entire 48 speaker array) which had the same long-term spectrum as the PB restaurant noise. Subjects listened through the iPod running the Ear Machine app, as they did during the self-adjustment trials. However, the gain and compression was locked at either that subject’s NAL fit or at the self-adjusted settings which had been previously selected by each subject for the corresponding listening condition. Conditions included quiet (living room), −10, −5, 0, and 5 dB SNR. Participants repeated the sentences and they were scored by the experimenter. Two lists were presented per condition, for a total of 100 key words per condition.
Results
Gain Adjustment Results
Self-adjustment resulted in a wide range of insertion gains for a 65 dB SPL input. Large intersubject variability in self-adjusted fits was seen in each listening environment, including the quiet (living room) environment. Two examples of NAL fits and the self-adjusted fits selected by subjects in the quiet environment are shown in Figure 3. Gain for each band is shown as prescribed by NAL (dashed lines) and as selected by each individual user (solid lines).
Figure 3.

Examples of insertion gain resulting from self-adjustment in quiet for two subjects (S1 and S18). Black dashed lines indicate insertion gain for the subject’s NAL fit. Solid orange lines are insertion gain resulting from the first self-adjustment in quiet. Dotted blue lines indicate gain resulting from a second self-adjustment in quiet. Data from S1 (upper panel) exemplify pattern of consistency in self-adjustment between repetitions of self-adjustment, while data from S18 (lower panel) reflect common pattern for subjects to reduce high-frequency gain relative to their NAL fit.
To summarize the data for all subjects, insertion gain for the NAL fit for each subject was averaged into a low-frequency band (125, 250, 500, and 1000 Hz) and a high-frequency band (2000, 3000, 4000, 6000, and 8000 Hz). Insertion gain for each self-adjusted fit was also averaged into the same low- and high-frequency bands. Figure 4 shows the NAL fit and self-adjusted fits obtained in quiet for each subject, averaged according to frequency. Most subjects had little or no hearing loss in the low frequencies, and thus most of the NAL fits had little or no insertion gain at low frequencies (mean = 2.4 dB). In contrast, in the quiet environment, subjects often selected some insertion gain at low frequencies (mean = 6.8 dB). Second, for high frequencies, many subjects selected fits with less insertion gain than the NAL fit. Of the 60 self-adjustment trials completed in the quiet environment (two trials per subject), 19 resulted in more high-frequency insertion gain than the NAL fit, while 41 resulted in less gain.
Figure 4.

Insertion gain for NAL fit and self-adjusted fits obtained in quiet. The left panel displays average gain for frequencies up to 1000 Hz, while the right panel displays average gain for frequencies between 1000 and 8000 Hz. Subjects are ordered from left-to-right on the abscissa according to the average high-frequency insertion gain in their NAL fits. Orange and blue triangles indicate, respectively, the average gain resulting from the first and second trials of self-adjustment in quiet.
Consistency in self-adjusted fits within subjects was assessed by examining test–retest reliability. The test–retest difference was defined as the difference in insertion gains between the first self-adjusted fit in a given listening condition and the second self-adjusted fit in that same listening condition. The absolute test–retest difference averaged across all trials was small (low-frequency band: 5.6 dB, high-frequency band: 6.9 dB) (see Figure 5, showing the test–retest histogram for low- and high-frequency bands). The test–retest correlation coefficient across both frequency bands indicated a moderately high degree of reliability, r(1018) = 0.64, p < .001. The median within-subjects standard deviation was 3.1 and 2.3 dB in the high- and low-frequency bands, respectively, for testing in the quiet condition. Median within-subjects standard deviations were similar for the noise conditions, ranging from 3.1 to 4.0 dB in the high-frequency band and from 2.2 to 3.5 dB in the low-frequency band. Across all retests, 54.6% were within 5 dB of the first self-adjusted fit, while 80.7% were within 10 dB. For subsequent analysis, insertion gains were averaged between the first and second trials in each listening condition.
Figure 5.

Test–retest histogram for insertion gain in the low- and high-frequency bands. Counts of absolute test–retest differences are shown in blue for the low-frequency band (125–1000 Hz), and in black for the high-frequency band (2000–8000 Hz).
To describe how self-adjusted fits differed from NAL fits, gain deviation was calculated separately in the low- and high-frequency bands by subtracting the insertion gain of the NAL fit from the insertion gain of each self-adjusted fit. A positive gain deviation indicates that the self-adjusted fit resulted in more insertion gain than the NAL fit. A negative gain deviation indicates the opposite, that is, the self-adjusted fit resulted in less insertion gain than the NAL fit. Figure 6 shows the deviations from NAL for gain adjustments made in quiet and in each noise environment and SNR (after averaging first- and second-trial repetitions). The data obtained in quiet are replotted in Figure 7 on the rightmost column of each panel.
Figure 6.

Gain deviation from NAL (self-adjusted gain minus NAL gain) for the listening conditions. Positive deviations indicate more insertion gain in the self-adjusted fit than the NAL fit. Negative deviations indicate less gain in the self-adjusted fit than in the NAL fit. Rows of plots correspond to different SNR conditions, while noise environments are indicated by marker shape and color. Gain from self-adjustment was averaged across repetitions within each condition. Subjects are ordered from left-to-right on the abscissa according to the average high-frequency insertion gain in their NAL fits (as in Figure 4).
Figure 7.

Gain deviation from NAL for individual listeners making self-adjustments in varying levels of noise. Deviations have been averaged across noise environments (within the same SNR) and repetitions. Data from low frequencies are shown in the left column; high frequencies are shown in the right. Data from individual subjects are connected with lines of varying line type; the thick, black line indicates the average deviation from NAL across subjects.
Figure 7 shows the deviation from NAL for gain adjustments made at each SNR, averaged across noise types. Data from individual subjects are connected with lines, and the thick, black line indicates the average across subjects. Again, intersubject variability was notably large. Considering all noise levels and types, subjects adjusted insertion gain relative to NAL over a wide range, in both the low-frequency band (−23.3 – +24.2 dB) and the high-frequency band (−37.7 – +15.8 dB). Gain adjustments made in noise followed similar overall trends as those made in quiet. In the low-frequency band, most subjects chose more gain than NAL in the quiet environment, but as noise was added and as the level of noise was increased, self-adjusted fits tended to result in less gain with increasing SNR. On average, gain deviation from NAL in the high-frequency band was negative, and with increasing SNR, self-adjusted fits resulted in less insertion gain compared with NAL fits (i.e., increasingly negative deviation from NAL).
To systematically examine the influence of SNR and noise type on gain adjustment, two linear-mixed models were fit to the data in R (R Core Team, 2016) via the lme4 package using restricted maximum likelihood. One model was fit to deviation from NAL in the high-frequency band, and a second model was fit to deviation from NAL in the low-frequency band. Both models included the within-subjects factors of SNR, noise type, and repetition, and a random intercept for subject as well as a random slope for SNR per subject (included to account for any differences in the effect of SNR between subjects). Inspection of the residuals did not indicate violations of the assumptions of normality and homoscedasticity. For each model, an analysis of variance table (Type II sums of squares) and post hoc contrasts were calculated using the Kenward-Roger approximation for degrees of freedom using the lmerTest, pbkrtest, and multcomp packages. For both models, the main effect of SNR was statistically significant, high frequency: F(4, 34.39) = 11.13, p < .001; low frequency: F(4, 34.79) = 19.25, p < .001, and post hoc tests of contrasts gave evidence for statistically significant differences (all p < .01 for both the high- and low-frequency models) in deviation from NAL between proximal SNR conditions (i.e., between quiet and 5 dB SNR, between 5 dB SNR and 0 dB SNR, and so on). This confirms that subjects tended to select less and less gain as the noise level increased, across the different listening environments, as seen in Figure 7.
The main effect of repetition was not statistically significant in both the high-frequency, F(1, 866) = 1.64, p = .20, and low-frequency models, F(1, 866) = 1.39, p = .24, indicating no detectable bias across listeners between first- and second-trial repetitions.
The main effect of noise type was statistically significant for both the high-frequency, F(3, 866) = 3.79, p = .01, and low-frequency models, F(3, 866) = 3.33, p = .02. Post hoc tests of specified contrasts indicated no difference in deviation from NAL between the PB restaurant noise and the steady PB-spectrum noise in both the high-frequency (p = .90) and low-frequency (p = 1.00) bands. Gain changes in the FG restaurant noise were significantly different from changes made in the PB, PO, and steady noise conditions in the high-frequency band only (p = .04), indicating the subjects tended to make smaller magnitude adjustments to high-frequency gain (i.e., have negative deviation from NAL that is closer to 0) in the FG noise than in the other noises by about 1.4 dB, averaged across SNR, repetition, and subject. Gain changes in the PO restaurant noise were significantly different from changes made in the PB restaurant and steady noises in the low-frequency band only (p = .02), indicating that subjects tended to increase low-frequency gain more in the PO noise by about 1.3 dB, averaged across SNR, repetition, and subject. In general, the magnitude of the differences between noise types was small in terms of dB, suggesting that subjects made small, yet consistent, alterations to their gain in response to the listening environment. The finding of no statistically significant difference between the two noise conditions with the same long-term average spectrum (PB restaurant and PB-spectrum steady noise) is consistent with the notion that gain preferences in noisy environments are related to the noise spectra. Because variation in gain adjustments across noise types was small, and in order to generalize across noise environments, for subsequent analyses, the data from the four noise types were averaged together.
To evaluate whether subjects were consistent in their gain adjustments as noise levels changed, bivariate correlations were calculated between gain deviation from NAL within each frequency band for adjustments made in different SNRs, and p values were corrected for multiple comparisons using the Benjamini-Hochberg procedure. The results are displayed in Table 1. Correlations were robust overall, indicating that subjects tended to make consistent gain adjustments across differing levels of noise. Correlation coefficients were highest between conditions in which noise levels were most similar, and when the SNRs represented moderately noisy environments (0 and 5 dB SNR).
Table 1.
Correlation Coefficients for Gain Adjusted at Different Noise Levels.
| SNR (dB) | 5 | 0 | −5 | −10 |
|---|---|---|---|---|
| High-frequency band | ||||
| Quiet | 0.72 | 0.66 | 0.63 | 0.44 |
| 5 | 0.92 | 0.86 | 0.47 | |
| 0 | 0.91 | 0.54 | ||
| −5 | 0.68 | |||
| Low-frequency band | ||||
| Quiet | 0.68 | 0.58 | 0.53 | 0.31 |
| 5 | 0.95 | 0.92 | 0.69 | |
| 0 | 0.93 | 0.7 | ||
| −5 | 0.72 | |||
Note. SNR = signal-to-noise ratio. All correlation coefficients statistically significant at p < .05.
Speech Intelligibility Results
In some cases, self-adjusted fits resulted in much less insertion gain than the NAL fits, and the influence of this reduction in gain on speech understanding in noise was unknown. Speech intelligibility was assessed to compare subjects’ speech understanding when using their self-adjusted fits with their performance using their NAL fits. Speech understanding was evaluated in a quiet environment and in the steady noise which had the same long-term spectrum as the PB restaurant noise. Sentences were presented in four different SNRs (5, 0, −5, and −10 dB). Out of the 30 subjects that completed the gain adjustment task, a subset of 17 subjects were able to return to the lab to complete the speech intelligibility task. The first three subjects who completed the speech intelligibility task (S7, S8, and S19) did not complete the −10 dB SNR condition as this condition was added to the protocol after they had finished.
Speech intelligibility was computed as the percentage of the total number of sentence key words that were correctly identified by the listener. Figure 8 displays speech intelligibility as a function of SNR for both NAL and self-adjusted fits. Mean performance was similar between NAL and self-adjusted fit conditions at each SNR. Subject S10 showed unusually poor performance for self-adjusted settings in the +5 dB SNR condition. This was the first block of sentences presented, and this subject omitted responses to 6 of the 20 sentences in this block, which suggests that when testing first began, this subject did not initially understand the instructions for responding. This did not occur at any other time.
Figure 8.

IEEE key word recognition achieved using NAL (circles) and self-adjusted (triangles) fits. Large, filled symbols indicate average key word recognition across subjects. Smaller, open symbols are data from individual subjects.
To visualize how adjustments to the gain and compression settings affected speech intelligibility, intelligibility performance using the NAL fit was subtracted from the performance using the self-adjusted fit. A positive intelligibility difference indicates better performance with the self-adjusted fit. Figure 9 shows the intelligibility difference plotted as a function of gain adjustment in the low-frequency band (bottom row) and high-frequency band (top row), with plots in each column displaying data from a particular SNR condition. Solid lines in each panel indicate linear fits to the data, excluding two outliers discussed in the next paragraph. Visual examination of the scatterplots and fitted lines suggest that listeners can adjust insertion gain throughout a wide range relative to their NAL fit without greatly altering their speech understanding.
Figure 9.

Difference in speech recognition performance between self-adjusted and NAL fits plotted with respect to gain deviation from NAL in the low-frequency band (bottom row) and high-frequency band (top row). Each column of panels shows data from a different SNR condition. A positive score difference indicates better performance with the self-adjusted fit than the NAL fit, while a negative score difference (lower on the ordinate) indicates worse performance with the self-adjusted fit.
Data from two subjects stand out as likely outliers. As previously discussed, subject S10’s performance in the +5 dB SNR condition was unusually poor, and this might have been due to initial confusion about how to use the interface to respond. Second, subject S20 showed very poor intelligibility in the −5 dB SNR condition with self-adjusted gain settings, which is likely due to the extreme reduction in gain in the high frequencies. The extreme reduction of gain was not replicated in any other trial. For example, the other self-fit completed by S20 in steady noise at −5 dB SNR resulted in 16.6 dB more high-frequency insertion gain than the fit that was used to assess speech intelligibility. Further, the self-adjusted fit selected by S20 which was used to assess speech understanding at −5 dB SNR resulted in the least high-frequency insertion gain of all self-adjusted fits.
To systematically evaluate the dependence of intelligibility difference on gain adjustment, for each frequency band and SNR bivariate correlations were computed between the intelligibility difference and gain deviation from NAL, and p values were corrected for multiple comparisons using the Benjamini-Hochberg procedure. The data described earlier as potential outliers were included in this analysis. Although there were trends in the 0 dB and −5 dB SNR conditions for subjects to have poorer intelligibility with the self-adjusted fit as they decreased gain relative to the NAL fit, none of the correlations were statistically significant (all adjusted p > .05). Listener adjustments of gain and compression settings did not appear to have a systematic impact on speech understanding. Figure 10 shows a histogram of the difference in key word recognition between NAL gain and self-fit gain for each SNR. In over 80% of cases, intelligibility performance with self-adjusted gain was within 10% points of performance with NAL gain in the same SNR.
Figure 10.

Histogram of IEEE key word score differences (self-adjusted fit minus NAL fit) across all subjects that completed the speech recognition assessment. Data from different SNR conditions are displayed as separate lines.
Discussion
The current study investigated users’ self-selected gain using the Ear Machine© algorithm as a tool to allow listeners to self-adjust hearing-aid gain or compression parameters to select gain for speech understanding in a variety of noise conditions. A different self-adjustment algorithm may have produced different results. Outcomes from self-adjusted gain and audiologist-fit gain (based on NAL-NL2 prescriptive targets) were compared. While listeners showed good test–retest results using the self-adjustment algorithm, indicating consistent performance across days and trials, the variability among participants was striking. Gain changes (differences between NAL-prescribed and self-adjusted gain) were as large as 24 dB in the low frequencies and as high as 37 dB in the high frequencies. Most listeners chose more gain than prescribed in the low frequencies, while others chose less. Some listeners preferred up to 15 dB more gain in the high frequencies, while most preferred less high-frequency gain than prescribed. On average listeners chose more low-frequency gain than prescribed by NAL-NL2. This may not be too surprising, as most listeners were prescribed 0-dB gain in the low frequencies. This may be an outcome of the configuration of the algorithm. It may be noted that listeners were not asked to talk for long periods of time during the fitting process, and so the effect of listeners’ own-voice experience may be minimized by the methodology. Note that there are two obvious outliers for low-frequency gain seen in the left panel of Figure 6. One chose significantly less low-frequency gain than prescribed across all SNRs (dotted line) while the other chose significantly more (dashed line), except at −10 dB SNR. The data from the remaining 28 subjects showed a rather tight cluster for self-adjusted low-frequency gain, but it should be noted that even within that group, excluding the two extreme cases, the data show about a 20-dB difference from most to least gain selected.
In the high frequencies, the variability was surprising. While most settings chosen (41 out of 60 fittings) indicated that listeners preferred less high-frequency gain than prescribed, still a number of listeners self-selected 5 to 15 dB more gain than their NAL prescription for quiet to moderately noisy conditions (up to −5 dB SNR). Only one subject selected more gain than prescribed at −10 dB SNR. Selecting gain higher than NAL-NL2 in high-frequency regions seems surprising in light of common reports that listeners typically prefer less high-frequency (>1000 Hz) gain than their fitted settings (Boothroyd & Mackersie, 2017; Mackersie, Boothroyd, & Lithgow, 2018; Kuk & Pape, 1992, 1993; Moore et al., 2011; Preminger et al., 2000; Zakis et al., 2007). Others have reported significant differences between self-selected and audiologist-fit gain. Hornsby and Mueller (2008) reported gain deviations about half the size of the current results (approximately ± 8 dB). It is difficult to determine whether the size of the variability noted here is different from many other previous reports, as individual data are not always published. Boothroyd and Mackersie (2017) report that average self-adjusted gain was within approximately 5 to 10 dB different from NAL-adjusted gain. Overall, we see that individuals vary in their preference for gain-frequency response.
The largest between-subject differences were seen in quiet conditions. Noise level, as predicted, did have some effect on self-adjusted gain parameters. As noise levels increased, preferred gain decreased slightly, even though the NAL-NL2 prescriptions themselves were compressive and resulted in less overall gain with increasing level.
Notably, for the most part, those adjustments did not significantly reduce speech intelligibility in quiet or in noise. At first, this finding was somewhat surprising, due to the large range of gains selected by the subjects. However, because hearing losses were mild to moderate, and in light of the results seen in Figure 8, it can be inferred that in the noise conditions, speech audibility (and resulting intelligibility) was driven mostly by the noise levels. For the quiet conditions, listeners’ audibility estimated using the articulation index was greater than 0.5 for all aided conditions (audiologist or self-adjusted) and so intelligibility of speech was near 100%. This phenomenon will be investigated further in a future study.
Conclusion
Individuals were largely consistent in their adjustments across SNRs for moderate noise levels (r ≈ 0.9 for SNRs between −5 and +5 dB), demonstrating that adjustments in moderate noise were not made arbitrarily, and that generally if a listener preferred more gain for one condition, that listener preferred more gain for all conditions. Gain adjustments were more variable in the quiet background and in the most unfavorable noise (−10 dB SNR), suggesting that individuals might weight criteria (e.g., comfort, sound quality) differently when speech is trivially easy or extremely challenging to understand. These findings imply that allowing self-adjustment of gain provides listeners with the opportunity to significantly and uniquely fine-tune their hearing-aid amplification settings.
Future evaluation will obtain qualitative ratings when listening with self-adjusted gain or audiologist-fit NAL-NL2-based gain prescriptions. Results of these new experiments will inform us as to the potential for self-adjustment to result in greater user preference and satisfaction with hearing aids.
Declaration of Conflicting Interests
The authors declared the following potential conflicts of interest with respect to the research, authorship, and/or publication of this article: Dr. Dianne VanTasell is an employee of Bose Corp who provided the instruments for this study.
Funding
The authors disclosed receipt of the following financial support for the research, authorship, and/or publication of this article: This work is supported by the National Institute on Deafness and Other Communication Disorders (R01 DC013267).
References
- Allen, J. B., & Berkley, D. A. (1979). Image method for efficiently simulating small-room acoustics. Journal of the Acoustical Society of America, 65, 943. doi:10.1121/1.382599.
- Amlani A. M., Schafer E. C. (2009) Application of paired-comparison methods to hearing aids. Trends in Amplification 13: 241–259. doi:10.1177/1084713809352908. [DOI] [PMC free article] [PubMed] [Google Scholar]
- Boothroyd A., Mackersie C. (2017) A “Goldilocks” approach to hearing-aid self-fitting: User interactions. American Journal of Audiology 26: 430–435. doi:10.1044/2017_AJA-16-0125. [DOI] [PMC free article] [PubMed] [Google Scholar]
- Boymans M., Dreschler W. A. (2012) Audiologist-driven versus patient-driven fine tuning of hearing instruments. Trends in Amplification 16: 49–58. doi:10.1177/1084713811424884. [DOI] [PMC free article] [PubMed] [Google Scholar]
- Byrne D. (1986) Effects of frequency response characteristics on speech discrimination and perceived intelligibility and pleasantness of speech for hearing-impaired listeners. The Journal of the Acoustical Society of America 80: 494–504. doi:10.1121/1.394045. [DOI] [PubMed] [Google Scholar]
- Convery E., Keidser G., Dillon H., Hartley L. (2011) A self-fitting hearing aid: Need and concept. Trends in Amplification 15: 157–166. doi:10.1177/1084713811427707. [DOI] [PMC free article] [PubMed] [Google Scholar]
- Cox R. M., Alexander G. C. (1991) Preferred hearing aid gain in everyday environments. Ear and Hearing 12: 123–126. [DOI] [PubMed] [Google Scholar]
- Cox, R. M., & Alexander, G. C. (1992). Maturation of hearing aid benefit: Objective and subjective measurements. Ear and Hearing, 13, 131–141. doi:10.1097/00003446-199206000-00001. [DOI] [PubMed]
- Cox R. M., Alexander G. C., Gilmore C. (1987) Development of the Connected Speech Test (CST). Ear and Hearing 8(Suppl 5): 119S–126S. [DOI] [PubMed] [Google Scholar]
- Dreschler W. A., Keidser G., Convery E., Dillon H. (2008) Client-based adjustments of hearing aid gain:The effect of different control configurations. Ear and Hearing 29: 214 doi:10.1097/AUD.0b013e31816453a6. [DOI] [PubMed] [Google Scholar]
- Hornsby B. W. Y., Mueller H. G. (2008) User preference and reliability of bilateral hearing aid gain adjustments. Journal of the American Academy of Audiology 19: 158–170. doi:10.3766/jaaa.19.2.6. [DOI] [PubMed] [Google Scholar]
- Horwitz, A. R., & Turner, C. W. (1997). The time course of hearing aid benefit. Ear and Hearing, 18, 1–11. doi:10.1097/00003446-199702000-00001. [DOI] [PubMed]
- Humes L. E., Wilson D. L., Barlow N. N., Garner C. (2002) Changes in hearing-aid benefit following 1 or 2 years of hearing-aid use by older adults. Journal of Speech, Language, and Hearing Research 45: 772–782. doi:10.1044/1092-4388(2002/062. [DOI] [PubMed] [Google Scholar]
- IEEE (1969) IEEE recommended practice for speech quality measurements. IEEE Transactions on Audio and Electroacoustics 17: 225–246. [Google Scholar]
- Johnson E. E. (2013) Modern prescription theory and application: Realistic expectations for speech recognition with hearing aids. Trends in Amplification 17: 143–170. [DOI] [PMC free article] [PubMed] [Google Scholar]
- Keidser G., Alamudi K. (2013) Real-life efficacy and reliability of training a hearing aid. Ear and Hearing 34: 619–629. doi:10.1097/AUD.0b013e31828d269a. [DOI] [PubMed] [Google Scholar]
- Keidser G., Brew C., Brewer S., Dillon H., Grant F., Storey L. (2005) The preferred response slopes and two-channel compression ratios in twenty listening conditions by hearing-impaired and normal-hearing listeners and their relationship to the acoustic input. International Journal of Audiology 44: 656–670. doi:10.1080/14992020500266803. [DOI] [PubMed] [Google Scholar]
- Keidser G., Dillon H., Byrne D. (1995) Candidates for multiple frequency response characteristics. Ear and Hearing 16: 562–574. [DOI] [PubMed] [Google Scholar]
- Keidser G., Dillon H., Convery E. (2008) The effect of the baseline response on self-adjustments of hearing aid gain. JASA 124: 1668–1681. [DOI] [PubMed] [Google Scholar]
- Killion M. (1979) Equalization filter for eardrum-pressure recording using a KEMAR manikin. Journal of the Audio Engineering Society 27: 13–16. [Google Scholar]
- Kochkin S. (2012) MarkeTrak VIII: The key influencing factors in hearing aid purchase intent. Hearing Review 19: 12–25. [Google Scholar]
- Kuk F. K., Harper T., Doubek K. (1994) Preferred real-ear insertion gain on a commercial hearing aid at different speech and noise levels. Journal of the American Academy of Audiology 5: 99–109. [PubMed] [Google Scholar]
- Kuk F. K., Lau C. (1995. a) Effect of initial setting on convergence to optimal hearing aid setting using a simplex method. British Journal of Audiology 29: 263–269. doi:10.3109/03005369509076741. [DOI] [PubMed] [Google Scholar]
- Kuk F. K., Lau C. (1995. b) The application of binomial probability theory to paired comparison judgments. American Journal of Audiology 4: 37–42. doi:10.1044/1059-0889.0401.37. [Google Scholar]
- Kuk F. K., Lau C. (1996. a) Comparison of preferred frequency gain settings obtained with category rating and modified simplex procedure. Journal of the American Academy of Audiology 7: 322. [PubMed] [Google Scholar]
- Kuk F. K., Lau C. (1996. b) Effect of hearing aid experience on preferred insertion gain selection. Journal of American Academy of Audiology 7: 274–281. [PubMed] [Google Scholar]
- Kuk F. K., Pape N. M. C. (1992) The reliability of a modified simplex procedure in hearing aid frequency-response selection. Journal of Speech, Language, and Hearing Research 35: 418–429. doi:10.1044/jshr.3502.418. [DOI] [PubMed] [Google Scholar]
- Kuk F. K., Pape N. M. C. (1993) Relative satisfaction for frequency responses selected with a simplex procedure in different listening conditions. Journal of Speech, Language, and Hearing Research 36: 168–177. doi:10.1044/jshr.3601.168. [DOI] [PubMed] [Google Scholar]
- Mackersie C., Boothroyd A., Lithgow A. (2018) A “Goldilocks” approach to hearing-aid self-fitting: Ear-canal output and speech intelligibility index. Ear and Hearing. . Advance online publication. doi:10.1097/AUD.0000000000000617. [DOI] [PMC free article] [PubMed] [Google Scholar]
- Marriage, J., Moore, B. C. J., & Alcántara, J. I. (2004). Comparison of three procedures for initial fitting of compression hearing aids. III. Inexperienced versus experienced users. International Journal of Audiology, 43, 198–210. doi:10.1080/14992020400050028. [DOI] [PubMed]
- Moore B. C. J., Füllgrabe C., Stone M. A. (2011) Determination of preferred parameters for multichannel compression using individually fitted simulated hearing aids and paired comparisons. Ear and Hearing 32: 556–568. doi:10.1097/AUD.0b013e31820b5f4c. [DOI] [PubMed] [Google Scholar]
- Mueller H. G., Hornsby B. W. Y., Weber J. E. (2008) Using trainable hearing aids to examine real-world preferred gain. Journal of the American Academy of Audiology 19: 758–773. doi:10.3766/jaaa.19.10.4. [DOI] [PubMed] [Google Scholar]
- Neuman A. C., Levitt H., Mills R., Schwander T. (1987) An evaluation of three adaptive hearing aid selection strategies. The Journal of the Acoustical Society of America 82: 1967–1976. doi:10.1121/1.395641. [DOI] [PubMed] [Google Scholar]
- Polonenko M. J., Scollie S. D., Moodie S., Seewald R. C., Laurnagaray D., Shantz J., Richards A. (2010) Fit to targets, preferred listening levels, and self-reported outcomes for the DSL v5.0a hearing aid prescription for adults. International Journal of Audiology 49: 550–560. doi:10.3109/14992021003713122. [DOI] [PubMed] [Google Scholar]
- Preminger J. E., Neuman A. C., Bakke M. H., Walters D., Levitt H. (2000) An examination of the practicality of the simplex procedure. Ear and Hearing 21: 177–193. [DOI] [PubMed] [Google Scholar]
- Punch J. L., Howard M. T. (1978) Listener-assessed intelligibility of hearing aid-processed speech. Journal of the American Auditory Society 4: 69–76. [PubMed] [Google Scholar]
- Punch J. L., Parker C. A. (1981) Pairwise listener preferences in hearing aid evaluation. Journal of Speech, Language, and Hearing Research 24: 366–374. doi:10.1044/jshr.2403.366. [DOI] [PubMed] [Google Scholar]
- Punch J. L., Rakerd B., Amlani A. M. (2001) Paired-comparison hearing aid preferences: Evaluation of an unforced-choice paradigm. Journal of the American Academy of Audiology 12: 190–201. [PubMed] [Google Scholar]
- R Core Team (2016) R: A language and environment for statistical computing, Vienna, Austria: R Foundation for Statistical Computing. [Google Scholar]
- Smeds K. (2004) Is normal or less than normal overall loudness preferred by first-time hearing aid users? Ear and Hearing 25: 159–172. [DOI] [PubMed] [Google Scholar]
- Smeds K., Keidser G., Zakis J., Dillon H., Leijon A., Grant F., Brew C. (2006) Preferred overall loudness. II: Listening through hearing aids in field and laboratory tests. International Journal of Audiology 45: 12–25. doi:10.1080/14992020500190177. [DOI] [PubMed] [Google Scholar]
- Souza, P. E., & Kitch, V. J. (2001). Effect of preferred volume setting on speech audibility in different hearing aid circuits. Journal of the American Academy of Audiology, 12, 415–422. [PubMed]
- Stelmachowicz P. G., Lewis D. E., Carney E. (1994) Preferred hearing-aid frequency responses in simulated listening environments. Journal of Speech, Language, and Hearing Research 37: 712–718. doi:10.1044/jshr.3703.712. [DOI] [PubMed] [Google Scholar]
- van Buuren R. A., Festen J. M., Plomp R. (1995) Evaluation of a wide range of amplitude-frequency responses for the hearing impaired. Journal of Speech, Language, and Hearing Research 38: 211–221. doi:10.1044/jshr.3801.211. [DOI] [PubMed] [Google Scholar]
- Wong L. L. N. (2011) Evidence on self-fitting hearing aids. Trends in Amplification 15: 215–225. [DOI] [PMC free article] [PubMed] [Google Scholar]
- Zakis J. A., Dillon H., McDermott H. J. (2007) The design and evaluation of a hearing aid with trainable amplification parameters. Ear and Hearing 28: 812–830. doi:10.1097/AUD.0b013e3181576738. [DOI] [PubMed] [Google Scholar]