

Staphylococcus aureus lipase (SAL), a possible target for anti-staphylococcal drugs, was expressed in Escherichia coli, purified and crystallized. A complete data set to 3.0 Å resolution was corrected and analyzed, suggesting a tetragonal space group (P4122 or P4322, a = b = 131.0, c = 250.6 Å) and four molecules per asymmetric unit.
Keywords: lipase, Staphylococcus aureus, virulence factors, toxins, crystallization
Abstract
Staphylococcus aureus lipase (SAL), a triacylglycerol esterase, is an important virulence factor in S. aureus and may be a therapeutic target for infectious diseases caused by S. aureus. For the purposes of anti-SAL drug development using structure-based drug design, X-ray crystallographic analysis of SAL overexpressed in Escherichia coli was performed. The recombinant protein was purified using a three-step protocol involving immobilized metal-affinity chromatography, cation-exchange chromatography and anion-exchange chromatography flowthrough methods, yielding 40 mg of protein per litre of bacterial culture. Crystals were obtained using the sitting-drop vapor-diffusion technique. Diffraction data to 3.0 Å resolution were collected on the BL44XU beamline at SPring-8 at the zinc peak of 1.2842 Å for SAD phasing. The crystals belonged to space group P4122 or P4322, with unit-cell parameters a = 131.0, b = 131.0, c = 250.6 Å, and are likely to contain four SAL molecules (408 residues) per asymmetric unit.
1. Introduction
Staphylococcus aureus, which is a round-shaped Gram-positive bacterium, is a major human pathogen that causes a wide variety of clinical infections (Lowy, 1998 ▸). It sometimes produces opportunistic infectious diseases. S. aureus is one of the most important pathogenic bacteria in purulent infections and is frequently isolated from the skin of patients with atopic dermatitis or impetigo during flare-ups. S. aureus produces a wide variety of toxins that contribute to its ability to colonize and cause disease in mammalian hosts (Dinges et al., 2000 ▸). Its pathogenicity is associated with genes that encode a wide range of virulence factors that are responsible for a variety of toxin-mediated as well as suppurative diseases, ranging from skin or soft-tissue abscesses to fatal necrotizing infections (Hu et al., 2012 ▸). This bacterium has also become a serious problem with the increasing dissemination of methicillin-resistant S. aureus, which has made the development of new treatment options for serious infections a matter of grave concern, as it has a tolerance gene and shows resistance to various antimicrobial drugs (Zetola et al., 2005 ▸).
S. aureus lipase (SAL), which belongs to the glycerol ester hydrolases, shows strong cytopathicity to host cells (Kamitani et al., 2015 ▸). SAL is one of the etiological factors of S. aureus and it interferes with granulocyte function in the host and increases the survival of the bacterium during host defense by inactivating germicidal lipids (Hu et al., 2012 ▸). In addition, when it is attached to the skin S. aureus strongly reduces the barrier function of the skin using SAL. It contributes to skin colonization by hydrolyzing human sebum as a nutrient source (Kuroda et al., 2007 ▸). It has been observed that lipase activity is associated with cell necrosis toxicity (Kamitani et al., 2015 ▸).
SAL also contributes to colonization and invasion by S. aureus (Ünlü et al., 2015 ▸). It hydrolyzes lipids, making it possible for the bacteria to survive in sebaceous areas of the body. It has been well established that colonization and infection by S. aureus are associated with atopic dermatitis (Findley & Grice, 2014 ▸). Several SAL variants have been purified and enzymatically characterized (Ünlü et al., 2015 ▸; Rosenstein & Götz, 2000 ▸). However, the three-dimensional structure of SAL has not been determined.
Here, we report the expression, purification, kinetic characterization, crystallization and preliminary X-ray diffraction analysis of SAL to shed light on the as yet undiscovered structural basis for the action of SAL and to help with the development of an anti-SAL drug using structure-based drug design.
2. Materials and methods
2.1. Macromolecule production
2.1.1. Cloning and expression of SAL
The SAL gene was cloned into pCold II vector (Takara) and amplified by PCR with KOD FX DNA polymerase (Toyobo) using chromosomal DNA from environmentally isolated S. aureus prepared as described previously (O’Reilly et al., 1981 ▸). The primers for SAL gene amplification were 5′-CCATATGAAAGCGAATCAAGTACAACCAC-3′ and 5′-CTCGAGTTTAACTTGCTTTCAATTGTGTTCC-3′. The amplified DNA fragment was cloned into pCold II vector between the NdeI and XhoI sites using an In-Fusion HD Cloning Kit (Takara) in accordance with the manufacturer’s instructions. The constructed plasmid, called pCold II–mSAL, was introduced into Escherichia coli strain BL21(DE3) cells (Novagen). Macromolecule-production information is summarized in Table 1 ▸.
Table 1. Macromolecule-production information.
| Source organism | S. aureus |
| DNA source | GenBank M12715 |
| Forward primer | 5′-CCATATGAAAGCGAATCAAGTACAACCAC-3′ |
| Reverse primer | 5′-CTCGAGTTTAACTTGCTTTCAATTGTGTTCC-3′ |
| Cloning vector | pCold II |
| Expression vector | pCold II–mSAL |
| Expression host | E. coli BL21(DE3) |
| Complete amino-acid sequence of the construct produced | MNHKVHHHHHHMKANQVQPLNKYPVVFVHGFLGLVGDNAPALYPNYWGGNKFKVIEELRKQGYNVHQASVSAFGSNYDRAVQLYYYIKGGRVDYGAAHAAKYGHERYGKTYKGIMPNWEPGKKVHLVGHSMGGQTIRLMEEFLRNGNKEEIAYHQAHGGEISPLFTGGHNNMVASITTLATPHNGSQAADKFGNTEAVRKIMFALNRFMGNKYSNIDLGLTQWGFKQLPNESYIDYIKRVSKSKIWTSDDNAAYDLTLDGSAKLNNMTSMNPNITYTTYTGVSSHTGPLGYENPDLGTFFLMDTTSRIIGHDAREEWRKNDGVVPVISSLHPSNQPFVNVTNNEPATRRGIWQVKPILQGWDHVDFIGVDFLDFKRKGSELANFYIGIINDLLSVEATEGKGTQLKAS |
2.1.2. Protein expression and purification
20 ml of an overnight culture of E. coli BL21(DE3) cells transformed with pCold II–mSAL was inoculated into 1 l LB medium with 50 µg ml−1 ampicillin (Table 1 ▸). The culture broth was grown at 310 K until the absorbance at 600 nm reached 0.5. Protein expression was then induced by the addition of isopropyl β-d-1-thiogalactopyranoside (IPTG; Nacalai Japan) to the culture to a final concentration of 0.4 mM. The temperature of the cell cultures was then decreased to 288 K for 24 h. The cells were harvested by centrifugation at 4000 rev min−1 for 30 min at 277 K, washed with ice-cold deionized distilled water, suspended in lysis buffer (50 mM Tris–HCl buffer pH 8.0 including 0.3 M NaCl and 10 mM imidazole) and disrupted by sonication with an Ultrasonic Disruptor UD-211 (TOMY) at 273 K. The disrupted cell suspension was centrifuged at 8000 rev min−1 for 40 min at 277 K to pellet insoluble material. The supernatant was purified by immobilized metal-affinity chromatography using Nuvia IMAC Resin (Bio-Rad) which had been equilibrated with lysis buffer: the sample was loaded, washed five times with lysis buffer and the soluble recombinant protein was eluted with an imidazole concentration gradient (10–300 mM) in lysis buffer. The SAL fraction was collected and dialyzed against buffer A (0.1 M NaCl, 10 mM sodium phosphate pH 7.0) to remove imidazole. Further purification was carried out by SP (Toyopal) column chromatography; the column was equilibrated with buffer A, the dialyzed protein was loaded and washed five times with buffer A and the protein was eluted with an NaCl concentration gradient (0.2–1.0 M). The fractions containing the SAL protein were combined and dialyzed against 0.2 M NaCl, 10 mM MES pH 6.0. The dialyzed SAL solution was then loaded onto a Mono Q (GE Healthcare) chromatography column to remove foreign substances and the flowthrough fractions were collected as the final purified protein. The SAL protein was concentrated to 30 mg ml−1 using a Vivaspin 15 Turbo concentrator (Sartorius, Germany) and sterilized by filtration through a 0.1 µm Ultrafree-MC (Merck Millipore, Germany) device. The homogeneity of the purified preparation was confirmed by 12% SDS–PAGE (Fig. 1 ▸).
Figure 1.
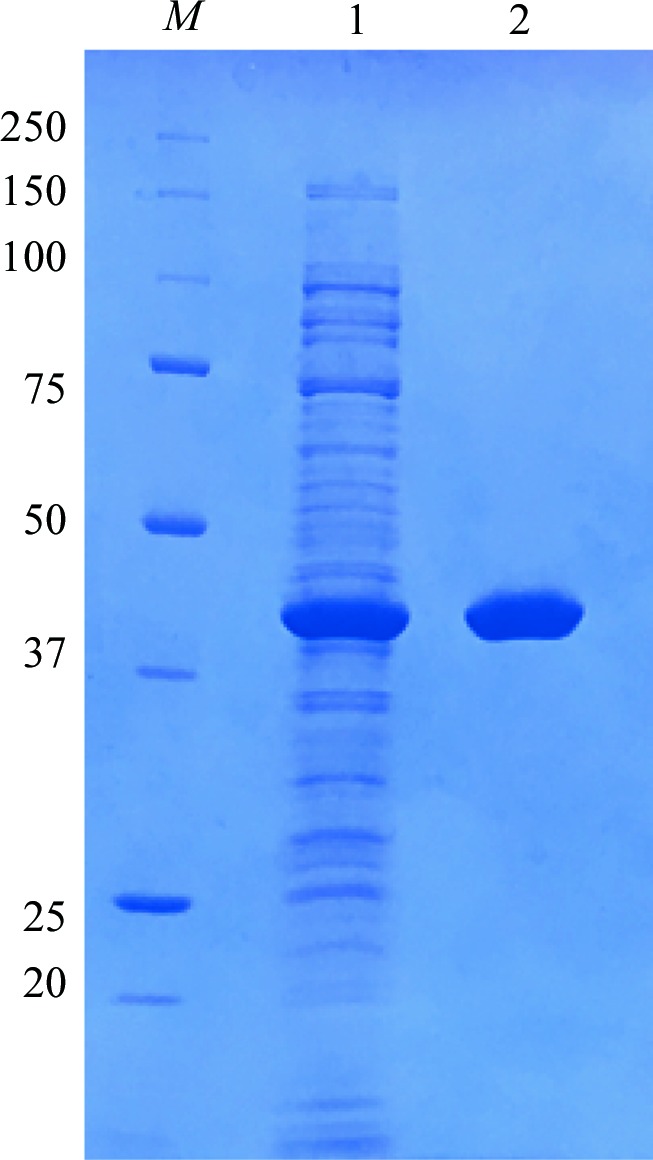
SDS–PAGE gel (12%) stained with Coomassie Brilliant Blue. Lane M, molecular-mass markers (labeled in kDa); lane 1, cell lysate; lane 2, purified protein.
2.1.3. Determination of specific activity
Enzymatic activities were determined using p-nitrophenylbutyrate (pNPB) ester substrate. The concentration of the enzyme was adjusted to 0.001 mM and that of pNFB to 1 mM. Each assay was performed at 310 K in 50 mM Tris–HCl pH 8.0 containing 10% dimethylformamide in 1 ml cuvettes. Reactions were started by the addition of substrate after pre-incubation at 298 K for 15 min. The absorbance of the liberated p-nitrophenol was monitored continuously at 405 nm, and the initial linear velocity was used to calculate the specific activity of SAL. An absorption coefficient of 18.5 mM –1 cm−1, determined experimentally, was used for all calculations (Bowers et al., 1980 ▸). The kinetic parameters of SAL were determined using different concentrations (0.05–1 mmol l−1) of p-nitrophenyl ester. Initial rate determinations were carried out at least three times, and kinetic parameters (k cat and K m) were determined using averaged data at each concentration with the Michaelis–Menten equation.
2.2. Crystallization
For crystallization experiments, a 30 mg ml−1 solution of the recombinant SAL was prepared in 0.2 M NaCl, 10 mM Tris–HCl pH 8.0. Crystallization trials were set up at 295 K as sitting-drop vapor-diffusion experiments in Cryschem crystallization plates. Initial screening was performed using the sparse-matrix method (Jancarik & Kim, 1991 ▸) with commercial crystal screening kits (Hampton Research and Rigaku). Several optimizations of the conditions were performed by changing the protein concentration, precipitant concentration and pH.
2.3. Data collection and processing
X-ray diffraction data were collected from SAL crystals at 100 K in a nitrogen stream, supplementing the mother-liquor solution with 30% glycerol as a cryoprotectant. Preliminary X-ray data sets were collected from a single crystal on beamline BL44XU at SPring-8. The X-ray wavelength was 1.2842 Å, which is the wavelength of the zinc anomalous scattering edge, the angle oscillation range was 0.25° and the crystal-to-detector distance was 200 mm. The diffraction images were integrated and scaled using the XDS program package (Kabsch, 2010 ▸).
3. Results and discussion
SAL was expressed in E. coli and purified using a three-step protocol. An overnight culture at 288 K gave a large amount of protein. The protein yield was more than 40 mg per litre of E. coli culture. The final purified protein was confirmed by SDS–PAGE (Fig. 1 ▸) and the enzymatic activity was confirmed using p-nitrophenylbutyrate as a substrate. The K m and k cat values are listed in the Supporting Information.
Initial crystallization screening was performed using various crystallization kits (Wizard I and II from Rigaku and Crystal Screen and Crystal Screen II from Hampton Research). Crystals of the recombinant SAL protein were readily grown from various salt solutions. The best crystals were obtained by equilibration against a solution consisting of 1.0 M sodium potassium tartrate, 0.2 M sodium chloride, 0.1 M Tris–HCl pH 8.0 at 293 K in a sitting-drop vapor-diffusion setup (Table 2 ▸). The crystallization droplets consisted of 1 µl protein solution and 1 µl reservoir solution and were equilibrated against 500 µl reservoir solution; rhombus-like crystals appeared within a few weeks and grew to maximum dimensions of about 0.5 × 0.3 × 0.3 mm (Fig. 2 ▸).
Table 2. Crystallization.
| Method | Sitting-drop vapor diffusion |
| Plate type | 24-well |
| Temperature (K) | 295 |
| Protein concentration (mg ml−1) | 30 |
| Buffer composition of protein solution | 10 mM Tris–HCl pH 8.0, 200 mM NaCl |
| Composition of reservoir solution | 1.0 M sodium potassium tartrate, 0.2 M sodium chloride, 0.1 M Tris–HCl pH 8.0 |
| Volume and ratio of drop | 1 µl:1 µl |
| Volume of reservoir (ml) | 0.5 |
Figure 2.
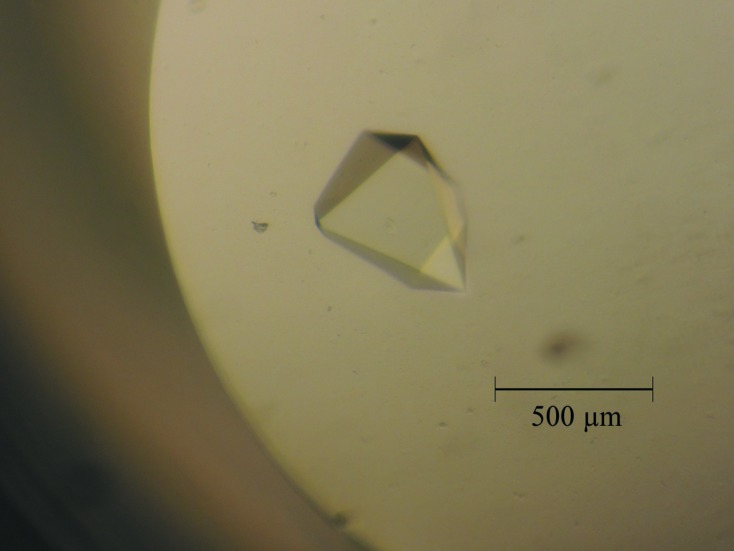
A typical SAL crystal obtained from the crystallization experiments. The crystal had approximate maximum dimensions of 0.5 × 0.3 × 0.3 mm.
X-ray diffraction data were collected at a resolution of 3.0 Å (Fig. 3 ▸). The crystals belonged to the tetragonal space group P4122 or P4322, with unit-cell parameters a = 131.0, b = 131.0, c = 250.6 Å (Table 3 ▸). A total of 638 350 reflections in the resolution range 50.0–3.0 Å were collected with 99.9% completeness. The data-collection and processing statistics are summarized in Table 3 ▸. Assuming a molecular mass of 45.7 kDa (408 residues) for the expressed SAL domain, packing-density calculations indicate the most probable value for V M to be 2.94 Å3 Da−1, with four SAL chains per asymmetric unit. This corresponds to a solvent fraction of about 58.2%, which is a typical value for protein crystals (Matthews, 1968 ▸).
Figure 3.

Diffraction image of an SAL crystal. The circles indicate 8.39, 4.30, 2.98, 2.35 and 1.99 Å resolution, respectively.
Table 3. Data collection and processing.
Values in parentheses are for the outer shell.
| Diffraction source | BL44XU, SPring-8 |
| Wavelength (Å) | 1.2824 |
| Temperature (K) | 100 |
| Detector | EIGER X 16M |
| Crystal-to-detector distance (mm) | 200 |
| Rotation range per image (°) | 0.25 |
| Total rotation range (°) | 200 |
| Exposure time per image (s) | 0.25 |
| Space group | P4122 or P4322 |
| a, b, c (Å) | 131.0, 131.0, 250.6 |
| α, β, γ (°) | 90.0, 90.0, 90.0 |
| Mosaicity (°) | 0.192 |
| Resolution range (Å) | 50–3.0 (3.18–3.00) |
| Total No. of reflections | 638350 |
| No. of unique reflections | 82937 |
| Completeness (%) | 99.9 (99.6) |
| Multiplicity | 7.7 (7.8) |
| 〈I/σ(I)〉 | 9.2 (1.1) |
| CC1/2 | 0.994 (0.429) |
| R r.i.m. | 0.086 (0.194) |
| Overall B factor from Wilson plot (Å2) | 70.4 |
We are currently attempting phase determination by the molecular-replacement method using the crystal structure of S. hyicus lipase (PDB entry 2hih; Tiesinga et al., 2007 ▸), which shares 47.7% identity with SAL, as a search model with Phaser (McCoy et al., 2007 ▸) as included in the CCP4 program package (Winn et al., 2011 ▸). We are also using the crystal structure of Bacillus stearothermophilus L1 zinc-binding lipase (PDB entry 1ku0; Jeong et al., 2002 ▸), which has 33.9% identity to SAL, as a search model.
It was previously determined that one zinc ion is present in the S. hyicus lipase molecule, and the region with the zinc-binding site is conserved in SAL. Furthermore, we have checked the XAFS and collected data sets at the zinc peak wavelength (around 1.2824 Å) in order to resolve the structure using a combination of molecular-replacement and zinc SAD methods. Structural determination is now in progress.
Supplementary Material
Supplementary Table S1.. DOI: 10.1107/S2053230X18010506/nw5079sup1.pdf
Acknowledgments
We are grateful to all staff members of beamlines BL41XU and BL44XU at SPring-8 for their help in collecting data. Use of the synchrotron beamline BL44XU at SPring-8 was obtained through the Cooperative Research Program of the Institute for Protein Research, Osaka University (proposal Nos. 2018A6813, 2017A6716, 2017B67165, 2016A6615, 2016B6615 and 2015B6516).
Funding Statement
This work was funded by Japan Agency for Medical Research and Development grant P1285. Ministry of Education, Culture, Sports, Science and Technology grant .
References
- Bowers, G. N. Jr, McComb, R. B., Christensen, R. G. & Schaffer, R. (1980). Clin. Chem. 26, 724–729. [PubMed]
- Dinges, M. M., Orwin, P. M. & Schlievert, P. M. (2000). Clin. Microbiol. Rev. 13, 16–34. [DOI] [PMC free article] [PubMed]
- Findley, K. & Grice, E. A. (2014). PLoS Pathog. 10, e1004436. [DOI] [PMC free article] [PubMed]
- Hu, C., Xiong, N., Zhang, Y., Rayner, S. & Chen, S. (2012). Biochem. Biophys. Res. Commun. 419, 617–620. [DOI] [PubMed]
- Jancarik, J. & Kim, S.-H. (1991). J. Appl. Cryst. 24, 409–411.
- Jeong, S.-T., Kim, H.-K., Kim, S.-J., Chi, S.-W., Pan, J.-G., Oh, T.-K. & Ryu, S.-E. (2002). J. Biol. Chem. 277, 17041–17047. [DOI] [PubMed]
- Kabsch, W. (2010). Acta Cryst. D66, 125–132. [DOI] [PMC free article] [PubMed]
- Kamitani, S., Miyaki, M., Hatano, M., Yutsudo, T., Minamide, W., Kato, I. & Noda, M. (2015). SOJ Microbiol. Infect. Dis. 2, https://doi.org/10.15226/sojmid.2014.00117.
- Kuroda, M., Nagasaki, S., Ito, R. & Ohta, T. (2007). FEMS Microbiol. Lett. 273, 28–34. [DOI] [PubMed]
- Lowy, F. D. (1998). N. Engl. J. Med. 339, 520–532. [DOI] [PubMed]
- Matthews, B. W. (1968). J. Mol. Biol. 33, 491–497. [DOI] [PubMed]
- McCoy, A. J., Grosse-Kunstleve, R. W., Adams, P. D., Winn, M. D., Storoni, L. C. & Read, R. J. (2007). J. Appl. Cryst. 40, 658–674. [DOI] [PMC free article] [PubMed]
- O’Reilly, M., Dougan, G., Foster, T. J. & Arbuthnott, J. P. (1981). J. Gen. Microbiol. 124, 99–107. [DOI] [PubMed]
- Rosenstein, R. & Götz, F. (2000). Biochimie, 82, 1005–1014. [DOI] [PubMed]
- Tiesinga, J. J., van Pouderoyen, G., Nardini, M., Ransac, S. & Dijkstra, B. W. (2007). J. Mol. Biol. 371, 447–456. [DOI] [PubMed]
- Ünlü, A., Tanriseven, A., Sezen, İ. Y. & Çelik, A. (2015). Biotechnol. Appl. Biochem. 62, 642–651. [DOI] [PubMed]
- Winn, M. D. et al. (2011). Acta Cryst. D67, 235–242.
- Zetola, N., Francis, J. S., Nuermberger, E. L. & Bishai, W. R. (2005). Lancet Infect. Dis. 5, 275–286. [DOI] [PubMed]
Associated Data
This section collects any data citations, data availability statements, or supplementary materials included in this article.
Supplementary Materials
Supplementary Table S1.. DOI: 10.1107/S2053230X18010506/nw5079sup1.pdf