Abstract
Background
The aim of the current study was to investigate the potential prognostic value of minichromosome maintenance (MCM) genes in patients with early-stage pancreatic ductal adenocarcinoma (PDAC) after pancreaticoduodenectomy by using the RNA-sequencing dataset from The Cancer Genome Atlas (TCGA).
Methods
An RNA-sequencing dataset of 112 early-stage PDAC patients who received a pancreaticoduodenectomy was obtained from TCGA. Survival analysis was used to identify potential prognostic values of MCM genes in PDAC overall survival (OS).
Results
Through mining public databases, we observed that MCM genes (MCM2, MCM3, MCM4, MCM5, MCM6, and MCM7) were upregulated in pancreatic cancer tumor tissue and have a strong positive coexpression with each other. Multivariate survival analysis indicated that a high expression of MCM4 significantly increased the risk of death in patients with PDAC, and time-dependent receiver operating characteristic analysis showed an area under the curve of 0.655, 0.587, and 0.509 for a 1-, 2-, and 3-year PDAC OS prediction, respectively. Comprehensive survival analysis of MCM4 using stratified and joint effects survival analysis suggests that MCM4 may be an independent prognostic indicator for PDAC OS. Gene set enrichment analysis indicated that MCM4 may participate in multiple biologic processes and pathways, including DNA replication, cell cycle, tumor protein p53, and Notch signaling pathways, thereby affecting prognosis of PDAC patients.
Conclusions
Our study indicates that MCM2–7 were upregulated in pancreatic cancer tumor tissues, and mRNA expression of MCM4 may serve as an independent prognostic indicator for PDAC OS prediction after pancreaticoduodenectomy.
Keywords: minichromosome maintenance, mRNA, pancreatic ductal adenocarcinoma, prognosis, pancreaticoduodenectomy
Introduction
Pancreatic cancer (PC) is not only a highly lethal malignancy but also has a poor prognosis, low early diagnosis rate, and lacks effective treatment strategies.1–3 In 2012, it was estimated that there would be approximately 330,700 PC deaths worldwide.4 In 2015, the National Central Cancer Registry of China (NCCRC) estimated that there would be approximately 901,000 new cases of PC and 794,000 deaths in China, using data from population-based cancer registries (2009–2011).5 The updated nationwide cancer statistics from the NCCRC, which were estimated on population-based cancer registry data collected from all available cancer registries in 2014, suggest an upward trend in new cases of PC and deaths in China compared to their previous report (2009–2011).5,6
Due to the clinicopathologic features of PC, treatment and management strategies of PC were focused on developing early diagnostic and prognostic monitoring biomarkers. Previous studies have demonstrated that genetic alterations may have a contribution in PC tumorigenesis and progression.7,8 More than 80% of the histologic type of PCs are pancreatic ductal adenocarcinoma (PDAC).4,9,10 Numerous studies have reported that minichromosome maintenance (MCM) genes (including MCM2, MCM3, MCM4, MCM5, MCM6, and MCM7) could serve as a diagnostic and prognostic indicator in multiple cancers.11–14 However, the potential application value and mechanism of MCM genes in the prognostic prediction of PDAC after pancreaticoduodenectomy remain unclear. Therefore, the purpose of the current study was to investigate the potential prognostic application of MCM2–7 for patients with early-stage PDAC after pancreaticoduodenectomy by using an RNA-sequencing (RNA-Seq) dataset from The Cancer Genome Atlas (TCGA).
Materials and methods
Public database mining of MCM genes
With the development of high-throughput technologies, a large number of genome-wide expression profiling data have been published and freely shared with researchers, especially the whole genome dataset of cancer diseases. In the present study, we used the Genotype-Tissue Expression (GTEx; https://www.gtexportal.org/home/, accessed March 20, 2018) website to investigate the mRNA expression distribution of MCM genes in normal organ tissues.15–17 The Gene Expression Profiling Interactive Analysis (GEPIA; http://gepia.cancer-pku.cn/index.html; accessed March 20, 2018) website was used to investigate the mRNA expression distribution of MCM genes in pancreatic adenocarcinoma (PAAD), which is an online analysis tool based on the RNA-Seq expression data of 9,736 tumors and 8,587 normal samples from TCGA and the GTEx projects.18 We also used the Metabolic gEne RApid Visualizer (MERAV; http://merav.wi.mit.edu/; accessed March 20, 2018), comprising human gene expression data from normal tissues, primary tumors, and cancer cell lines, to further validate the expression distribution of MCM genes between PC and adjacent normal tissues.19
Comprehensive survival analysis of MCM genes
The RNA-Seq dataset of PAAD was downloaded from TCGA (https://portal.gdc.cancer.gov/; accessed April 20, 2017)20 and the raw data were normalized by DESeq.21 The corresponding clinical information was downloaded from the University of California, Santa Cruz Xena (UCSC Xena: http://xena.ucsc.edu/, accessed April 20, 2017). To ensure the reliability of prognostic analysis, we have established a strict patient inclusion criteria and exclusion criteria, which have been published in our previous paper and are described as follows: 1) complete survival data available; 2) the histology type was PDAC; 3) pathologic stage I or II; 4) patients underwent pancreaticoduodenectomy.22 PDAC patients with pathologic stage III or IV disease who underwent other types of surgery were excluded.22 To comprehensively investigate the prognostic values of MCM genes in PDAC, multivariate Cox proportional risk regression model analysis was used to screen the genes by adjusting for clinical parameters that were significantly associated with PDAC overall survival (OS) in univariate survival analysis. Subsequently, comprehensive survival analysis of prognostic-MCM genes was performed, including evaluation by the survivalROC package in the R platform, stratified survival analysis, nomogram construction, and joint effect survival analysis.
Gene set enrichment analysis
To investigate the biologic processes involved in the clinical outcome of PDAC with different expression levels of prognostic-MCM genes, we carried out a gene set enrichment analysis (GSEA, http://software.broadinstitute.org/gsea/index.jsp, accessed December 15, 2017).23,24 GSEA was used to deep mine the potential mechanisms of prognostic-MCM genes using the Molecular Signatures Database (MSigDB) c2 (c2.cp.kegg.v6.1.symbols.gmt) and c5 (c5.all.v6.1.symbols.gmt).25 The significantly enriched gene sets in the GSEA were identified with the following criteria: a nominal P-value <0.05 and false discovery rate (FDR) <0.25.
Statistical analysis
FDRs in the GSEA were adjusted for multiple testing with the Benjamini–Hochberg procedure to control FDR.26–28 Univariate survival analysis of clinical features and MCM genes were compared using the log-rank test; clinicopathologic parameters significantly associated with OS (P<0.05) were entered into the multivariate Cox proportional hazards regression model for adjustment, whereas, hazard ratios (HRs) and 95% CIs were used to assess the relative risk in different PDAC patients that were stratified by MCM gene expression. Coexpression relationships between MCM genes were assessed by the Pearson correlation coefficient. All statistical analyses were conducted with SPSS version 20.0 (IBM Corporation, Armonk, NY, USA) and R3.3.0. Statistical significance was set as a P-value <0.05.
Results
Public database mining of MCM genes
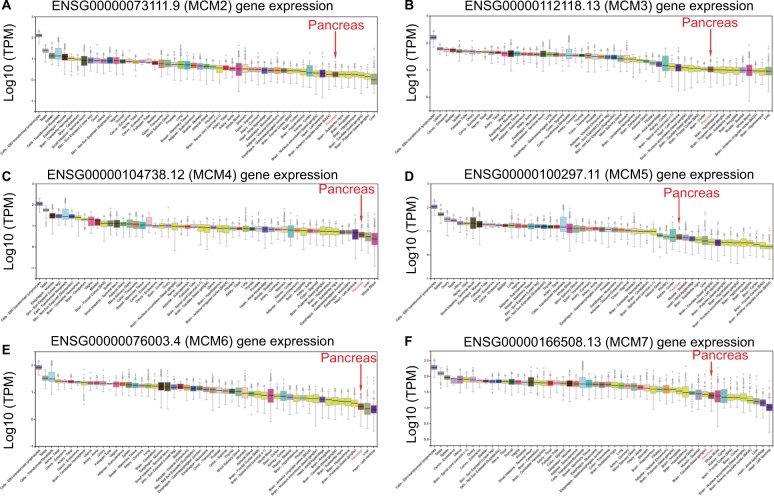
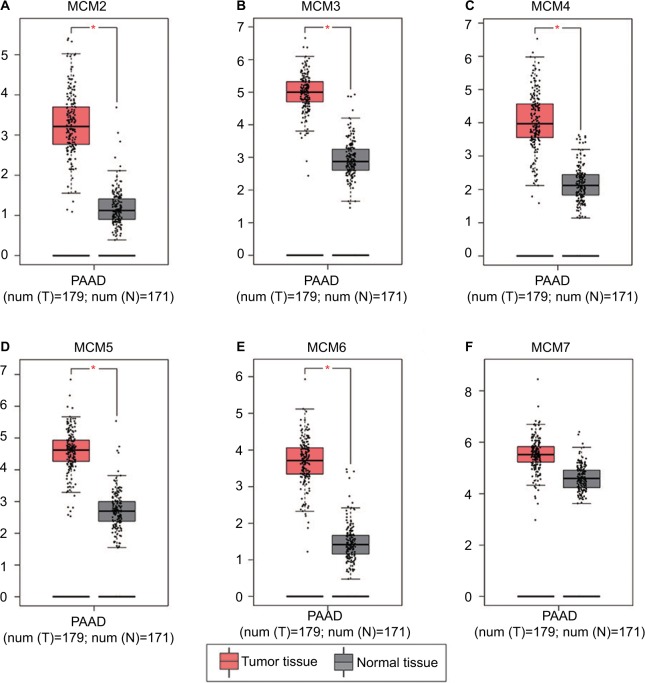
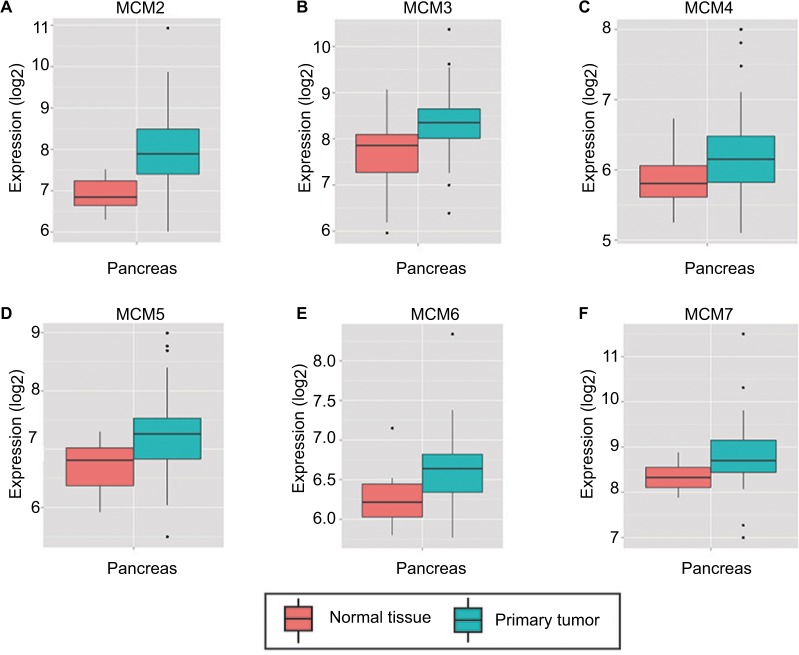
To make a complete investigation of public databases to analyze the distribution and function of MCM genes in humans, the distribution of MCM genes in human normal organ tissues was investigated by GTEx and is shown in Figure 1A–F. The gene distribution suggests that the expression of MCM2–7 genes was low in human pancreas tissues compared to other organ tissues. An investigation using GEPIA indicated that MCM2–7 genes were upregulated in human tumor tissues (Figure S1A–F and Figure S2 A–F), which is based on TCGA and GTEx databases, as well as in PAAD (Figure 2A–F). The distribution of upregulated MCM2–7 genes in PC was also verified by the MERAV online analysis tool (Figure 3A–F), which is based on the database of Gene Expression Omnibus.
Figure 1.
Expression distribution of MCM2–7 in human normal organ tissues.
Notes: Expression distribution box plot of MCM2 (A); MCM3 (B); MCM4 (C); MCM5 (D); MCM6 (E); MCM7 (F).
Abbreviation: MCM, minichromosome maintenance.
Figure 2.
Expression distribution of MCM2–7 between PAAD tumor and normal tissues.
Notes: Expression distribution box plot of MCM2 (A); MCM3 (B); MCM4 (C); MCM5 (D); MCM6 (E); MCM7 (F). Expressions of MCM genes were upregulated in PDAC tumor tissues. *P<0.05.
Abbreviations: MCM, minichromosome maintenance; PAAD, pancreatic adenocarcinoma.
Figure 3.
Expression distribution of MCM2–7 between PC tumor and normal tissues that was carried out by MERAV. Expressions of MCM genes were upregulated in PC tumor tissues.
Notes: Expression distribution box plot of MCM2 (A); MCM3 (B); MCM4 (C); MCM5 (D); MCM6 (E); MCM7 (F).
Abbreviations: MCM, minichromosome maintenance; MERAV, Metabolic gEne RApid Visualizer; PC, pancreatic cancer.
Bioinformatics analysis
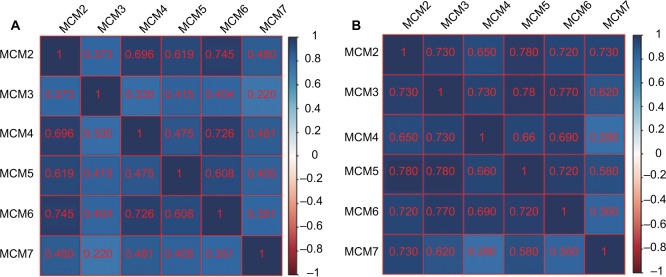
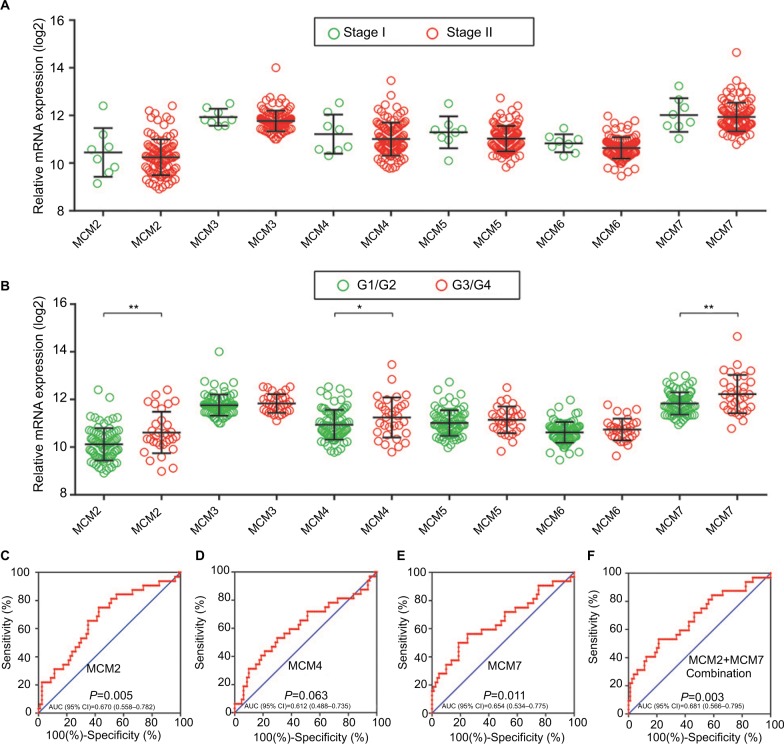
The RNA-Seq dataset of early-stage PDAC patients who underwent pancreaticoduodenectomy was obtained from TCGA PAAD project.22 By implementing inclusion and exclusion criteria, a total of 112 early-stage PDAC patients met the above criteria and were included in further analysis. Coexpression of MCM2–7 genes in PDAC tumor tissue is shown in Figure 4A, which substantiates the strongly positive coexpression of these genes in PDAC tumor tissues (Pearson correlation coefficient ranged 0.220–0.745; all P<0.05). The strongly positive coexpression of these genes could also be observed in normal human pancreatic tissue in GEPIA, which is based on the GTEx database (Figure 4B, Pearson correlation coefficient ranged 0.280–0.780; all P<0.05). The bioinformatics prediction performed by Gene Multiple Association Network Integration Algorithm (GeneMANIA, http://www.genemania.org/, accessed March 20, 2018)29 and Search Tool for the Retrieval of Interacting Genes/Proteins (STRING, https://string-db.org/, accessed March 20, 2018)30 also suggest that MCM2–7 genes were strongly coexpressed with each other and with complex gene–gene and protein–protein interaction networks (Figure S3A, B). In addition, we investigated the expression distribution of MCM2–7 genes in different tumor stages and histologic grades and found that the expression of MCM2–7 genes was not significantly differentially distributed between stage I and stage II tumor tissues (Figure 5A), whereas expressions of MCM2, MCM4, and MCM7 were significantly differentially distributed between histologic grade G1/G2 and G3/G4 tumor tissues (Figure 5B). Furthermore, we also explored the ability of MCM2, MCM4, and MCM7 (Figure 5C–E) to distinguish histologic grade G1/G2 and G3/G4 tumor tissues using the area under the curve (AUC) of a receiver operating characteristic (ROC) curve. ROC analysis indicated that MCM2 (P=0.005, AUC=0.670, 95% CI=0.558–0.782; Figure 5C) and MCM7 (P=0.011, AUC=0.654, 95% CI=0.534–0.775; Figure 5E) may have potential in distinguishing histologic grade G1/G2 and G3/G4 tumor tissues in PDAC, and a combination of MCM2 and MCM6 could improve diagnostic efficiency (P=0.003, AUC=0.681, 95% CI=0.566–0.795; Figure 5F).
Figure 4.
Coexpression matrix of MCM genes in PDAC tumor tissues and human normal pancreas tissues, and demonstrated that MCM2–7 were strongly positively correlation and coexpressed with each other in both PDAC tumor and normal pancreas tissues.
Notes: (A) Coexpression matrix of MCM genes in PDAC tumor tissues; (B) coexpression matrix of MCM genes in human normal pancreas tissues.
Abbreviations: MCM, minichromosome maintenance; PDAC, pancreatic ductal adenocarcinoma.
Figure 5.
Gene expression distribution of MCM genes in different PDAC tumor stages and histologic grades, and ROC curves of MCM genes to distinguish different PDAC histologic grades.
Notes: (A) Gene expression distribution of MCM genes in different PDAC tumor stages; (B) gene expression distribution of MCM genes in different PDAC histologic grades; ROC curves of MCM2 (C), MCM4 (D), MCM7 (E) and MCM2 + MCM7 (F) combination to distinguish different PDAC histological grades. *P<0.05, **P<0.01.
Abbreviations: AUC, area under the curve; MCM, minichromosome maintenance; PDAC, pancreatic ductal adenocarcinoma; ROC, receiver operating characteristic.
Survival analysis of MCM2–7 in PDAC OS
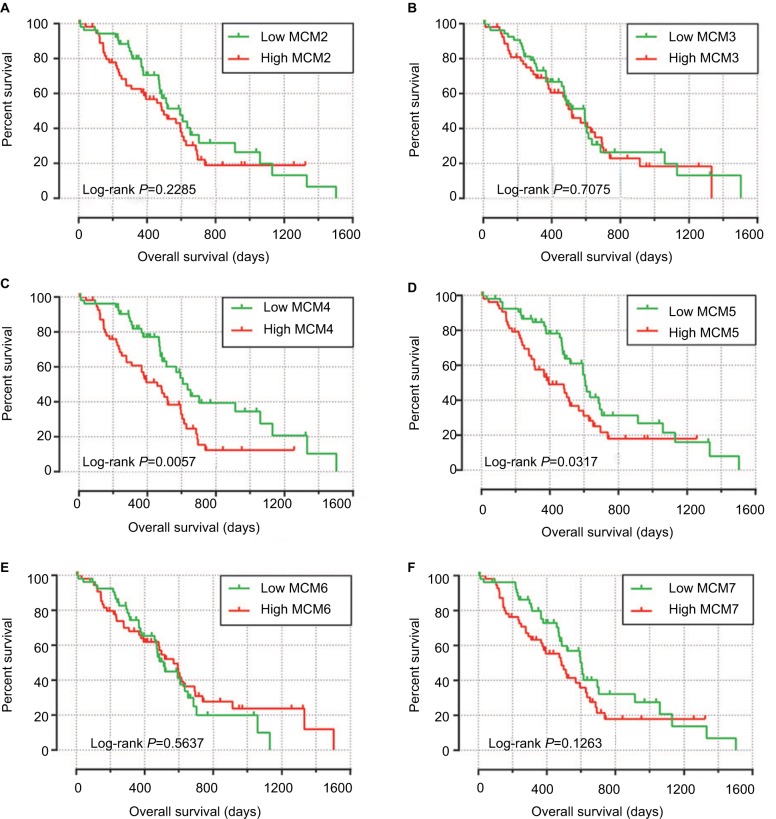
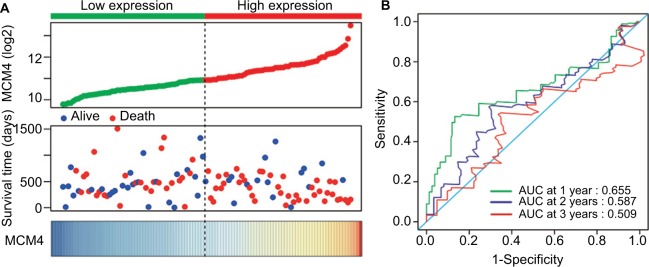
Baseline information of these 112 PDAC patients is shown in Table 1, and clinical parameters of histologic grade, radical resection, radiation therapy, and targeted molecular therapy were significantly associated with PDAC OS, which needed to be adjusted into a multivariate Cox proportional hazards regression model. Survival analysis of the MCM2–7 genes (Figure 6A–F) demonstrated that MCM4 was significantly associated with PDAC OS, and high expression of MCM4 was significantly increased with the risk of death in PDAC (adjusted P=0.003, adjusted HR=2.409, 95% CI=1.351–4.294, Table 2, Figure 6C) and promoted a poor OS (high MCM4 vs low MCM4; 458 days vs 634 days, Table 2, Figures 6C and 7A). We also performed a time-dependent ROC analysis, which was carried out using survivalROC in the R platform, to evaluate the predictive accuracy of MCM4 expression in PDAC OS, and demonstrated that MCM4 expression performed well in predicting PDAC OS. The AUC of the time-dependent ROC curve was 0.655, 0.587, and 0.509 for 1-, 2-, and 3-year survival (Figure 7B), respectively.
Table 1.
Correlation between OS and clinicopathologic features of PDAC patientsa
| Variables | Events/total (n=112) | MST (days) | HR (95% CI) | Log-rank P-value |
|---|---|---|---|---|
| Age (years) | 0.066 | |||
| ≤60 | 20/38 | 593 | 1 | |
| >60 | 49/74 | 485 | 1.636 (0.962–2.780) | |
| Gender | 0.523 | |||
| Female | 36/53 | 511 | 1 | |
| Male | 33/59 | 592 | 0.855 (0.529–1.382) | |
| Alcohol historyb | 0.349 | |||
| No | 25/43 | 592 | 1 | |
| Yes | 38/61 | 511 | 1.276 (0.765–2.128) | |
| Pathologic stage | 0.943 | |||
| Stage I | 4/8 | 236 | 1 | |
| Stage II | 65/104 | 518 | 1.038 (0.375–2.872) | |
| Pathological T | 0.466 | |||
| T1/T2 | 7/14 | 498 | 1 | |
| T3 | 62/98 | 518 | 1.340 (0.608–2.949) | |
| Pathological N | 0.091 | |||
| N0 | 9/21 | 634 | 1 | |
| N1 | 60/91 | 511 | 1.818 (0.899–3.678) | |
| Pathological M | 0.319 | |||
| M0 | 31/55 | 593 | 1 | |
| Mx | 38/57 | 485 | 1.278 (0.787–2.075) | |
| Histologic grade | 0.010 | |||
| G1/G2 | 45/80 | 596 | 1 | |
| G3/G4 | 24/32 | 470 | 1.919 (1.156–3.185) | |
| Radical resectionc | 0.009 | |||
| R1/Rx | 29/44 | 381 | 1 | |
| R0 | 39/66 | 603 | 0.514 (0.310–0.852) | |
| Radiation therapyd | 0.029 | |||
| No | 48/70 | 473 | 1 | |
| Yes | 15/30 | 691 | 0.527 (0.293–0.947) | |
| Targeted molecular therapye | <0.001 | |||
| No | 24/29 | 224 | 1 | |
| Yes | 41/73 | 634 | 0.168 (0.095–0.296) |
Notes:
The data in this table also have been shown in our previous publication22.
Alcohol history information is unavailable in eight patients;
Radical resection information is unavailable in two patients.
Radiation therapy information is unavailable in 12 patients.
Targeted molecular therapy information is unavailable in ten patients.
Abbreviations: HR, hazard ratio; MST, median survival time; OS, overall survival; PDAC, pancreatic ductal adenocarcinoma.
Figure 6.
Kaplan–Meier survival curves for MCM genes in pancreatic ductal adenocarcinoma of The Cancer Genome Atlas cohort.
Notes: Overall survival stratified by MCM2 (A), MCM3 (B), MCM4 (C), MCM5 (D), MCM6 (E), and MCM7 (F).
Abbreviation: MCM, minichromosome maintenance.
Table 2.
Prognostic values of MCM genes expression in PDAC OS of TCGA cohort
| Gene expression | Events/total (n=112) | MST (days) | Crude HR (95% CI) | Crude P-value | Adjusted HR (95% CI) | Adjusted P-valuea |
|---|---|---|---|---|---|---|
| MCM2 | ||||||
| Low | 31/56 | 592 | 1 | 1 | ||
| High | 38/56 | 498 | 1.345 (0.828–2.185) | 0.230 | 1.614 (0.929–2.805) | 0.089 |
| MCM3 | ||||||
| Low | 33/56 | 592 | 1 | 1 | ||
| High | 36/56 | 517 | 1.096 (0.679–1.769) | 0.708 | 0.773 (0.453–1.320) | 0.346 |
| MCM4 | ||||||
| Low | 28/56 | 634 | 1 | 1 | ||
| High | 41/56 | 458 | 1.990 (1.210–3.272) | 0.007 | 2.409 (1.351–4.294) | 0.003 |
| MCM5 | ||||||
| Low | 32/56 | 607 | 1 | 1 | ||
| High | 37/56 | 393 | 1.692 (1.041–2.749) | 0.034 | 1.185 (0.693–2.028) | 0.535 |
| MCM6 | ||||||
| Low | 33/56 | 511 | 1 | 1 | ||
| High | 36/56 | 568 | 0.867 (0.534–1.408) | 0.564 | 1.104 (0.645–1.889) | 0.718 |
| MCM7 | ||||||
| Low | 31/56 | 603 | 1 | 1 | ||
| High | 38/56 | 485 | 1.456 (0.897–2.364) | 0.129 | 1.183 (0.660–2.119) | 0.572 |
Note:
Adjusted for histologic grade, radiation therapy, radical resection, and targeted molecular therapy.
Abbreviations: MCM, minichromosome maintenance; MST, median survival time; OS, overall survival; PDAC, pancreatic ductal adenocarcinoma; TCGA, The Cancer Genome Atlas.
Figure 7.
Prognostic value evaluation of MCM4 in patients with PDAC.
Notes: (A) From top to bottom are the expression values of MCM4, patients’ survival status distribution, and the expression heat map of MCM4 in the low- and high-expression groups. (B) Receiver operating characteristic curve for predicting overall survival in PDAC patients by the MCM4.
Abbreviations: MCM, minichromosome maintenance; PDAC, pancreatic ductal adenocarcinoma.
Comprehensive analysis of MCM4 in PDAC OS
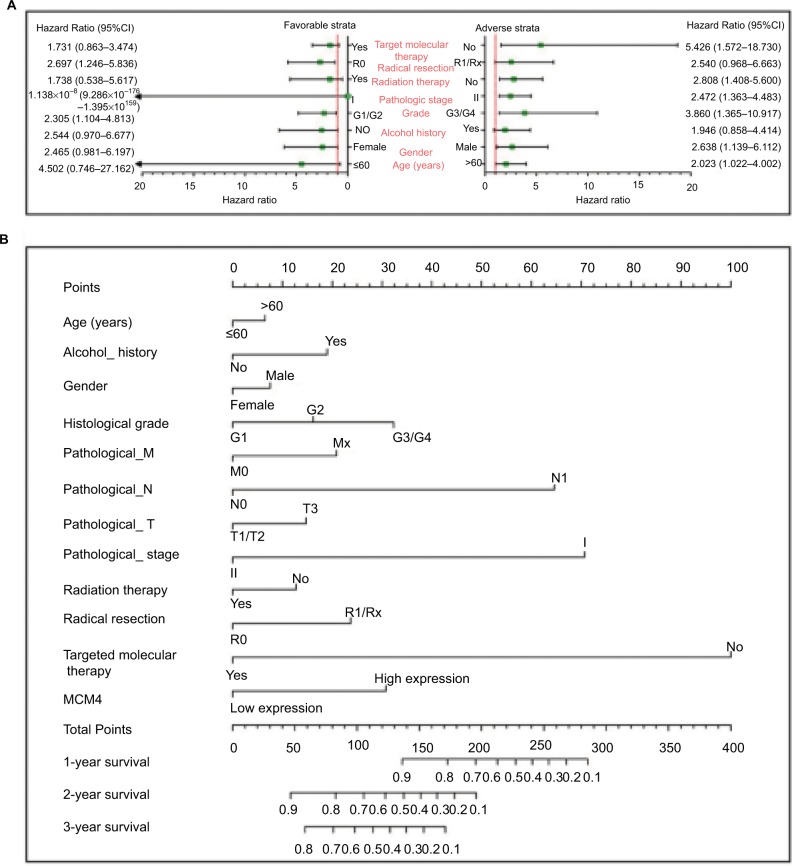
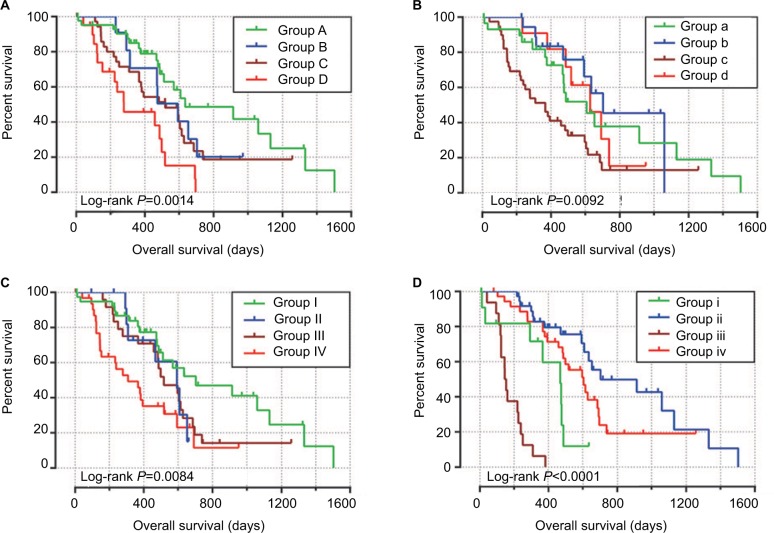
To perform a comprehensive investigation of the role of MCM4 in the prognosis of PDAC, we used a stratified analysis and joint effect survival analysis to assess the prognostic value of MCM4 in PDAC, and developed a nomogram, which included clinical parameters and the MCM4 gene, to evaluate individualized prognostic risk scores. Stratified analysis suggests that high expression of MCM4 was associated with a significantly increased risk of death in PDAC patients except in patients with pathologic stage I, who received radiation therapy and targeted molecular therapy; young patients (≤60 years); female patients, without or with alcohol history; and patients without radical resection (Figure 8A). The nomogram indicated that expression of MCM4 also had a certain contribution to the prognosis of PDAC (Figure 8B). Joint effect survival analysis suggests that a combination of MCM4 and those clinical parameters, which were significantly correlated to PDAC OS, showed a better performance in PDAC OS, compared with single clinical parameters (Figure 9A–D and Table 3).
Figure 8.
The relationship between MCM4 and clinical information.
Notes: (A) Stratified analysis of association between MCM4 and overall survival in pancreatic ductal adenocarcinoma. (B) Nomogram for predicting the 1-, 2-, and 3-year event (death) with MCM4 and clinical information.
Abbreviation: MCM, minichromosome maintenance.
Figure 9.
Joint effects analysis of overall survival stratified by MCM4 and pancreatic ductal adenocarcinoma clinical parameters.
Notes: Joint effects analysis stratified by MCM4 and following clinical parameters: Histologic grade (A), radiation therapy (B), radical resection (C), and targeted molecular therapy (D).
Abbreviation: MCM, minichromosome maintenance.
Table 3.
Joint effects survival analysis of clinical factors and the MCM4 expression with OS in PDAC patients
| Group | MCM4 | Variables | Events/total (n=112) | MST (days) | Crude HR (95% CI) | Crude P-value | Adjusted HR (95% CI) | Adjusted P-valuea |
|---|---|---|---|---|---|---|---|---|
| Histologic grade | ||||||||
| A | Low expression | G1 + G2 | 20/44 | 634 | 1 | 1 | ||
| B | Low expression | G3 + G4 | 8/12 | 592 | 1.652 (0.711–3.837) | 0.243 | 1.782 (0.713–4.457) | 0.217 |
| C | High expression | G1 + G2 | 25/36 | 518 | 1.830 (0.991–3.380) | 0.054 | 2.146 (1.051–4.383) | 0.036 |
| D | High expression | G3 + G4 | 16/20 | 278 | 3.788 (1.893–7.579) | <0.001 | 5.185 (2.373–11.329) | <0.001 |
| Radiation therapyb | ||||||||
| a | Low expression | No | 17/31 | 607 | 1 | 1 | ||
| b | Low expression | Yes | 8/19 | 702 | 0.686 (0.289–1.626) | 0.392 | 1.403 (0.513–3.836) | 0.510 |
| c | High expression | No | 31/39 | 366 | 2.047 (1.097–3.819) | 0.024 | 2.977 (1.509–5.871) | 0.002 |
| d | High expression | Yes | 7/11 | 627 | 1.010 (0.408–2.497) | 0.983 | 0.657 (1.880–5.378) | 0.239 |
| Radical resectionc | ||||||||
| I | Low expression | R0 | 20/41 | 702 | 1 | 1 | ||
| II | Low expression | R1/Rx | 7/13 | 592 | 1.732 (0.708–4.232) | 0.229 | 1.457 (0.555–3.826) | 0.445 |
| III | High expression | R0 | 19/25 | 517 | 1.775 (0.924–3.408) | 0.085 | 2.413 (1.162–5.014) | 0.018 |
| IV | High expression | R1/Rx | 22/31 | 308 | 2.975 (1.560–5.673) | 0.001 | 3.498 (1.724–7.101) | 0.01 |
| Targeted molecular therapyd | ||||||||
| i | Low expression | No | 8/13 | 467 | 1 | 1 | ||
| ii | Low expression | Yes | 18/37 | 702 | 0.239 (0.098–0.583) | 0.002 | 0.204 (0.076–0.547) | 0.002 |
| iii | High expression | No | 16/16 | 145 | 5.036 (2.007–12.638) | 0.001 | 4.303 (1.625–11.399) | 0.003 |
| iv | High expression | Yes | 23/36 | 603 | 0.411 (0.180–0.940) | 0.035 | 0.357 (0.148–0.859) | 0.021 |
Notes:
Adjusted for histologic grade, radiation therapy, radical resection, and targeted molecular therapy.
Radiation therapy information is unavailable in 12 patients;
radical resection information is unavailable in two patients.
Targeted molecular therapy information is unavailable in 10 patients.
Abbreviations: HR, hazard ratio; MST, median survival time; OS, overall survival; PDAC, pancreatic ductal adenocarcinoma.
GSEA investigation for MCM4 in PDAC OS
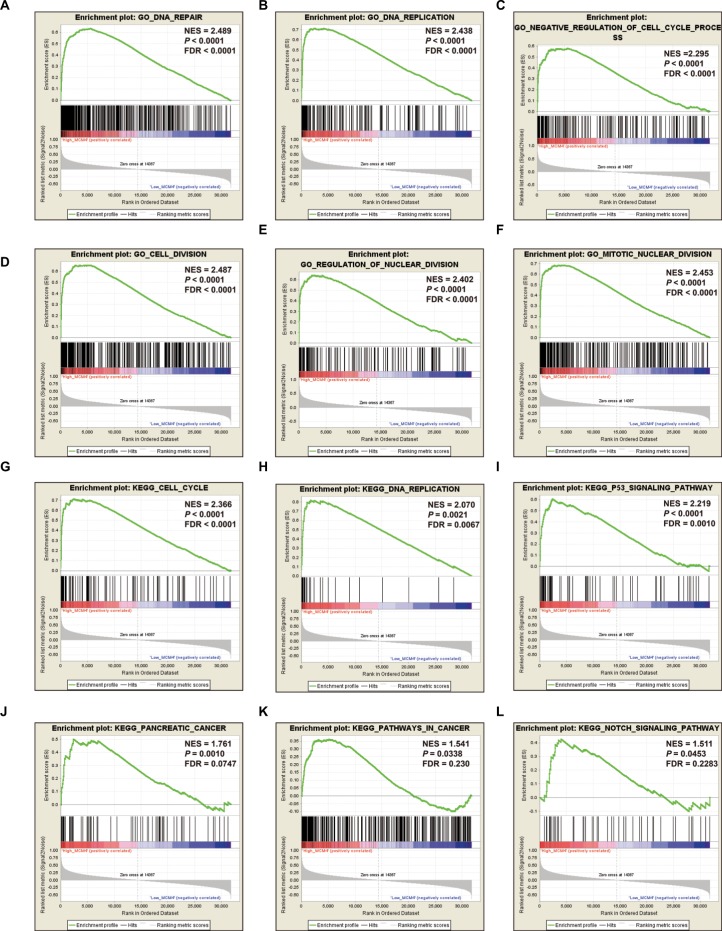
To further explore the potential mechanism of MCM4 in PDAC OS, we also developed a single-gene GSEA to investigate the potential biologic processes and pathways between different MCM4 expression levels. Enrichment of c5 suggests that high expression of MCM4 may be involved in DNA repair, DNA replication, cell cycle, and cell and nuclear division biologic processes (Figure 10A–F, Table S1), whereas enrichment of c2 indicates that high expression of MCM4 may participate in the cell cycle, DNA replication, tumor protein p53 (TP53), PC, and Notch signaling pathways, as well as pathways in cancer (Figure 10G–L; Table S2).
Figure 10.
GSEA results of MCM4 in PDAC patients.
Notes: (A–F) GSEA results of c2 reference gene sets for high MCM4 expression groups; (G–L) GSEA results of c5 reference gene sets for high MCM4 expression groups.
Abbreviations: ES, enrichment score; FDR, false discovery rate; GSEA, gene set enrichment analysis; MCM, minichromosome maintenance; NES, normalized enrichment score; PDAC, pancreatic ductal adenocarcinoma.
Discussion
The replication of DNA is a fundamental step in the cell cycle, and the MCM protein family in this process has been investigated extensively in numerous studies over the past decade.31–35 The MCM2–7 complex provides essential replicative helicase function in late mitosis and early G1 in the cell cycle.35–37 The functions of MCM2–7 are involved in the basic biologic processes of cell cycle maintenance in cells; therefore, dysregulation of the MCM protein family may cause cancer or developmental defects.38–41 MCM genes may be potential diagnostic and prognostic biomarkers for cancers, and promising targets for anticancer drug development and targeted therapy.42
Extensive studies have shown that the dysregulation of MCM2–7 can be observed in various cancers and may have a diagnostic value. Work by Saydam et al demonstrated that expression of MCM2–7 mRNAs was markedly increased in meningiomas tumor tissue.43 A prospective cohort study from India suggests that MCM (MCM2 and MCM5) immunocytochemistry may have considerable advantages for first-line cervical screening in developing countries.44 Immunohistochemical detection of MCM2 in the urine of bladder cancer (BC) patients and in the stools of colorectal cancer (CRC) patients could serve as a novel method for the diagnosis of these cancers.45,46 A study by Wang et al observed that mRNA expression of MCM2 in colon adenocarcinoma (COAD) was significantly increased in adenomas, as well as upregulation in adenomas with high-grade dysplasia, or in older patients, and demonstrates an application value in the early diagnosis of COAD.47 Immunohistochemical detection of MCM5 in human secretions also has a diagnostic value for cancers of the corresponding organs, such as urine sediments for prostate cancer,13 gastric aspirates for esophageal cancer,14 and bile aspirates or biliary brush cytology for pancreaticobiliary malignancy.48,49 Moreover, the levels of MCM6 mRNA and protein in the plasma are also markedly increased, and significantly associated with tumor stage progression and lymph node metastasis in hepatocellular carcinoma (HCC).50 Similar to previous studies, by using the GEPIA online analysis tool, we observed that MCM2–7 were upregulated in the majority of human tumor tissues, as well as in PC tumor tissue. However, due to the limitation that we cannot obtain normal pancreas tissue expression data from GEPIA, we could not assess the diagnostic values of MCM2–7 in PC.
In addition, extensive investigations indicate that MCM genes may serve as proliferation markers in various cancers. Immunohistochemical analysis of MCM3 might be useful as a proliferation marker in oral squamous cell carcinoma (OSCC),51 papillary thyroid carcinoma,52 and salivary gland tumors.53 The potential application of MCM5 in identifying cell proliferation can be found in Merkel cell carcinoma54 and malignant skin diseases.55 Similar studies of MCM7 also have been reported in gastric cancer (GC),56 esophageal lesions,57 reactive mesothelial cells, and malignant cells.58,59 Because of the close relationship between MCM gene and cell proliferation, MCM genes are also found to be associated with tumor progression. Overexpression of MCM7 was significantly associated with prostate cancer progression, relapse, local invasion, and a worse tumor grade,60 as well as in OSCC development and metastasis.61 Work by Das et al observed that MCM4, MCM5, MCM6, and MCM10 were significantly overexpressed in cervical cancer tumor tissues, and upregulated in advanced tumor stages, which indicates that these genes were significantly associated with cervical cancer carcinogenesis and progression.62 Moreover, there was a significantly positive association between the expression of MCM2 and histopathologic grade, and the expression was markedly upregulated in poorly differentiated HCC tissues, which may serve as a biomarker for HCC progression.63
The prognostic values of MCM2–7 have also been identified in multiple types of cancer.64–66 Due to the upregulation of MCM2–7 in multiple types of cancer, we speculate that they might play an oncogene role in cancer prognosis, and high expression of MCM genes may promote a poor survival. The following series of evidence from a review of the literature will support our inference. Work by Kang et al also demonstrated that knockdown of MCM7 in GC cells may suppress its oncogenic function.65 Immunohistochemical detection of MCM2 can be used as a biomarker for clinical outcome prediction, and high expression of MCM2 was associated with a significantly increased risk of death in patients with muscle-invasive urothelial cancer,66 nonbenign epithelial ovarian tumors,67 non-small-cell lung cancer (NSCLC),12,68 and GC,69–71 or recurrence in patients with BC72 and GC.71 Similar results could also be observed with MCM5, MCM6, and MCM7. High expression of MCM5 was associated with a significantly increased risk of death in patients with NSCLC73 and cervical cancer,74 and patients with high expression of MCM6 also have poor OS and increased risk of death in NSCLC,75 low-grade chondrosarcoma,76 mantle cell lymphoma,77 and endometrioid endometrial adenocarcinoma.78 The application value of MCM7 in the prognosis of cancer has been widely investigated. Previous studies have substantiated that MCM7 expression can serve as an independent prognostic factor for human CRC,79 HCC,80 lung cancer,81,82 Hodgkin’s lymphoma,83 OSCC,84 and esophageal squamous cell carcinoma,85 and promotes a poor prognosis. In addition, MCM7 also plays a crucial role in monitoring recurrence or progression-free survival, and evidence from previous studies suggests that MCM7 can be used as a biomarker for recurrence of CRC,86 meningiomas,87 and GC,65 as well as progression-free survival of non-muscle-invasive BC,88 pituitary adenoma,89 and ovarian cancer.90 A previous study by Peng et al reported that MCM genes were significantly overexpressed in PC tumor tissue and correlated to PC progression and prognosis, which is based on PC patients from TCGA.91 However, the study by Peng et al did not consider the influence of different operation methods and histologic subtypes for PC prognosis. The advantage of this current study was to take into full consideration the effect of operation method and histologic subtypes in PC prognosis, and only included patients with PDAC histologic subtype and underwent pancreaticoduodenectomy; therefore, the results obtained from our study may be more reliable. In addition, we also developed a comprehensive survival analysis for MCM4 and constructed a nomogram base on the clinical parameters and MCM4 mRNA expression levels, indicating that MCM4 may be an independent prognostic indicator for PDAC OS prediction after pancreaticoduodenectomy.
The exploration of a potential mechanism by GSEA revealed that MCM4 may take part in the biologic processes and pathways of DNA replication, cell cycle, TP53, and Notch signaling, which may affect PDAC prognosis. By reviewing the literature, we also found that a number of previous studies supported our results and substantiated that MCM4 played a crucial role in the cell cycle,92,93 DNA replication,94,95 DNA repair,96 and TP53 signaling pathway97; these biologic processes and pathways have already demonstrated a role in cancer prognosis.
As all the data in the present study come from public databases, there are several limitations that need to be recognized. First, the clinical information from TCGA database was not comprehensive, and the results of survival analysis still need to be verified. Second, due to strict inclusion and exclusion criteria, the sample size in our study was relatively small; therefore, an additional large verification cohort to validate our results is necessary. Third, due to a relatively small sample size, and because most of the patients died within 3 years, we cannot assess the survival prediction accurately for more than 3 years. Fourth, because adjacent normal tissues of PDAC were rare, we cannot perform an ROC analysis to assess the diagnostic value of MCM2–7 in PDAC.
Despite these limitations, in the present study we have identified the prognostic application of MCM4 mRNA expression in patients with PDAC, and also investigated the potential mechanism of different MCM4 expression levels in PDAC prognosis through a GSEA approach. Once these results are confirmed, MCM4 may have potential in the clinical application of prognostic monitoring, cancer management, and targeted therapy of PDAC.
Conclusions
Through a comprehensive analysis of MCM genes, we observed that MCM2–7 were upregulated in PC tumor tissues, and mRNA expression of MCM4 may serve as an independent prognostic indicator for PDAC prognosis prediction. The potential mechanism of MCM4 in PDAC OS, which was investigated by GSEA, indicated that MCM4 may play a role in PDAC prognosis through participating in the biologic processes and pathways of DNA replication, cell cycle, TP53, and Notch signaling. However, these results still need further verification and investigation.
Acknowledgments
This work was supported in part by the National Nature Science Foundation of China (Nos.: 81560535, 81072321, 30760243, 30460143, and 30560133), 2009 Program for New Century Excellent Talents in University (NCET), Guangxi Nature Sciences Foundation (No.: GuiKeGong 1104003A-7), and Guangxi Health Ministry Medicine Grant (Key-Scientific Research-Grant Z201018). The present study is also partly supported by Scientific Research Fund of the Health and Family Planning Commission of Guangxi Zhuang Autonomous Region (Z2016318) and The Basic Ability Improvement Project for Middle-aged and Young Teachers in Colleges and Universities in Guangxi (2018KY0110). The present study is also partly supported by Research Institute of Innovative Think-tank in Guangxi Medical University (The gene–environment interaction in hepatocarcinogenesis in Guangxi HCCs and its translational applications in the HCC prevention). We would also acknowledge the support by the National Key Clinical Specialty Programs (General Surgery and Oncology) and the Key Laboratory of Early Prevention & Treatment for Regional High-Incidence-Tumor (Guangxi Medical University), Ministry of Education, China. The authors thank the contributors of TCGA (https://cancergenome.nih.gov/) and UCSC Xena (http://xena.ucsc.edu/) for sharing the PDAC data on open access. In addition, we would like to acknowledge the helpful comments on this article received from our reviewers.
Footnotes
Disclosure
The authors report no conflicts of interest in this work.
References
- 1.Wolfgang CL, Herman JM, Laheru DA, Klein AP, Erdek MA, Fishman EK, Hruban RH. Recent progress in pancreatic cancer. CA Cancer J Clin. 2013;63(5):318–348. doi: 10.3322/caac.21190. [DOI] [PMC free article] [PubMed] [Google Scholar]
- 2.Fogel EL, Shahda S, Sandrasegaran K, et al. A multidisciplinary approach to pancreas cancer in 2016: a review. Am J Gastroenterol. 2017;112(4):537–554. doi: 10.1038/ajg.2016.610. [DOI] [PMC free article] [PubMed] [Google Scholar]
- 3.Vincent A, Herman J, Schulick R, Hruban RH, Goggins M. Pancreatic cancer. Lancet. 2011;378(9791):607–620. doi: 10.1016/S0140-6736(10)62307-0. [DOI] [PMC free article] [PubMed] [Google Scholar]
- 4.Torre LA, Bray F, Siegel RL, Ferlay J, Lortet-Tieulent J, Jemal A. Global cancer statistics, 2012. CA Cancer J Clin. 2015;65(2):87–108. doi: 10.3322/caac.21262. [DOI] [PubMed] [Google Scholar]
- 5.Chen W, Zheng R, Baade PD, et al. Cancer statistics in China, 2015. CA Cancer J Clin. 2016;66(2):115–132. doi: 10.3322/caac.21338. [DOI] [PubMed] [Google Scholar]
- 6.Chen W, Sun K, Zheng R, et al. Cancer incidence and mortality in China, 2014. Chin J Cancer Res. 2018;30(1):1–12. doi: 10.21147/j.issn.1000-9604.2018.01.01. [DOI] [PMC free article] [PubMed] [Google Scholar]
- 7.Kanda M, Matthaei H, Wu J, et al. Presence of somatic mutations in most early-stage pancreatic intraepithelial neoplasia. Gastroenterology. 2012;142733(4):730–733.e9. doi: 10.1053/j.gastro.2011.12.042. [DOI] [PMC free article] [PubMed] [Google Scholar]
- 8.Maitra A, Adsay NV, Argani P, et al. Multicomponent analysis of the pancreatic adenocarcinoma progression model using a pancreatic intraepithelial neoplasia tissue microarray. Mod Pathol. 2003;16(9):902–912. doi: 10.1097/01.MP.0000086072.56290.FB. [DOI] [PubMed] [Google Scholar]
- 9.Seufferlein T, Bachet JB, van Cutsem E, Rougier P, on behalf of the ESMO Guidelines Working Group, Group EGW Pancreatic adenocarcinoma: ESMO-ESDO Clinical Practice Guidelines for diagnosis, treatment and follow-up. Ann Oncol. 2012;23(Suppl 7):vii33–vii40. doi: 10.1093/annonc/mds224. [DOI] [PubMed] [Google Scholar]
- 10.Siegel R, Ma J, Zou Z, Jemal A. Cancer statistics, 2014. CA Cancer J Clin. 2014;64(1):9–29. doi: 10.3322/caac.21208. [DOI] [PubMed] [Google Scholar]
- 11.Gonzalez MA, Pinder SE, Callagy G, et al. Minichromosome maintenance protein 2 is a strong independent prognostic marker in breast cancer. J Clin Oncol. 2003;21(23):4306–4313. doi: 10.1200/JCO.2003.04.121. [DOI] [PubMed] [Google Scholar]
- 12.Ramnath N, Hernandez FJ, Tan D-F, et al. MCM2 is an independent predictor of survival in patients with non–small-cell lung cancer. J Clin Oncol. 2001;19(22):4259–4266. doi: 10.1200/JCO.2001.19.22.4259. [DOI] [PubMed] [Google Scholar]
- 13.Dudderidge TJ, Kelly JD, Wollenschlaeger A, et al. Diagnosis of prostate cancer by detection of minichromosome maintenance 5 protein in urine sediments. Br J Cancer. 2010;103(5):701–707. doi: 10.1038/sj.bjc.6605785. [DOI] [PMC free article] [PubMed] [Google Scholar]
- 14.Williams GH, Swinn R, Prevost AT, et al. Diagnosis of oesophageal cancer by detection of minichromosome maintenance 5 protein in gastric aspirates. Br J Cancer. 2004;91(4):714–719. doi: 10.1038/sj.bjc.6602028. [DOI] [PMC free article] [PubMed] [Google Scholar]
- 15.Consortium GT The genotype-tissue expression (GTEx) project. Nat Genet. 2013;45(6):580–585. doi: 10.1038/ng.2653. [DOI] [PMC free article] [PubMed] [Google Scholar]
- 16.Ferreira PG, Muñoz-Aguirre M, Reverter F, et al. The effects of death and post-mortem cold ischemia on human tissue transcriptomes. Nat Commun. 2018;9(1):490. doi: 10.1038/s41467-017-02772-x. [DOI] [PMC free article] [PubMed] [Google Scholar]
- 17.GTEx Consortium Human genomics. The Genotype-Tissue Expression (GTEx) pilot analysis: multitissue gene regulation in humans. Science. 2015;348(6235):648–660. doi: 10.1126/science.1262110. [DOI] [PMC free article] [PubMed] [Google Scholar]
- 18.Tang Z, Li C, Kang B, Gao G, Li C, Zhang Z. GEPIA: a web server for cancer and normal gene expression profiling and interactive analyses. Nucleic Acids Res. 2017;45(W1):W98–W102. doi: 10.1093/nar/gkx247. [DOI] [PMC free article] [PubMed] [Google Scholar]
- 19.Shaul YD, Yuan B, Thiru P, et al. MERAV: a tool for comparing gene expression across human tissues and cell types. Nucleic Acids Res. 2016;44(D1):D560–D566. doi: 10.1093/nar/gkv1337. [DOI] [PMC free article] [PubMed] [Google Scholar]
- 20.Cancer Genome Atlas Research Network Genomic Characterization of Pancreatic Ductal Adenocarcinoma. Cancer Cell. 2017;32(2):185–203. doi: 10.1016/j.ccell.2017.07.007. [DOI] [PMC free article] [PubMed] [Google Scholar]
- 21.Anders S, Huber W. Differential expression analysis for sequence count data. Genome Biol. 2010;11(10):R106. doi: 10.1186/gb-2010-11-10-r106. [DOI] [PMC free article] [PubMed] [Google Scholar]
- 22.Liao X, Huang K, Huang R, et al. Genome-scale analysis to identify prognostic markers in patients with early-stage pancreatic ductal adenocarcinoma after pancreaticoduodenectomy. Onco Targets Ther. 2017;10:4493–4506. doi: 10.2147/OTT.S142557. [DOI] [PMC free article] [PubMed] [Google Scholar]
- 23.Subramanian A, Tamayo P, Mootha VK, et al. Gene set enrichment analysis: a knowledge-based approach for interpreting genome-wide expression profiles. Proc Natl Acad Sci U S A. 2005;102(43):15545–15550. doi: 10.1073/pnas.0506580102. [DOI] [PMC free article] [PubMed] [Google Scholar]
- 24.Mootha VK, Lindgren CM, Eriksson K-F, et al. PGC-1α-responsive genes involved in oxidative phosphorylation are coordinately down-regulated in human diabetes. Nat Genet. 2003;34(3):267–273. doi: 10.1038/ng1180. [DOI] [PubMed] [Google Scholar]
- 25.Liberzon A, Birger C, Thorvaldsdóttir H, Ghandi M, Mesirov JP, Tamayo P. The Molecular Signatures Database hallmark gene set collection. Cell Syst. 2015;1(6):417–425. doi: 10.1016/j.cels.2015.12.004. [DOI] [PMC free article] [PubMed] [Google Scholar]
- 26.Benjamini Y, Hochberg Y. Controlling the false discovery rate: a practical and powerful approach to multiple testing. J Royal Stat Soc. 1995;57(1):289–300. [Google Scholar]
- 27.Reiner A, Yekutieli D, Benjamini Y. Identifying differentially expressed genes using false discovery rate controlling procedures. Bioinformatics. 2003;19(3):368–375. doi: 10.1093/bioinformatics/btf877. [DOI] [PubMed] [Google Scholar]
- 28.Benjamini Y, Drai D, Elmer G, Kafkafi N, Golani I. Controlling the false discovery rate in behavior genetics research. Behav Brain Res. 2001;125(1–2):279–284. doi: 10.1016/s0166-4328(01)00297-2. [DOI] [PubMed] [Google Scholar]
- 29.Mostafavi S, Ray D, Warde-Farley D, Grouios C, Morris Q. GeneMA-NIA: a real-time multiple association network integration algorithm for predicting gene function. Genome Biol. 2008;9(Suppl 1):S4. doi: 10.1186/gb-2008-9-s1-s4. [DOI] [PMC free article] [PubMed] [Google Scholar]
- 30.Mering Cv, von Mering C, Huynen M, Jaeggi D, Schmidt S, Bork P, Snel B. STRING: a database of predicted functional associations between proteins. Nucleic Acids Res. 2003;31(1):258–261. doi: 10.1093/nar/gkg034. [DOI] [PMC free article] [PubMed] [Google Scholar]
- 31.Kunnev D, Freeland A, Qin M, Leach RW, Wang J, Shenoy RM, Pruitt SC. Effect of minichromosome maintenance protein 2 deficiency on the locations of DNA replication origins. Genome Res. 2015;25(4):558–569. doi: 10.1101/gr.176099.114. [DOI] [PMC free article] [PubMed] [Google Scholar]
- 32.Chong JPJ, Thömmes P, Blow JJ. The role of MCM/P1 proteins in the licensing of DNA replication. Trends Biochem Sci. 1996;21(3):102–106. [PubMed] [Google Scholar]
- 33.Su TT, Follette PJ, O’Farrell PH. Qualifying for the license to replicate. Cell. 1995;81(6):825–828. doi: 10.1016/0092-8674(95)90000-4. [DOI] [PMC free article] [PubMed] [Google Scholar]
- 34.Stillman B. Cell cycle control of DNA replication. Science. 1996;274(5293):1659–1663. doi: 10.1126/science.274.5293.1659. [DOI] [PubMed] [Google Scholar]
- 35.Kearsey SE, Labib K. MCM proteins: evolution, properties, and role in DNA replication. Biochim Biophys Acta. 1998;1398(2):113–136. doi: 10.1016/s0167-4781(98)00033-5. [DOI] [PubMed] [Google Scholar]
- 36.Woodward AM, Göhler T, Luciani MG, et al. Excess Mcm2–7 license dormant origins of replication that can be used under conditions of replicative stress. J Cell Biol. 2006;173(5):673–683. doi: 10.1083/jcb.200602108. [DOI] [PMC free article] [PubMed] [Google Scholar]
- 37.Blow JJ, Dutta A. Preventing re-replication of chromosomal DNA. Nat Rev Mol Cell Biol. 2005;6(6):476–486. doi: 10.1038/nrm1663. [DOI] [PMC free article] [PubMed] [Google Scholar]
- 38.Pruitt SC, Bailey KJ, Freeland A. Reduced Mcm2 expression results in severe stem/progenitor cell deficiency and cancer. Stem Cells. 2007;25(12):3121–3132. doi: 10.1634/stemcells.2007-0483. [DOI] [PubMed] [Google Scholar]
- 39.Chuang C-H, Wallace MD, Abratte C, Southard T, Schimenti JC. Incremental genetic perturbations to MCM2-7 expression and subcellular distribution reveal exquisite sensitivity of mice to DNA replication stress. PLoS Genet. 2010;6(9):e1001110. doi: 10.1371/journal.pgen.1001110. [DOI] [PMC free article] [PubMed] [Google Scholar]
- 40.Shima N, Alcaraz A, Liachko I, et al. A viable allele of Mcm4 causes chromosome instability and mammary adenocarcinomas in mice. Nat Genet. 2007;39(1):93–98. doi: 10.1038/ng1936. [DOI] [PubMed] [Google Scholar]
- 41.Watanabe E, Ohara R, Ishimi Y. Effect of an MCM4 mutation that causes tumours in mouse on human MCM4/6/7 complex formation. J Biochem. 2012;152(2):191–198. doi: 10.1093/jb/mvs060. [DOI] [PubMed] [Google Scholar]
- 42.Lei M. The MCM complex: its role in DNA replication and implications for cancer therapy. Curr Cancer Drug Targets. 2005;5(5):365–380. doi: 10.2174/1568009054629654. [DOI] [PubMed] [Google Scholar]
- 43.Saydam O, Senol O, Schaaij-Visser TBM, et al. Comparative protein profiling reveals minichromosome maintenance (MCM) proteins as novel potential tumor markers for meningiomas. J Proteome Res. 2010;9(1):485–494. doi: 10.1021/pr900834h. [DOI] [PMC free article] [PubMed] [Google Scholar]
- 44.Mukherjee G, Muralidhar B, Bafna UD, Laskey RA, Coleman N. MCM immunocytochemistry as a first line cervical screening test in developing countries: a prospective cohort study in a regional cancer centre in India. Br J Cancer. 2007;96(7):1107–1111. doi: 10.1038/sj.bjc.6603679. [DOI] [PMC free article] [PubMed] [Google Scholar]
- 45.Saeb-Parsy K, Wilson A, Scarpini C, et al. Diagnosis of bladder cancer by immunocytochemical detection of minichromosome maintenance protein-2 in cells retrieved from urine. Br J Cancer. 2012;107(8):1384–1391. doi: 10.1038/bjc.2012.381. [DOI] [PMC free article] [PubMed] [Google Scholar]
- 46.Davies RJ, Freeman A, Morris LS, et al. Analysis of minichromosome maintenance proteins as a novel method for detection of colorectal cancer in stool. Lancet. 2002;359(9321):1917–1919. doi: 10.1016/S0140-6736(02)08739-1. [DOI] [PubMed] [Google Scholar]
- 47.Wang Y, Li Y, Zhang WY, et al. mRNA expression of minichromosome maintenance 2 in colonic adenoma and adenocarcinoma. Eur J Cancer Prev. 2009;18(1):40–45. doi: 10.1097/CEJ.0b013e32830c8d5a. [DOI] [PubMed] [Google Scholar]
- 48.Ayaru L, Stoeber K, Webster GJ, et al. Diagnosis of pancreaticobiliary malignancy by detection of minichromosome maintenance protein 5 in bile aspirates. Br J Cancer. 2008;98(9):1548–1554. doi: 10.1038/sj.bjc.6604342. [DOI] [PMC free article] [PubMed] [Google Scholar]
- 49.Keane MG, Huggett MT, Chapman MH, et al. Diagnosis of pancreaticobiliary malignancy by detection of minichromosome maintenance protein 5 in biliary brush cytology. Br J Cancer. 2017;116(3):349–355. doi: 10.1038/bjc.2016.447. [DOI] [PMC free article] [PubMed] [Google Scholar]
- 50.Zheng T, Chen M, Han S, et al. Plasma minichromosome maintenance complex component 6 is a novel biomarker for hepatocellular carcinoma patients. Hepatology Res. 2014;44(13):1347–1356. doi: 10.1111/hepr.12303. [DOI] [PubMed] [Google Scholar]
- 51.Rezazadeh F, Ebrahimi R, Andisheh-Tadbir A, Ashraf MJ, Khademi B. Evaluation of the Ki-67 and MCM3 expression in cytologic smear of oral squamous cell carcinoma. J Dent. 2017;18(3):207–211. [PMC free article] [PubMed] [Google Scholar]
- 52.Lee YS, Ha S-A, Kim HJ, et al. Minichromosome maintenance protein 3 is a candidate proliferation marker in papillary thyroid carcinoma. Exp Mol Pathol. 2010;88(1):138–142. doi: 10.1016/j.yexmp.2009.09.015. [DOI] [PubMed] [Google Scholar]
- 53.Ashkavandi ZJ, Najvani AD, Tadbir AA, Pardis S, Ranjbar MA, Ashraf MJ. MCM3 as a novel diagnostic marker in benign and malignant salivary gland tumors. Asian Pac J Cancer Prev. 2013;14(6):3479–3482. doi: 10.7314/apjcp.2013.14.6.3479. [DOI] [PubMed] [Google Scholar]
- 54.Gambichler T, Breininger A, Rotterdam S, Altmeyer P, Stücker M, Kreuter A. Expression of minichromosome maintenance proteins in Merkel cell carcinoma. J Eur Acad Dermatol Venereol. 2009;23(10):1184–1188. doi: 10.1111/j.1468-3083.2009.03285.x. [DOI] [PubMed] [Google Scholar]
- 55.Liu H, Takeuchi S, Moroi Y, et al. Expression of minichromosome maintenance 5 protein in proliferative and malignant skin diseases. Int J Dermatol. 2007;46(11):1171–1176. doi: 10.1111/j.1365-4632.2007.03335.x. [DOI] [PubMed] [Google Scholar]
- 56.Yang JY, Li D, Zhang Y, Guan BX, Gao P, Zhou XC, Zhou CJ. The expression of MCM7 is a useful biomarker in the early diagnostic of gastric cancer. Pathol Oncol Res. 2017;24(2):367–372. doi: 10.1007/s12253-017-0251-1. [DOI] [PubMed] [Google Scholar]
- 57.Choy B, Lalonde A, Que J, Wu T, Zhou Z. MCM4 and MCM7, potential novel proliferation markers, significantly correlated with Ki-67, Bmi1, and cyclin E expression in esophageal adenocarcinoma, squamous cell carcinoma, and precancerous lesions. Hum Pathol. 2016;57:126–135. doi: 10.1016/j.humpath.2016.07.013. [DOI] [PMC free article] [PubMed] [Google Scholar]
- 58.Kimura F, Okayasu I, Kakinuma H, Satoh Y, Kuwao S, Saegusa M, Watanabe J. Differential diagnosis of reactive mesothelial cells and malignant mesothelioma cells using the cell proliferation markers minichromosome maintenance protein 7, geminin, topoisomerase II alpha and Ki-67. Acta Cytol. 2013;57(4):384–390. doi: 10.1159/000350262. [DOI] [PubMed] [Google Scholar]
- 59.Kimura F, Kawamura J, Watanabe J, Kamoshida S, Kawai K, Okayasu I, Kuwao S. Significance of cell proliferation markers (minichromosome maintenance protein 7, topoisomerase IIalpha and Ki-67) in cavital fluid cytology: can we differentiate reactive mesothelial cells from malignant cells? Diagn Cytopathol. 2010;38(3):161–167. doi: 10.1002/dc.21190. [DOI] [PubMed] [Google Scholar]
- 60.Ren B, Yu G, Tseng GC, et al. MCM7 amplification and overexpression are associated with prostate cancer progression. Oncogene. 2006;25(7):1090–1098. doi: 10.1038/sj.onc.1209134. [DOI] [PubMed] [Google Scholar]
- 61.Feng CJ, Hj L, Jn L, Yj L, Liao GQ. Expression of Mcm7 and Cdc6 in oral squamous cell carcinoma and precancerous lesions. Anticancer Res. 2008;28(6A):3763–3769. [PubMed] [Google Scholar]
- 62.Das M, Prasad SB, Yadav SS, et al. Over expression of minichromosome maintenance genes is clinically correlated to cervical carcinogenesis. PLoS One. 2013;8(7):e69607. doi: 10.1371/journal.pone.0069607. [DOI] [PMC free article] [PubMed] [Google Scholar]
- 63.Sun M, Wu G, Li Y, et al. Expression profile reveals novel prognostic biomarkers in hepatocellular carcinoma. Front Biosci. 2010;2:829–840. doi: 10.2741/e144. [DOI] [PubMed] [Google Scholar]
- 64.Zhong H, Chen B, Neves H, et al. Expression of minichromosome maintenance genes in renal cell carcinoma. Cancer Manag Res. 2017;9:637–647. doi: 10.2147/CMAR.S146528. [DOI] [PMC free article] [PubMed] [Google Scholar]
- 65.Kang W, Tong JH, Chan AW, Cheng AS, Yu J, To K. MCM7 serves as a prognostic marker in diffuse-type gastric adenocarcinoma and siRNA-mediated knockdown suppresses its oncogenic function. Oncol Rep. 2014;31(5):2071–2078. doi: 10.3892/or.2014.3094. [DOI] [PubMed] [Google Scholar]
- 66.Korkolopoulou P, Givalos N, Saetta A, et al. Minichromosome maintenance proteins 2 and 5 expression in muscle-invasive urothelial cancer: a multivariate survival study including proliferation markers and cell cycle regulators. Hum Pathol. 2005;36(8):899–907. doi: 10.1016/j.humpath.2005.06.008. [DOI] [PubMed] [Google Scholar]
- 67.Gakiopoulou H, Korkolopoulou P, Levidou G, et al. Minichromosome maintenance proteins 2 and 5 in non-benign epithelial ovarian tumours: relationship with cell cycle regulators and prognostic implications. Br J Cancer. 2007;97(8):1124–1134. doi: 10.1038/sj.bjc.6603992. [DOI] [PMC free article] [PubMed] [Google Scholar]
- 68.Yang J, Ramnath N, Moysich KB, et al. Prognostic significance of MCM2, Ki-67 and gelsolin in non-small cell lung cancer. BMC Cancer. 2006;6(1):203. doi: 10.1186/1471-2407-6-203. [DOI] [PMC free article] [PubMed] [Google Scholar]
- 69.Yang C, Wen Y, Li H, et al. Overexpression of minichromosome maintenance 2 predicts poor prognosis in patients with gastric cancer. Oncol Rep. 2012;27(1):135–142. doi: 10.3892/or.2011.1473. [DOI] [PubMed] [Google Scholar]
- 70.Czyzewska J, Guziαska-Ustymowicz K, Pryczynicz A, Kemona A, Bandurski R. Immunohistochemical evaluation of Ki-67, PCNA and MCM2 proteins proliferation index (PI) in advanced gastric cancer. Folia Histochem Cytobiol. 2009;47(2):289–296. doi: 10.2478/v10042-009-0042-y. [DOI] [PubMed] [Google Scholar]
- 71.Liu M, Js L, Tian DP, Huang B, Rosqvist S, Su M. MCM2 expression levels predict diagnosis and prognosis in gastric cardiac cancer. Histol Histopathol. 2013;28(4):481–492. doi: 10.14670/HH-28.481. [DOI] [PubMed] [Google Scholar]
- 72.Burger M, Denzinger S, Hartmann A, Wieland W-F, Stoehr R, Obermann EC. Mcm2 predicts recurrence hazard in stage Ta/T1 bladder cancer more accurately than CK20, Ki67 and histological grade. Br J Cancer. 2007;96(11):1711–1715. doi: 10.1038/sj.bjc.6603784. [DOI] [PMC free article] [PubMed] [Google Scholar]
- 73.Liu Y-Z, Wang B-S, Jiang Y-Y, et al. MCMs expression in lung cancer: implication of prognostic significance. J Cancer. 2017;8(18):3641–3647. doi: 10.7150/jca.20777. [DOI] [PMC free article] [PubMed] [Google Scholar]
- 74.Wang D, Li Q, Li Y, Wang H. The role of MCM5 expression in cervical cancer: correlation with progression and prognosis. Biomed Pharmacother. 2018;98:165–172. doi: 10.1016/j.biopha.2017.12.006. [DOI] [PubMed] [Google Scholar]
- 75.Vigouroux C, Casse J-M, Battaglia-Hsu S-F, et al. Methyl(R217)HuR and MCM6 are inversely correlated and are prognostic markers in non small cell lung carcinoma. Lung Cancer. 2015;89(2):189–196. doi: 10.1016/j.lungcan.2015.05.008. [DOI] [PubMed] [Google Scholar]
- 76.Helfenstein A, Frahm SO, Krams M, Drescher W, Parwaresch R, Hassenpflug J. Minichromosome maintenance protein (MCM6) in low-grade chondrosarcoma: distinction from enchondroma and identification of progressive tumors. Am J Clin Pathol. 2004;122(6):912–918. doi: 10.1309/G638-TKNN-G2CJ-UXWL. [DOI] [PubMed] [Google Scholar]
- 77.Schrader C, Janssen D, Klapper W, et al. Minichromosome maintenance protein 6, a proliferation marker superior to Ki-67 and independent predictor of survival in patients with mantle cell lymphoma. Br J Cancer. 2005;93(8):939–945. doi: 10.1038/sj.bjc.6602795. [DOI] [PMC free article] [PubMed] [Google Scholar]
- 78.Hotton J, Agopiantz M, Leroux A, et al. Minichromosome maintenance complex component 6 (MCM6) expression correlates with histological grade and survival in endometrioid endometrial adenocarcinoma. Virchows Arch. 2018;472(4):623–633. doi: 10.1007/s00428-017-2278-9. [DOI] [PubMed] [Google Scholar]
- 79.Nishihara K, Shomori K, Fujioka S, et al. Minichromosome maintenance protein 7 in colorectal cancer: implication of prognostic significance. Int J Oncol. 2008;33(2):245–251. [PubMed] [Google Scholar]
- 80.Zhou Y-M, Zhang X-F, Cao L, Li B, Sui CJ, Li YM, Yin ZF. MCM7 expression predicts post-operative prognosis for hepatocellular carcinoma. Liver Int. 2012;32(10):1505–1509. doi: 10.1111/j.1478-3231.2012.02846.x. [DOI] [PubMed] [Google Scholar]
- 81.Toyokawa G, Masuda K, Daigo Y, et al. Minichromosome maintenance protein 7 is a potential therapeutic target in human cancer and a novel prognostic marker of non-small cell lung cancer. Mol Cancer. 2011;10(1):65. doi: 10.1186/1476-4598-10-65. [DOI] [PMC free article] [PubMed] [Google Scholar]
- 82.Fujioka S, Shomori K, Nishihara K, et al. Expression of minichromosome maintenance 7 (MCM7) in small lung adenocarcinomas (pT1): prognostic implication. Lung Cancer. 2009;65(2):223–229. doi: 10.1016/j.lungcan.2008.11.007. [DOI] [PubMed] [Google Scholar]
- 83.Marnerides A, Vassilakopoulos TP, Boltetsou E, et al. Immunohistochemical expression and prognostic significance of CCND3, MCM2 and MCM7 in Hodgkin lymphoma. Anticancer Res. 2011;31(10):3585–3594. [PubMed] [Google Scholar]
- 84.Tamura T, Shomori K, Haruki T, et al. Minichromosome maintenance-7 and geminin are reliable prognostic markers in patients with oral squamous cell carcinoma: immunohistochemical study. J Oral Pathol Med. 2010;39(4):328–334. doi: 10.1111/j.1600-0714.2009.00861.x. [DOI] [PubMed] [Google Scholar]
- 85.Zhong X, Chen X, Guan X, et al. Overexpression of G9a and MCM7 in oesophageal squamous cell carcinoma is associated with poor prognosis. Histopathology. 2015;66(2):192–200. doi: 10.1111/his.12456. [DOI] [PubMed] [Google Scholar]
- 86.Ishibashi Y, Kinugasa T, Akagi Y, et al. Minichromosome maintenance protein 7 is a risk factor for recurrence in patients with Dukes C colorectal cancer. Anticancer Res. 2014;34(8):4569–4575. [PubMed] [Google Scholar]
- 87.Winther TL, Torp SH. MCM7 expression is a promising predictor of recurrence in patients surgically resected for meningiomas. J Neurooncol. 2017;131(3):575–583. doi: 10.1007/s11060-016-2329-0. [DOI] [PubMed] [Google Scholar]
- 88.Fristrup N, Birkenkamp-Demtröder K, Reinert T, et al. Multicenter validation of Cyclin D1, MCM7, TRIM29, and UBE2C as prognostic protein markers in non-muscle–invasive bladder cancer. Am J Pathol. 2013;182(2):339–349. doi: 10.1016/j.ajpath.2012.10.017. [DOI] [PubMed] [Google Scholar]
- 89.Coli A, Asa SL, Fadda G, et al. Minichromosome maintenance protein 7 as prognostic marker of tumor aggressiveness in pituitary adenoma patients. Eur J Endocrinol. 2016;174(3):307–314. doi: 10.1530/EJE-15-0586. [DOI] [PubMed] [Google Scholar]
- 90.Ota T, Clayton AC, Minot DM, Shridhar V, Hartmann LC, Gilks CB, Chien JR. Minichromosome maintenance protein 7 as a potential prognostic factor for progression-free survival in high-grade serous carcinomas of the ovary. Mod Pathol. 2011;24(2):277–287. doi: 10.1038/modpathol.2010.202. [DOI] [PMC free article] [PubMed] [Google Scholar]
- 91.Peng Y-P, Zhu Y, Yin L-D, et al. The expression and prognostic roles of MCMs in pancreatic cancer. PLoS One. 2016;11(10):e0164150. doi: 10.1371/journal.pone.0164150. [DOI] [PMC free article] [PubMed] [Google Scholar]
- 92.Komamura-Kohno Y, Karasawa-Shimizu K, Saitoh T, Sato M, Hanaoka F, Tanaka S, Ishimi Y. Site-specific phosphorylation of MCM4 during the cell cycle in mammalian cells. FEBS J. 2006;273(6):1224–1239. doi: 10.1111/j.1742-4658.2006.05146.x. [DOI] [PubMed] [Google Scholar]
- 93.Fujita M, Yamada C, Tsurumi T, Hanaoka F, Matsuzawa K, Inagaki M. Cell cycle- and chromatin binding state-dependent phosphorylation of human MCM heterohexameric complexes. A role for cdc2 kinase. J Biol Chem. 1998;273(27):17095–17101. doi: 10.1074/jbc.273.27.17095. [DOI] [PubMed] [Google Scholar]
- 94.Ishimi Y, Komamura-Kohno Y, Karasawa-Shimizu K, Yamada K. Levels of MCM4 phosphorylation and DNA synthesis in DNA replication block checkpoint control. J Struct Biol. 2004;146(1–2):234–241. doi: 10.1016/j.jsb.2003.11.027. [DOI] [PubMed] [Google Scholar]
- 95.Ishimi Y, Komamura-Kohno Y, Kwon H-J, Yamada K, Nakanishi M. Identification of MCM4 as a target of the DNA replication block checkpoint system. J Biol Chem. 2003;278(27):24644–24650. doi: 10.1074/jbc.M213252200. [DOI] [PubMed] [Google Scholar]
- 96.Casey JP, Nobbs M, Mcgettigan P, Lynch S, Ennis S. Recessive mutations in MCM4 / PRKDC cause a novel syndrome involving a primary immunodeficiency and a disorder of DNA repair. J Med Genet. 2012;49(4):242–245. doi: 10.1136/jmedgenet-2012-100803. [DOI] [PubMed] [Google Scholar]
- 97.Yun HJ, Hyun SK, Park JH, Kim BW, Kwon HJ. Widdrol activates DNA damage checkpoint through the signaling Chk2–p53–Cdc25A–p21–MCM4 pathway in HT29 cells. Mol Cell Biochem. 2012;363(1–2):281–289. doi: 10.1007/s11010-011-1180-z. [DOI] [PubMed] [Google Scholar]


