Abstract
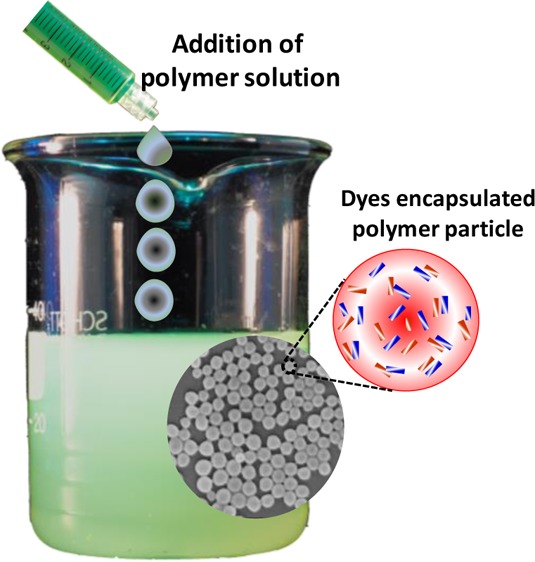
Polymer nanoparticles are used extensively in biomedical applications. Poly(methylmethacrylate) (PMMA) nanoparticles obtained via nanoprecipitation were unstable and flocculate or precipitate from solution within a few hours. A simple method to improve the stability of the particles using surfactants at low concentrations was carried out to produce PMMA nanoparticles with long-term stability in water (>6 months). The increased stability was attributed to the incorporation of surfactants inside the polymer particles during nanoprecipitation. The same methodology was also adopted to encapsulate a highly fluorescent hydrophobic perylene tetraester inside the polymer nanoparticles with good stability in water. Because of the presence of the anionic sodium dodecyl sulfate, the particles showed a negative zeta potential of −34.7 mV and an average size of 150 nm. Similarly, the dye-encapsulated polymer nanoparticles showed a zeta potential of −35.1 mV and an average particle size of 180 nm. By varying the concentration of encapsulated dyes inside the polymer nanoparticles, dye aggregation could be controlled, and the fluorescence profiles of the nanoparticles were altered. To understand the uptake and toxicity of the polymer nanoparticles, baby hamster kidney cells were chosen as a model system. The polymer nanoparticles were taken up by the cells within 3 h and were nontoxic at concentrations as high as 100 ppm. The confocal micrographs of the cells revealed localized fluorescence from the polymer nanoparticles around the nucleus in the cytoplasm without the penetration of the nuclear envelope.
Introduction
Nanoprecipitation is a simple and effective method for the preparation of polymer nanoparticles.1 On the basis of the structure of the polymer, good solvent/bad solvent mixtures such as tetrahydrofuran/water,2 dimethylformamide/water,3,4 dimethyl sulfoxide/water,5 and acetone/water6 were used for the preparation of polymer nanoparticles. Also, several commercially available polymers have been used for the precipitation of particles, mostly in the micrometer size range.2,6−10 The main drawbacks of such methods are poor colloidal stability, excessive use of organic solvent, and limited control on particle size.11 The amphiphilic block copolymers can undergo self-assembly during precipitation,10−12 which results in stable particle formation in solution. Such particles were used to encapsulate dyes,13−16 drugs,5,17−20 and nanomaterials.21,22
In the case of bioimaging, a few critical requirements such as water dispersability, low toxicity, and high chemical and photostability need to be incorporated into the particles.23−25 Dye-conjugated nanoparticles have been used for imaging applications, but require extensive synthetic modifications to improve water dispersability and stability.26,27 In contrast to having a photoactive polymer, several approaches were opted for the encapsulation of fluorescent small molecules inside a polymer particle. The most common polymer used for the encapsulation of drugs or other small molecules is poly(lactic-co-glycolide) (PLGA).28−30 The balance of hydrophilicity and hydrophobicity of the polymer backbone allows the encapsulation of a series of dye molecules such as bisdemethoxycurcumin,29 Nile red,30 NIR-BODIPY,26 and indocyanine green.14 The drawbacks of such approaches include multistep synthesis, difficulty in getting pure particles, scaling up issues, and being expensive to be adopted for a wide range of applications.
The focus of the current study is to establish a simple protocol for the synthesis of hydrophobic polymer nanoparticles that are stable in aqueous solution. In this study, poly(methylmethacrylate) (PMMA) was selected as the polymer matrix owing to the versatility in properties, low toxicity, optical transparency, and easy accessibility. A few parameters such as the volume of the poor solvent added, rate of stirring, rate of addition, temperature, and concentration of polymers were optimized. Also, the same procedure was used to prepare and stabilize the polymer nanoparticles encapsulated with the dye molecules.
Perylene tetrabutylester (PTE, Figure S1) was selected as the dye of choice owing to its easy access, high quantum yield, high solubility in organic solvents, and photostability. In solution, the perylene derivative exists in its molecular form (monomeric form). As the concentration increases, favorable π–π interactions between the perylene cores facilitate the formation of aggregates, which results in characteristic changes in the absorption and emission maxima. Owing to the favorable hydrophobic interactions between the polymer and PTE, we expect a homogeneous distribution with a bright fluorescence emission from the polymer nanoparticles.13,31
In particular, we attempted to answer the following questions, such as (i) Is it possible to make large amounts of stable PMMA nanoparticles incorporated with a perylene dye?, (ii) Do the optical properties of perylene dye change after incorporating inside the polymer nanoparticle?, and (iii) Do these particles enter and interact with the cellular medium and organelles of a human cell?
Results and Discussion
Optimization of Addition Method
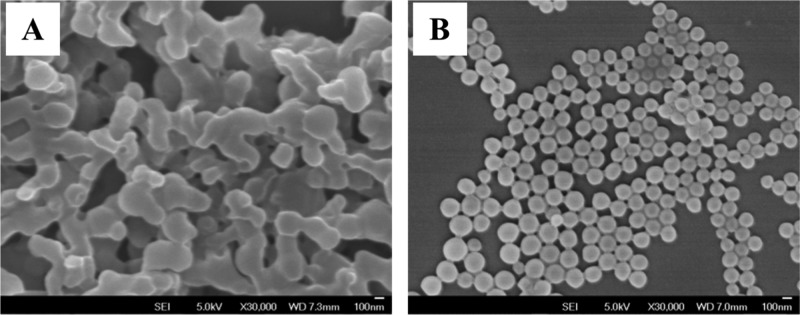
The slow addition of polymer solution into water leads to the formation of white flakes on the surface of water and a translucent solution. On the other hand, with the rapid addition of polymer solution in acetone to water, a homogeneous translucent solution was observed. The size and morphology of the polymer particles were analyzed using scanning electron microscopy (SEM). During the slow addition of polymer solution into water, interconnected polymer nanoparticles (Figure 1A) were observed. However, the rapid addition gave discrete particles (Figure 1B) with an average size of 115 ± 25 nm (SEM). From the dynamic light scattering (DLS) measurements, the hydrodynamic size of the polymer particles was observed to be ca. 180 nm with a zeta potential of −19.6 mV.
Figure 1.
SEM image of a polymer solution precipitated from water via slow addition (A) and fast addition (B); 30 000× magnification; scale bar is 100 nm.
The order of mixing of the two phases has an impact on particle shape and size distribution. The addition of water into the polymer solution led to a large particle size distribution. On the other hand, the rapid addition of polymer solution in acetone to a large amount of water gave nanoparticles with a narrow size distribution and well-defined shapes. Because of this observation, all experiments were carried out by rapidly pouring the organic polymer solution into the aqueous phase.
Stabilization of Particles in Solution
The precipitated PMMA nanoparticles showed aggregation upon storage at room temperature. To prevent the aggregation and precipitation of polymer particles, the surfactant sodium dodecylsulfate (SDS) was added during the synthesis. In preliminary trials, the SDS solution at critical micelle concentrations (CMC = 8 mM, 10 mL), which served as the aqueous phase, and the PMMA solution in acetone (4 mg/mL, 1 mL) were used. However, the high concentrations of the surfactant in water led to the formation of SDS crystals, which then warranted the optimization of SDS concentration (Table 1). In all experiments, SDS and PMMA were dissolved in acetone first, poured into excess of water, and then precipitated as nanoparticles. The dynamic light scattering graphs corresponding to the values reported in Table 1 are shown in Figure S2.
Table 1. Size Distribution of Particles Prepared Using Different Polymer-to-Surfactant Ratios.
| weight % surfactanta | Zaverage (nm) | PDI | zeta potential (mV) | conductivity (μS cm–1) |
|---|---|---|---|---|
| 16.12 | 196 ± 83 | 0.097 | –49.7 | 29.6 |
| 8.77 | 217 ± 78 | 0.108 | –41.7 | 31.7 |
| 3.70 | 191 ± 49 | 0.090 | –39.8 | 9.69 |
| 1.89 | 191 ± 45 | 0.095 | –30.0 | 6.23 |
| 0.95 | 159 ± 56 | 0.388 | –28.4 | 5.51 |
| 0.38 | 269 ± 45 | 0.100 | –27.3 | 5.52 |
| 0.19 | 226 ± 44 | 0.136 | –24.1 | 4.00 |
| 0.00 | 180 ± 29 | 0.414 | –19.6 | 2.74 |
PMMA used in the experiment was 20 mg.
The use of surfactants to stabilize nanoparticles is a common technique; however, our methodology reduces the amount of surfactant used significantly.32 From Table 1, it is evident that the average size of the polymer nanoparticles varied from 150 to 270 nm by changing the concentration of the surfactant. Pure PMMA nanoparticles without the surfactant showed a size of 180 nm and a zeta potential of −19.6 mV. The addition of an optimum concentration (1–2 wt %) of SDS led to the formation of stable particles with an increase in hydrodynamic size to 191 nm [polydispersity index (PDI) of 0.095], a large negative zeta potential of −30 mV, and a long-term stability in solution. The increase in the zeta potential of nanoparticles prevents the aggregation or flocculation of the nanoparticles through the electrostatic repulsive forces. The measurement of the conductivity of the nanoparticle dispersions showed that with less than 3 wt % of surfactant added, the conductivity remains constant below 10 μS cm–1, and a sharp increase in conductivity was observed with an increase in the SDS concentration. As we only added 2 wt % of SDS during the synthesis, the analysis of the supernatant solution showed no free SDS in solution.
Preparation of PTE-Encapsulated PMMA Nanoparticles
The photostable perylene-based dyes show interesting optical properties with high quantum yields, owing to the formation of H-aggregates.33−35 As a result of the aggregation in solution, the absorbance spectrum undergoes a spectral inversion and the emission spectrum exhibits prominent bathochromic shifts.36−38 Dyes such as rhodamine and perylene diimide have also shown aggregation behavior inside the polymer nanoparticles.39
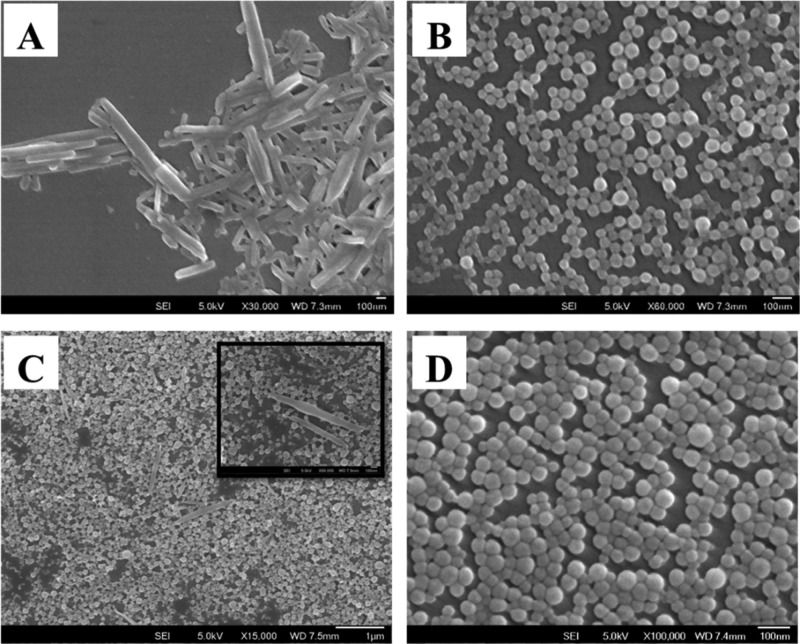
The precipitation experiments with pure PTE and PMMA particles were carried out separately in the presence of 2 wt % SDS. The SEM micrographs of the pure dye particles showed rod-type structures (Figure 2A), whereas the polymer particles were seen as spheres (Figure 2B). The precipitation by the addition of the separate solutions (same concentration and volume) of PMMA and PTE dye simultaneously into water showed both rods and spheres corresponding to the individual compounds (Figure 2C). Both dye and polymer dissolved in acetone (Figure 2D) and coprecipitated rapidly from water gave only spherical particles, indicating that PTE had been encapsulated inside PMMA.
Figure 2.
SEM micrographs of pure PTE (A), PMMA (B) nanomaterials prepared separately using the nanoprecipitation method. Mixture of PTE and PMMA nanomaterials prepared by adding the two solutions separately (C) with a magnified section of the sample (inset) and coprecipitated PMMA–PTE particles (D) from a previously mixed mixture.
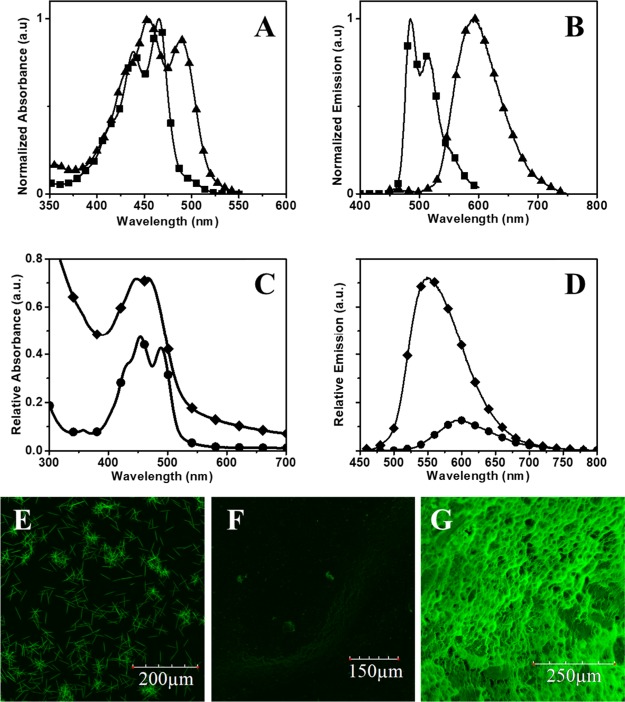
The absorption spectrum of PTE in acetone solution (Figure 3A) shows a shoulder peak at 410 nm and two peaks at 438 and 465 nm, corresponding to the 0–2, 0–1, and 0–0 transitions, respectively, indicating the presence of monomeric perylene in solution. The ratio of the absorption intensity A0–0/A0–1 gives an indication of the level of aggregation of the perylene dye.40 In solution, the ratio of the peaks gave a value of 1.23. After nanoprecipitation, there is an inversion in the relative intensities of the 0–1 and 0–0 peaks, with the ratio changing from 1.23 to 0.88, suggesting the formation of aggregates. Such observations were reported earlier by our laboratory and other groups.37,38,41−44 The formation of the aggregates is also evident in the fluorescence spectra (Figure 3B) of the PTE dye before and after precipitation. Before precipitation, a monomeric emission spectrum was obtained with the peak maxima at 485 and 515 nm. After the precipitation of the dye, the emission maximum showed a bathochromic shift (∼90 nm), and the observed maximum at 592 nm corresponds to the emission from the perylene excimer. Further evidence of the aggregation inside the particle can be observed by comparing the fluorescence of the nanoparticle solutions to the free dye solution (Figure S5).
Figure 3.
Absorption (A) and emission (B) spectra of the PTE solution (-■-; 12.5 μM in acetone) and particles (-▲-; effective PTE concentration of 12.5 μM) in the absence of polymer matrix. Absorption (C) and emission (D) spectra of the nanoprecipitated pure PTE (-●-; 12.5 μM) and PMMA–PTE (-⧫-; effective PTE concentration of 12.5 μM) particles in aqueous solutions under normalized conditions. Confocal images of PTE crystals (E) obtained from the acetone solution through evaporation; nanoprecipitated PTE (F) and PMMA–PTE (G) nanoparticles.
The analyses of the photophysical properties of the nanoparticles indicate the interaction between PTE and PMMA inside the particles (Figure 3C). The comparison of the A0–0/A0–1 ratio in the absorption spectra of PTE (0.88) and PMMA–PTE (1.00) shows a lower degree of aggregation in PMMA–PTE, which could be due to the disruption of aggregation and random packing of the perylene molecules inside the polymer lattice. The normalized emission spectrum (Figure 3D) further supports this hypothesis, in which the pure PTE showed significant aggregation-induced quenching (ACQ)44 and PMMA–PTE particles gave an enhanced fluorescence emission. Besides quenching the emission, the pure PTE particles (∼150 nm) showed a large stokes shift as compared to the PMMA–PTE (∼100 nm) particles.
The films of PTE powder and the PTE and PMMA–PTE particles were prepared by drop-casting the acetone solutions or dispersions and visualized using a confocal microscope under identical imaging conditions. The slow evaporation of acetone on a glass plate led to the formation of rod-shaped PTE particles (Figure 3E), which exhibited a strong fluorescence. The nanoprecipitated spherical particles of PTE (Figure 3F) exhibited a weak fluorescence because of ACQ, and the PMMA–PTE (Figure 3G) particles showed a strong fluorescence.
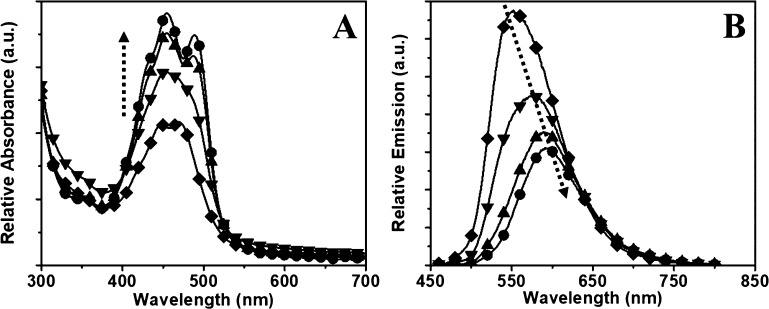
In case of the polymer particles, the incorporation of low concentrations of PTE showed monomeric emission peaks, whereas a high concentration of PTE led to the formation of peaks corresponding to the excimer formation. The emission intensity reduced with an increasing concentration of PTE, indicating an ACQ. This property was further investigated by varying the loading of PTE from 0.5 to 25 wt % inside the PMMA nanoparticles. The results were broadly categorized at low loading (0.5, 1.0, and 2.0 wt %, Figure 4) and high loading (5, 10, 17.5, and 25 wt %, Figure 5) conditions.
Figure 4.
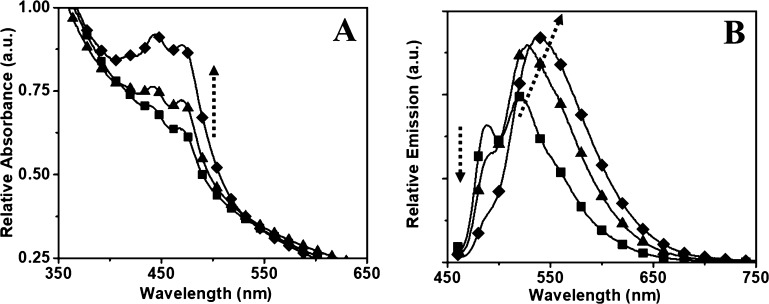
Absorption (A) and emission (B) spectra of the PMMA–PTE nanoparticles with (-■-) 0.5 wt %, (-▲-) 1 wt %, and (-⧫-) 2 wt % PTE loading (the effective concentration ranging from 3 to 13 μM). The arrows indicate the effects of increasing PTE dye concentration encapsulated inside the particle.
Figure 5.
Absorption (A) and emission (B) spectra of high-loading PMMA–PTE nanoparticles with PTE loading varied from (-⧫-) 5 wt %, (-▼-) 10 wt %, (-▲-) 17.5 wt %, and (-●-) 25 wt % (effective PTE concentration ranging from 33 to 165 μM in the final nanoprecipitated solution). All fluorescence measurements were measured with an excitation at 450 nm, path length of 1 cm, and concentration of 400 ppm. The fluorescence of diluted nanoparticle solutions (20 ppm) is shown in the Supporting Information (Figure S4). The arrows indicate the effects of increasing the concentration of the PTE dye.
At low concentrations (0.5–2 wt %) of PTE (Figure 4A), the absorption spectra showed variations in intensity because of the changes in concentration, whereas the emission spectra (Figure 4B) showed gradual changes from monomeric to excimeric emission accompanied with an increase in the quantum yield. At a PTE loading of 0.5 wt %, the monomeric emission spectrum is observed with the peaks at 488 and 521 nm. After increasing to 1.0 wt % loading, the monomeric peak disappears entirely, and a single excimer peak is observed at 527 nm. The emission maximum was shifted to 539 nm at a dye concentration of 2 wt %. A further increase in concentration of the dye loading to 5 wt % showed a decrease in emission intensity accompanied with a bathochromic shift (∼40 nm) in emission maximum (Figure 5).
The size, zeta potential, conductivity, quantum yield, and fluorescence lifetime of all polymer nanoparticles were measured and tabulated in Table 2. The hydrodynamic particle size of the PMMA nanoparticles and PMMA–PTE nanoparticles were 191 ± 45 and 185 ± 42 nm, respectively. The zeta potential values of the PMMA and PMMA–PTE nanoparticles were −30 ± 4 and −35 ± 1 mV, respectively. The polydispersity of PMMA–PTE particles was in the range of 0.095–0.129, indicating a narrow distribution of particle size. The quantum yields of the particles ranged from 0.19 to 0.29 and were measured using rhodamine B in ethanol as a reference and substituted in eq 1.43,44 The results indicate that with an increase in the PTE concentration, no significant increases in particle size, surface charge, or ion mobility were observed (Table 2). The increasing quantum yield and fluorescence lifetime with an increase in the concentration of PTE show that the formation of aggregates reduces the rate of nonradiative energy losses. This can be correlated to the restricted rotation and movement of the encapsulated PTE dye inside the polymer matrix.45
Table 2. Size, Zeta Potential, and Conductivity of SDS-Stabilized PMMA–PTE Nanoparticles (Low Loading).
| weight % PTEa (wt %) | particle size (nm) | zeta potential (mV) | conductivity (μS cm–1) | quantum yield (%) | lifetime (ns) |
|---|---|---|---|---|---|
| control | 191.0 | –30.0 | 6.23 | N.A. | N.A. |
| 0.5 | 196.5 | –34.6 | 17.4 | 19.5 | 2.5, 9.6b |
| 0.8 | 186.2 | –36.1 | 14.7 | 25.0 | 15.0 |
| 1.0 | 183.0 | –35.8 | 18.2 | 27.0 | 16.0 |
| 1.5 | 190.0 | –34.4 | 23.7 | 26.0 | 16.5 |
| 2.0 | 181.7 | –35.8 | 18.6 | 29.0 | 17.9 |
| 2.6 | 174.7 | –35.7 | 18.7 | 28.0 | 18.7 |
| 3.0 | 181.3 | –33.4 | 20.6 | 28.0 | 19.6 |
With respect to PMMA.
Lifetime corresponds to two emission maxima at 488 and 521 nm.
As the concentration of PTE was increased from 5 to 25 wt %, more pronounced differences were observed in the photophysical properties. In the absorption spectra (Figure 5A), an increase in intensity of the 0–1 absorption peak at 455 nm was observed as compared to the 0–0 peak at 490 nm, indicating the aggregation of the PTE molecules inside the PMMA matrix. The photoluminescence spectra (Figure 5B) showed the formation of perylene aggregates with the quenching of fluorescence upon increasing the PTE loading inside the polymer. The quenching of fluorescence was accompanied with a bathochromic shift in emission maximum from 550 to 600 nm. This indicates the formation of aggregates and excimers in the excited state. The quantum yield decreases from 0.28 to 0.19, whereas the lifetime of the particle increases from 19 to 29 ns upon increasing the PTE loading from 5 to 25 wt %, respectively. The increasing concentration of aggregates leads to the formation of stable excimer species with an increase in the fluorescence lifetime, whereas the quantum yield decreases because of ACQ.
Interaction of Nanoparticles with Mammalian Cells
To check on the uptake of the nanoparticles by the cells, baby hamster kidney (BHK) cells seeded in a 24-well plate and incubated for 24 h in Dulbecco’s modified Eagle’s medium (DMEM) were used as a model system. The monolayer of the cells formed was washed thoroughly and exposed to the nanoparticle solution diluted with DMEM to a concentration of 100, 50, 25, and 0 ppm, and the cells were incubated for 24 h. After incubation, the excess nanoparticles were removed by thorough washing with the phosphate-buffered saline (PBS) solution, and the cells were fixed with ice-cold methanol, mounted onto clean glass slides, and imaged using a confocal microscope.
The results collected indicated that the polymer nanoparticles permeated the cellular membrane. The images obtained for 100, 50, and 25 ppm exposure were found to be similar (Figure S3). At a concentration of 25 ppm, no significant morphological changes of cells were observed. The dye 4′,6-diamidino-2-phenylindole (DAPI) was used to stain the cell nuclei to obtain a reference plane for imaging (Figure 6A). Differential interference contrast (DIC) channel provided the morphology of the cells [Figure 6D(iii)], and the green channel (GFP) was used to visualize the nanoparticles inside the cells (Figure 6B). During the imaging process, the laser intensity and exposure levels were kept constant to obtain the accurate relative intensity profiles of the blue and green signals. The magnified region (Figure 6D) provides a clear visualization of nanoparticle distribution inside the cell when the blue and green signals are overlaid (Figure 6C). The nuclear stain appears as a continuous blue label, whereas the polymer nanoparticles appear as a punctate stain.31
Figure 6.
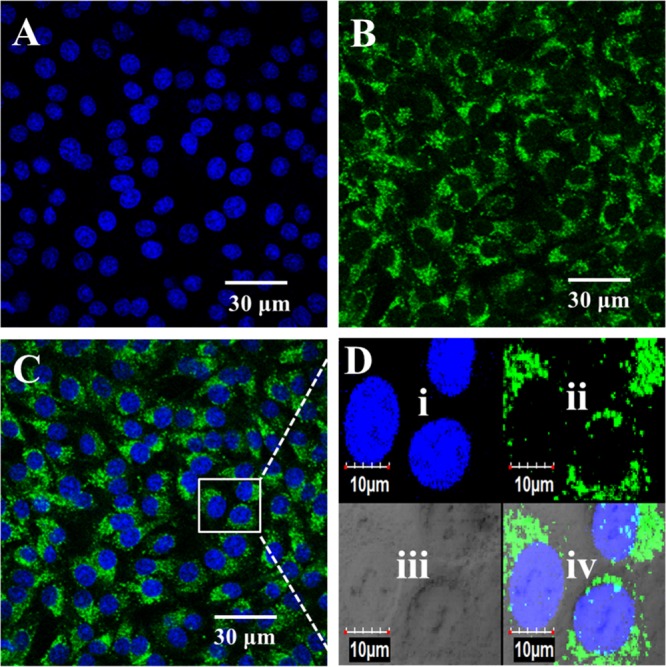
Interaction of BHK cells with PMMA–PTE nanoparticles at a concentration of 25 ppm. The images represent the nucleus stained with DAPI (A), cellular matrix stained with nanoparticles (B), and an overlay of the two images (C), with the magnified images in the inset showing nanoparticle distribution inside the cells (D). Magnified view (D) of nucleus stained with DAPI (i), cellular matrix stained with nanoparticles (ii), cells observed under DIC mode (iii), and overlay of (i)–(iv). The cells were imaged at a magnification of 60× oil objective using a confocal microscope (Olympus FV1000).
Nanoprecipitated polymer particles with encapsulated hydrophobic dyes are often used for bioimaging. In a recent report, rhodamine-based hydrophobic dyes were encapsulated into the PLGA nanoparticles.46 The encapsulated dye systems did not show significant leaching into the cellular cytoplasm as compared to the commercial cellular trackers such as LysoTracker.46 The main advantages of the PMMA–PTE nanoparticles over the other known dye-encapsulated systems reported in the literature are the high stability, long fluorescence lifetime, and high photostability.
Tracking of Nanoparticles in the Cell Using a Static Method
The uptake of the polymer nanoparticles into the cells was investigated as a function of time by analyzing the exposed cells at regular time intervals. In short, the BHK cells were seeded in a 24-well plate (50 × 103 cells/well), and the PMMA–PTE nanoparticles dispersed in the medium (1 mL, 25 ppm) were added to the wells. The cells were further incubated for an hour, washed thrice with PBS to remove the excess nanoparticles, and fixed using ice-cold methanol. The fixed cells were stained with DAPI and placed on glass slides for imaging. To track the location of the nanoparticles inside the cell, the nuclear plane, stained with DAPI and imaged using the blue channel, was considered as the frame of reference for all imaging.
The nanoparticles were imaged by illuminating the cells using the green channel. After 1 h (Figure 7A), there was a faint green signal observed from the nanoparticles inside the cells. After 3 h (Figure 7B), patches of green dots began to appear at the region outside the nucleus corresponding to the dye-encapsulated polymer nanoparticles. The time required for the internalization of the particles matches with the values reported earlier.46 After 6 h (Figure 7C), intensive green signals were observed around the nucleus. This indicates that the entry of nanoparticles into the cells reaches saturation within 6 h. It is understood that the process of internalization occurs through clathrin-dependent endocytosis which led to the localization of the nanoparticles inside lysosomes and endosomes.31 The internalization processes can also be studied through flow cytometry to better estimate the number of nanoparticles taken up by the cells.47
Figure 7.
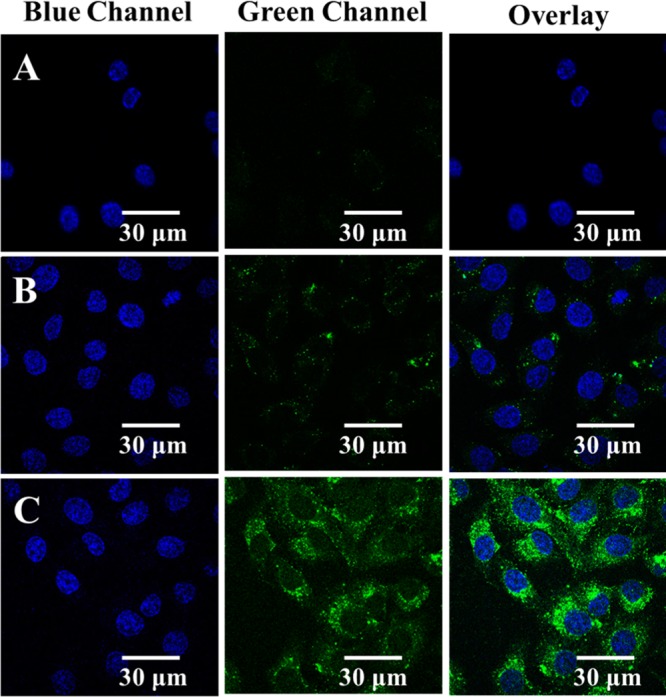
Time-based tracking of nanoparticles (25 ppm) inside the cells. From left to right column: DAPI stain in blue channel, nanoparticle stain in green channel, and the overlay of blue and green channels. Images observed after the polymer particle exposure of the cells for 1 (A), 3 (B), and 6 h (C) shown to compare the relative brightness. All images were recorded at 100× using a confocal microscope (Olympus FV1000).
Cytotoxicity Assay
In the current study, the theoretical concentration of SDS in the precipitated nanoparticle stock was in the order of 10–4 wt % or 0.002 mg/mL. The reported concentration of SDS at which cell viability is adversely affected is around 0.01 mg/mL.48 At a low concentration of SDS used in this study, the cytotoxic effects are negligible. After centrifugation, the supernatant liquid was analyzed and did not show a detectable concentration of free SDS. Therefore, it is concluded that the SDS incorporated inside the polymer particles did not leach out into the medium during the bioassay. The cytotoxic effects of both PTE-loaded and pure PMMA polymer nanoparticles were determined using the alamarBlue fluorescence assay. The assay was carried out with three biological replicates. Each biological replicate consisted of a set of five technical replicates, and the average values are reported. The mean values of the data collected from the replicates along with the standard deviation for the blank and PTE-loaded polymer nanoparticles are shown in Figure 8.
Figure 8.
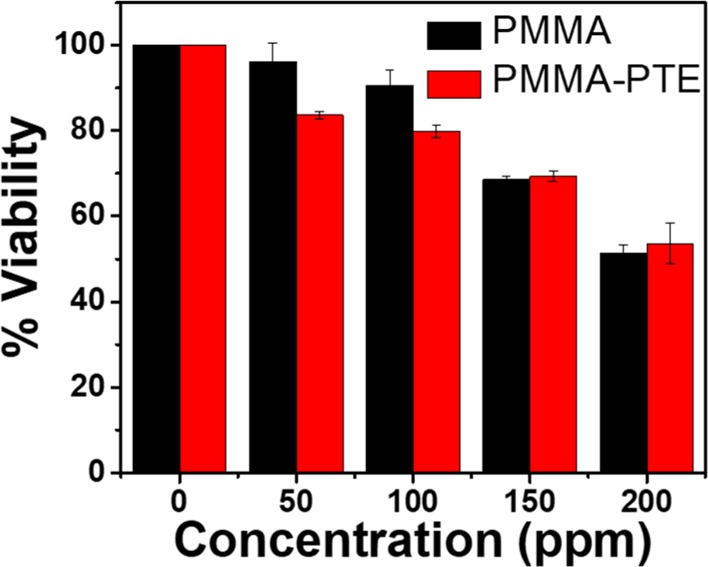
AlamarBlue assay for the determination of the viability of cells exposed to blank (PMMA) nanoparticles and PMMA–PTE nanoparticles.
To evaluate the viability, the background signal was first determined from the blank wells with alamarBlue alone. The untreated cells were used to set a baseline for viability. An additional negative control was performed to determine whether the fluorescence from the polymer nanoparticles would interfere with the assay. On the basis of the fluorescence intensity of the negative control, no significant changes in intensity were observed on the addition of the PMMA–PTE nanoparticles.
The active agent in alamarBlue assay is resazurin, which undergoes reduction to form resorufin inside living cells with an enhancement of fluorescence.49,50 This colorimetric change was monitored using a microplate reader. The excitation wavelength used was 535 nm, and the emission intensity was recorded at 615 nm. A background correction was applied to all measurements to reduce the error. The corrected measurements were normalized with respect to the controls (no nanoparticles), and the viability of the controls was set at 100%. On the basis of the viability assays (Figure 8), pure PMMA nanoparticles showed a cell death greater than 30% at particle concentrations between 150 and 200 ppm. At lower concentrations (<150 ppm) of our polymer particles, the cell death was less than 10%. The PMMA–PTE nanoparticles showed a similar trend in toxicity as the pure PMMA particles at high concentrations; however, the toxicity of the PTE-loaded nanoparticles was 17 and 20% at concentrations of 50 and 100 ppm, respectively. The PMMA–PTE nanoparticle concentration was reduced to 25 ppm for all studies to minimize the cytotoxic damage, and at this working concentration, clear signals from the nanoparticles inside the cells were visualized (Figures 6 and 7).
Conclusions
The PTE-loaded PMMA nanoparticles were synthesized by a rapid and simple nanoprecipitation technique with the incorporation of 2 wt % SDS to stabilize the particles. The fluorescence emission intensity of the PMMA particles is altered by controlling the concentration of the encapsulated PTE molecules inside the nanoparticle. Below 1 wt % PTE loading inside PMMA particles, purely monomeric emission spectra were observed, and upon increasing PTE loading to 2–3 wt %, excimer emission with an increase in quantum yield (29%) and lifetime (19 ns) was recorded. The fluorescent PMMA–PTE particles were observed to internalize into the cellular cytoplasm and not inside the nucleus. At concentrations up to 50 ppm, no significant changes in cell viability were observed because of the presence of the polymer nanoparticles. On average, the nanoparticles at a concentration of 25 ppm entered the cellular cytoplasm within the first 3 h of exposure. Such nontoxic, fluorescent-tagged PMMA–PTE nanoparticles were further modified for targeting and localization inside the cells.
Experimental Details
Materials
All chemicals were purchased from Sigma-Aldrich, unless stated otherwise, and used without further purification. PMMA (MW = 15 000), SDS, perylene-3,4,9,10-tetracarboxylic dianhydride, acetonitrile (HPLC grade), n-bromobutane, n-butanol, and 1,8-diazabicyclo[5.4.0]undec-7-ene were obtained from commercial sources and used without further purification for all experiments, unless stated otherwise. Doubly distilled water was used for the nanoprecipitation experiments.
Characterization of Synthesized Nanoparticles
The UV–visible spectra were measured on a UV-1800 Shimadzu UV–vis spectrophotometer with a bandwidth of 1 nm. The emission spectra were recorded on an Agilent Cary Eclipse fluorescence spectrophotometer using an excitation wavelength corresponding to the absorption maximum of the dye. The scanning electron micrographs were recorded using a JEOL JSM-6701F field emission anninectron microscope. All samples were prepared by diluting the polymer particle solution with water to a concentration between 0.05 and 0.75 mg/mL. The samples were drop-casted on glass coverslips, followed by the evaporation of the solvent, and were coated with platinum before imaging. The size of the particles and zeta potentials were measured using a Malvern Zeta Sizer instrument. The measurements were carried out at 25 °C, with the refractive index of PMMA set at 1.489. Time-correlated single-photon counting (TCSPC) of all polymer nanoparticle solutions was achieved using a Horiba (JobinYvon) Fluorolog spectrophotometer. The lifetime measurements were recorded using a 438 nm nanoLED source with a pulse duration of 260 ps. The signals were collected orthogonal to the excitation source and amplified in the axial channel using a 0.5 GHz amplifier module at the respective emission maxima of the fluorophores. Ludox nanospheres (Sigma-Aldrich) were used as the prompt solution to determine the instrument response function (IRF). The transconductance amplifier capacitor filter was adjusted to ensure a stop-to-start ratio below 2% for the fluorescent sample to prevent the pulse pileup. Origin Pro 2016 was used for the deconvolution of the IRF. The raw data collected from the fluorometer were fitted to nonlinear first-order decay, after the deconvolution of the IRF, to determine the lifetime of the probed excited state.51 The quality of the decay fit was estimated using the R2 values. The error in the measured lifetime because of the pulse width of the source was estimated at ±0.5 ns.
Optimization of Addition Methods
Nanoprecipitation is a kinetically controlled process in which parameters such as the concentration of the constituents, temperature, mixing rate, and the presence of stabilizer influence the formation of stable particles. The rate of addition was analyzed under two conditions—slow injection (1–6 mL/min) of the PMMA solution (1 mL, 4 mg/mL in acetone) into water (10 mL) and rapid pouring of the polymer solution (4 mg/mL, 1 mL) into water (10 mL) with continuous stirring. The resultant solution was stirred at ambient conditions for 18 h to remove the excess acetone slowly, and the obtained particles were analyzed by SEM to determine the morphology.
Stabilization of Particles in Solution Using SDS
The colloidal nanoparticles tend to undergo aggregation, flocculation, and sedimentation.52 To prevent the aggregation of PMMA particles, SDS (CMC = 8.2 mM) was added to introduce charges on the surface of the particles. The stock solutions of PMMA (4 mg/mL, MW = 15 000) and SDS (0.2–16 wt %) in acetone were prepared. Appropriate volumes of PMMA mixed with SDS in acetone (4 mg/mL, 1 mL, MW = 15 000) were precipitated by rapidly pouring into water. Excess surfactants cause adverse effects in biomedical applications. To reduce the amount used, the effect of the surfactant on the stability of the precipitated nanoparticles was examined. By varying the relative amounts of PMMA and SDS, an optimum SDS concentration (2 wt %, 28 μM) at which the stability of nanoparticles in water is established. The sonicated stock solution (5 mL) was rapidly added into deionized (DI) water (50 mL). The mixture was stirred for 18 h inside a fume hood to ensure the complete removal of acetone. The resultant nanoparticle solution was characterized by measuring their particle size, zeta potential, and conductivity.
Preparation of PTE-encapsulated PMMA Nanoparticles
For control experiments, the particles from pure PMMA and PTE were prepared in separate experiments. In a typical procedure, the PMMA (4 mg/mL; 20 mg) solution in acetone, containing SDS (2 wt %, 0.4 mg, 28 μM), was poured into DI water (50 mL). The resultant solution was stirred for 18 h to remove acetone. The final solutions were analyzed using the SEM and DLS instruments.
PTE was synthesized by using a reported procedure.53 The PTE-encapsulated PMMA nanoparticles were synthesized using the coprecipitation of PMMA (4 mg/mL, 20 mg), SDS (2 wt %, 0.4 mg, 28 μM), and PTE (0.1–6 mg, 0.15–9.20 μmol) stock solutions in acetone (5 mL) via rapid addition into 50 mL of water. The solutions were stirred at ambient conditions in a fume hood for 18 h to remove excess acetone. By considering all hydrophobic PTE molecules are encapsulated inside the PMMA particles, a theoretical loading of 0.5–25 wt % PTE (initial dye concentration with respect to PMMA) is expected. The supernatant obtained after the centrifugation of the solution showed no characteristic absorption peaks for the dye molecules. The solutions of the particles in water were analyzed using DLS, zeta potential, UV–vis, and photoluminescence spectroscopy. The nanoparticles from pure PMMA and dye-encapsulated PMMA were compared in terms of their colloidal stability, morphology, and visual appearance.
The quantum yield and fluorescence lifetime of all dye-encapsulated nanoparticle solutions were determined. The quantum yield of individual particle solutions was measured using eq 1.54
| 1 |
where Φ is the quantum yield, I is the integrated fluorescence intensity, A is the absorbance, and η is the refractive index of the medium for the sample and reference, respectively.
The fluorescence lifetime of the PTE-encapsulated PMMA nanoparticles was measured using a 438 nm nanoLED and Horiba Fluorolog-3 (JobinYvon) spectrophotometer. The samples and the prompt (LUDOX solution) were excited with a picosecond pulse, and the emitted photons were collected at an angle of 90° using TCSPC. The sample signals were deconvoluted from the prompt to obtain a first-order decay fitted curve, which was used to determine the fluorescence lifetime.
Internalization of Nanoparticles into Mammalian Cells for Imaging
To establish a cellular model system, BHK cells (ATCC CCL-10) were used to understand the uptake and internalization of the dye-encapsulated polymer nanoparticles. The polymer nanoparticle solution (400 ppm) was filtered through a 0.5 μm sterile filter and used for further experiments. An RPMI medium with 10% fetal calf serum was used as the cell culture medium. In a typical procedure, the cells were seeded on glass coverslips at a concentration of 30 × 103 cells/well, incubated for 24 h, and then exposed to nanoparticle solutions (25–100 ppm). After 24 h of exposure, the cells were washed with PBS, fixed with ice-cold methanol (0.5 mL, −20 °C) for 10 min, washed again with PBS, stained with DAPI, and imaged using confocal microscopy. All experiments were carried out in duplicates, and multiple controls were analyzed to establish the reliability and reproducibility of the results.
Cytotoxicity Assay
The experiments on internalization showed that the nanoparticles can permeate the cell membrane. To determine the cytotoxic effects of PMMA and dye-loaded PMMA nanoparticles, the alamarBlue assay was carried out. In this assay, the active reagent resazurin (blue) is reduced by the living cells into a pink resorufin product, whose concentration is monitored using absorption spectroscopy.50
Both pure PMMA and PTE-encapsulated PMMA nanoparticles were used in the study. In a typical assay, a 96-well plate was seeded with 5000 BHK cells/well. The cells were incubated for 24 h and exposed to polymer nanoparticle solutions at various concentrations (50–200 ppm). After 24 h of exposure to the nanoparticles, the cells were washed thrice with PBS solution. The alamarBlue solution (10%, 100 μL) was added to the wells and incubated for 2 h. After incubation, the well plates were read using a microplate reader operating at an excitation wavelength of 535 nm and an emission wavelength of 615 nm. The control experiments were also carried out to gain further insight into the toxicity of the polymer nanoparticles. The untreated cells were used as the blank reference, the cells treated with pure polymer nanoparticles (without perylene tetraester) served as a negative control, and the wells without cells served as the background. Viability was determined with respect to the blank reference.
Tracking of Polymer Nanoparticles Inside the Cell
The PTE-encapsulated PMMA nanoparticle solution (50 ppm, 1 mL in RPMI media) was added to the BHK cells (50 × 103 cells/well) seeded in 24-well plates. The cells exposed to polymer nanoparticles were observed at 1 h intervals to get a time-dependent nanoparticle distribution profile. The cells were fixed with methanol, stained with DAPI, and mounted on glass slides, before imaging with confocal microscopy.
Acknowledgments
S.B. acknowledges the Graduate Research Scholarship from NUS. The authors thank the National Research Foundation, Singapore for funding under MSRDP scheme.
Supporting Information Available
The Supporting Information is available free of charge on the ACS Publications website at DOI: 10.1021/acsomega.8b00785.
Molecular structure of PTE, graphs from DLS of nanoparticle solutions, fluorescence spectra of dilute nanoparticle solutions, fluorescence of free dye solution, and confocal images from concentration-dependent bioimaging (PDF)
The authors declare no competing financial interest.
Supplementary Material
References
- Zhang C.; Pansare V. J.; Prud’homme R. K.; Priestley R. D. Flash nanoprecipitation of polystyrenenanoparticles. Soft Matter 2012, 8, 86–93. 10.1039/c1sm06182h. [DOI] [Google Scholar]
- Geissler A.; Biesalski M.; Heinze T.; Zhang K. Formation of nanostructured cellulose stearoyl esters via nanoprecipitation. J. Mater. Chem. A 2014, 2, 1107–1116. 10.1039/c3ta13937a. [DOI] [Google Scholar]
- Liu Y.; Lu Y. C.; Luo G. S. Modified nanoprecipitation method for polysulfone nanoparticles preparation. Soft Matter 2014, 10, 3414–3420. 10.1039/c3sm53003e. [DOI] [PubMed] [Google Scholar]
- Miao M.; Chen Q.; Zhang C.; Cao X.; Zhou W.; Qiu Q.; An Z. Nanoprecipitation of PMMA Stabilized by Core Cross-Linked Star Polymers. Macromol. Chem. Phys. 2013, 214, 1158–1164. 10.1002/macp.201300234. [DOI] [Google Scholar]
- Morales-Cruz M.; Flores-Fernández G. M.; Morales-Cruz M.; Orellano E. A.; Rodriguez-Martinez J. A.; Ruiz M.; Griebenow K. Two-step nanoprecipitation for the production of protein-loaded PLGA nanospheres. Results Pharma Sci. 2012, 2, 79–85. 10.1016/j.rinphs.2012.11.001. [DOI] [PMC free article] [PubMed] [Google Scholar]
- Aubry J.; Ganachaud F.; Cohen Addad J.-P.; Cabane B. Nanoprecipitation of Polymethylmethacrylate by Solvent Shifting:1. Boundaries. Langmuir 2009, 25, 1970–1979. 10.1021/la803000e. [DOI] [PubMed] [Google Scholar]
- Giulbudagian M.; Asadian-Birjand M.; Steinhilber D.; Achazi K.; Molina M.; Calderón M. Fabrication of thermoresponsive nanogels by thermo-nanoprecipitation and in situ encapsulation of bioactives. Polym. Chem. 2014, 5, 6909–6913. 10.1039/c4py01186d. [DOI] [Google Scholar]
- Salvage J. P.; Thom C.; Lewis A. L.; Phillips G. J.; Lloyd A. W. Nanoprecipitation of polymeric nanoparticle micelles based on 2-methacryloyloxyethyl phosphorylcholine (MPC) with 2-(diisopropylamino)ethyl methacrylate (DPA), for intracellular delivery applications. J. Mater. Sci.: Mater. Med. 2015, 26, 150. 10.1007/s10856-015-5480-9. [DOI] [PMC free article] [PubMed] [Google Scholar]
- Zhang C.; Chung J. W.; Priestley R. D. Dialysis Nanoprecipitation of Polystyrene Nanoparticles. Macromol. Rapid Commun. 2012, 33, 1798–1803. 10.1002/marc.201200335. [DOI] [PubMed] [Google Scholar]
- Zhu Z. Flash Nanoprecipitation: Prediction and Enhancement of Particle Stability via Drug Structure. Mol. Pharm. 2014, 11, 776–786. 10.1021/mp500025e. [DOI] [PMC free article] [PubMed] [Google Scholar]
- Schubert S.; Delaney J. T. Jr.; Schubert U. S. Nanoprecipitation and nanoformulation of polymers: from history to powerful possibilities beyond poly(lactic acid). Soft Matter 2011, 7, 1581–1588. 10.1039/c0sm00862a. [DOI] [Google Scholar]
- Zhao L.-B.; Li S.-Z.; Hu H.; Guo Z.-X.; Guo F.; Zhang N.-G.; Ji X.-H.; Liu W.; Liu K.; Guo S.-S.; Zhao X.-Z. A novel method for generation of amphiphilic PDMS particles by selective modification. Microfluid. Nanofluid. 2011, 10, 453–458. 10.1007/s10404-010-0673-5. [DOI] [Google Scholar]
- Akbulut M.; Ginart P.; Gindy M. E.; Theriault C.; Chin K. H.; Soboyejo W.; Prud’homme R. K. Generic Method of Preparing Multifunctional Fluorescent Nanoparticles Using Flash NanoPrecipitation. Adv. Funct. Mater. 2009, 19, 718–725. 10.1002/adfm.200801583. [DOI] [Google Scholar]
- Zheng C.; Zheng M.; Gong P.; Jia D.; Zhang P.; Shi B.; Sheng Z.; Ma Y.; Cai L. Indocyanine green-loaded biodegradable tumor targeting nanoprobes for in vitro and in vivo imaging. Biomaterials 2012, 33, 5603–5609. 10.1016/j.biomaterials.2012.04.044. [DOI] [PubMed] [Google Scholar]
- Russin T. J.; Altinoğlu E. İ.; Adair J. H.; Eklund P. C. Measuring the fluorescent quantum efficiency of indocyanine green encapsulated in nanocomposite particulates. J. Phys.: Condens. Matter 2010, 22, 334217. 10.1088/0953-8984/22/33/334217. [DOI] [PubMed] [Google Scholar]
- Wagh A.; Qian S. Y.; Law B. Development of Biocompatible Polymeric Nanoparticles for in Vivo NIR and FRET Imaging. Bioconjugate Chem. 2012, 23, 981–992. 10.1021/bc200637h. [DOI] [PubMed] [Google Scholar]
- Bilati U.; Allémann E.; Doelker E. Development of a nanoprecipitation method intended for the entrapment of hydrophilic drugs into nanoparticles. Eur. J. Pharm. Sci. 2005, 24, 67–75. 10.1016/j.ejps.2004.09.011. [DOI] [PubMed] [Google Scholar]
- Dong Y.; Feng S.-S. Methoxy poly(ethylene glycol)-poly(lactide) (MPEG-PLA) nanoparticles for controlled delivery of anticancer drugs. Biomaterials 2004, 25, 2843–2849. 10.1016/j.biomaterials.2003.09.055. [DOI] [PubMed] [Google Scholar]
- Chorny M.; Fishbein I.; Danenberg H. D.; Golomb G. Lipophilic drug loaded nanospheres prepared by nanoprecipitation: effect of formulation variables on size, drug recovery and release kinetics. J. Controlled Release 2002, 83, 389–400. 10.1016/s0168-3659(02)00211-0. [DOI] [PubMed] [Google Scholar]
- Barichello J. M.; Morishita M.; Takayama K.; Nagai T. Encapsulation of hydrophilic and lipophilic drugs in PLGA nanoparticles by the nanoprecipitation method. Drug Dev. Ind. Pharm. 1999, 25, 471–476. 10.1081/ddc-100102197. [DOI] [PubMed] [Google Scholar]
- Budijono S. J.; Shan J.; Yao N.; Miura Y.; Hoye T.; Austin R. H.; Ju Y.; Prud’homme R. K. Synthesis of Stable Block-Copolymer-Protected NaYF4:Yb3+, Er3+Up-Converting Phosphor Nanoparticles. Chem. Mater. 2010, 22, 311–318. 10.1021/cm902478a. [DOI] [Google Scholar]
- Tan Y. F.; Chandrasekharan P.; Maity D.; Yong C. X.; Chuang K.-H.; Zhao Y.; Wang S.; Ding J.; Feng S.-S. Multimodal tumor imaging by iron oxides and quantum dots formulated in poly (lactic acid)-D-alpha-tocopheryl polyethylene glycol 1000 succinate nanoparticles. Biomaterials 2011, 32, 2969–2978. 10.1016/j.biomaterials.2010.12.055. [DOI] [PubMed] [Google Scholar]
- Zhang X.; Wang K.; Liu M.; Zhang X.; Tao L.; Chen Y.; Wei Y. Polymeric AIE-based nanoprobes for biomedical applications: recent advances and perspectives. Nanoscale 2015, 7, 11486–11508. 10.1039/c5nr01444a. [DOI] [PubMed] [Google Scholar]
- Zhang X.; Wang S.; Xu L.; Feng L.; Ji Y.; Tao L.; Li S.; Wei Y. Biocompatible polydopamine fluorescent organic nanoparticles: facile preparation and cell imaging. Nanoscale 2012, 4, 5581–5584. 10.1039/c2nr31281f. [DOI] [PubMed] [Google Scholar]
- Zhang X.; Zhang X.; Wang S.; Liu M.; Tao L.; Wei Y. Surfactant modification of aggregation-induced emission material as biocompatible nanoparticles: Facile preparation and cell imaging. Nanoscale 2013, 5, 147–150. 10.1039/c2nr32698a. [DOI] [PubMed] [Google Scholar]
- Feng L.; Zhu C.; Yuan H.; Liu L.; Lv F.; Wang S. Conjugated polymer nanoparticles: preparation, properties, functionalization and biological applications. Chem. Soc. Rev. 2013, 42, 6620–6633. 10.1039/c3cs60036j. [DOI] [PubMed] [Google Scholar]
- Li K.; Liu B. Polymer encapsulated conjugated polymernanoparticles for fluorescence bioimaging. J. Mater. Chem. 2012, 22, 1257–1264. 10.1039/c1jm14397b. [DOI] [Google Scholar]
- Wagh A.; Jyoti F.; Mallik S.; Qian S.; Leclerc E.; Law B. Polymeric Nanoparticles with Sequential and Multiple FRET Cascade Mechanisms for Multicolor and Multiplexed Imaging. Small 2013, 9, 2129–2139. 10.1002/smll.201202655. [DOI] [PubMed] [Google Scholar]
- Mehanny M.; Hathout R. M.; Geneidi A. S.; Mansour S. Studying the effect of physically-adsorbed coating polymers on the cytotoxic activity of optimized bisdemethoxycurcumin loaded-PLGA nanoparticles. J. Biomed. Mater. Res., Part A 2017, 105, 1433–1445. 10.1002/jbm.a.36028. [DOI] [PubMed] [Google Scholar]
- Li Q.; Li C.; Tong W. Nile Red Loaded PLGA Nanoparticles Surface Modified with Gd-DTPA for Potential Dual-Modal Imaging. J. Nanosci. Nanotechnol. 2016, 16, 5569–5576. 10.1166/jnn.2016.11735. [DOI] [PubMed] [Google Scholar]
- Vollrath A.; Schallon A.; Pietsch C.; Schubert S.; Nomoto T.; Matsumoto Y.; Kataoka K.; Schubert U. S. A toolbox of differently sized and labeled PMMA nanoparticles for cellular uptake investigations. Soft Matter 2013, 9, 99–108. 10.1039/c2sm26928g. [DOI] [Google Scholar]
- Reisch A.; Runser A.; Arntz Y.; Mély Y.; Klymchenko A. S. Charge-Controlled Nanoprecipitation as a Modular Approach to Ultrasmall Polymer Nanocarriers: Making Bright and Stable Nanoparticles. ACS Nano 2015, 9, 5104–5116. 10.1021/acsnano.5b00214. [DOI] [PubMed] [Google Scholar]
- Zhang Y.; Zhang L.; Liu H.; Sun D.; Li X. Synthesis and aggregation properties of a series of dumbbell polyhedral oligosilsesquioxane-perylene diimide triads. CrystEngComm 2015, 17, 1453–1463. 10.1039/c4ce02392g. [DOI] [Google Scholar]
- Sarbu A.; Biniek L.; Guenet J.-M.; Mésini P. J.; Brinkmann M. Reversible J- to H-aggregate transformation in thin films of a perylenebisimide organogelator. J. Mater. Chem. C 2015, 3, 1235–1242. 10.1039/c4tc02444c. [DOI] [Google Scholar]
- Wang Y. J.; Li Z.; Tong J.; Shen X. Y.; Qin A.; Sun J. Z.; Tang B. Z. The fluorescence properties and aggregation behavior of tetraphenylethene-perylenebisimide dyads. J. Mater. Chem. C 2015, 3, 3559–3568. 10.1039/c4tc02550d. [DOI] [Google Scholar]
- Shao C.; Grüne M.; Stolte M.; Würthner F. Perylene Bisimide Dimer Aggregates: Fundamental Insights into Self-Assembly by NMR and UV/Vis Spectroscopy. Chem.—Eur. J. 2012, 18, 13665–13677. 10.1002/chem.201201661. [DOI] [PubMed] [Google Scholar]
- Yagai S.; Seki T.; Karatsu T.; Kitamura A.; Würthner F. Transformation from H- to J-Aggregated Perylene Bisimide Dyes by Complexation with Cyanurates. Angew. Chem., Int. Ed. 2008, 47, 3367–3371. 10.1002/anie.200705385. [DOI] [PubMed] [Google Scholar]
- Ghosh S.; Li X.-Q.; Stepanenko V.; Würthner F. Control of H- and J-Type π Stacking by Peripheral Alkyl Chains and Self-Sorting Phenomena in Perylene Bisimide Homo- and Heteroaggregates. Chem.—Eur. J. 2008, 14, 11343–11357. 10.1002/chem.200801454. [DOI] [PubMed] [Google Scholar]
- Reisch A.; Trofymchuk K.; Runser A.; Fleith G.; Rawiso M.; Klymchenko A. S. Tailoring Fluorescence Brightness and Switching of Nanoparticles through Dye Organization in the Polymer Matrix. ACS Appl. Mater. Interfaces 2017, 9, 43030–43042. 10.1021/acsami.7b12292. [DOI] [PubMed] [Google Scholar]
- Spenst P.; Young R. M.; Phelan B. T.; Keller M.; Dostál J.; Brixner T.; Wasielewski M. R.; Würthner F. Solvent-Templated Folding of Perylene Bisimide Macrocycles into Coiled Double-String Ropes with Solvent-Sensitive Optical Signatures. J. Am. Chem. Soc. 2017, 139, 2014–2021. 10.1021/jacs.6b11973. [DOI] [PubMed] [Google Scholar]
- Würthner F.; Saha-Möller C. R.; Fimmel B.; Ogi S.; Leowanawat P.; Schmidt D. Perylene Bisimide Dye Assemblies as Archetype Functional Supramolecular Materials. Chem. Rev. 2016, 116, 962–1052. 10.1021/acs.chemrev.5b00188. [DOI] [PubMed] [Google Scholar]
- Würthner F.; Thalacker C.; Sautter A.; Schärtl W.; Ibach W.; Hollricher O. Hierarchical self-organization of perylene bisimide-melamine assemblies to fluorescent mesoscopic superstructures. Chem.—Eur. J. 2000, 6, 3871–3886. . [DOI] [PubMed] [Google Scholar]
- Sriramulu D.; Reed E. L.; Annamalai M.; Venkatesan T. V.; Valiyaveettil S. Synthesis and Characterization of Superhydrophobic, Self-cleaning NIR-reflective Silica Nanoparticles. Sci. Rep. 2016, 6, 35993. 10.1038/srep35993. [DOI] [PMC free article] [PubMed] [Google Scholar]
- Sriramulu D.; Valiyaveettil S. Perylene derivatives as a fluorescent probe for sensing of amines in solution. Dyes Pigm. 2016, 134, 306–314. 10.1016/j.dyepig.2016.07.028. [DOI] [Google Scholar]
- Banal J. L.; White J. M.; Ghiggino K. P.; Wong W. W. H. Concentrating Aggregation-Induced Fluorescence in Planar Waveguides: A Proof-of-Principle. Sci. Rep. 2014, 4, 4635. 10.1038/srep04635. [DOI] [PMC free article] [PubMed] [Google Scholar]
- Reisch A.; Didier P.; Richert L.; Oncul S.; Arntz Y.; Mély Y.; Klymchenko A. S. Collective fluorescence switching of counterion-assembled dyes in polymer nanoparticles. Nat. Commun. 2014, 5, 4089. 10.1038/ncomms5089. [DOI] [PubMed] [Google Scholar]
- Ferrari R.; Lupi M.; Falcetta F.; Bigini P.; Paolella K.; Fiordaliso F.; Bisighini C.; Salmona M.; D’Incalci M.; Morbidelli M.; Moscatelli D.; Ubezio P. Integrated multiplatform method for in vitro quantitative assessment of cellular uptake for fluorescent polymer nanoparticles. Nanotechnology 2014, 25, 045102. 10.1088/0957-4484/25/4/045102. [DOI] [PubMed] [Google Scholar]
- Krebs F. C.; Miller S. R.; Catalone B. J.; Welsh P. A.; Malamud D.; Howett M. K.; Wigdahl B. Sodium Dodecyl Sulfate and C31G as Microbicidal Alternatives to Nonoxynol 9: Comparative Sensitivity of Primary Human Vaginal Keratinocytes. Antimicrob. Agents Chemother. 2000, 44, 1954–1960. 10.1128/aac.44.7.1954-1960.2000. [DOI] [PMC free article] [PubMed] [Google Scholar]
- Hamid R.; Rotshteyn Y.; Rabadi L.; Parikh R.; Bullock P. Comparison of alamar blue and MTT assays for high through-put screening. Toxicol. in Vitro 2004, 18, 703–710. 10.1016/j.tiv.2004.03.012. [DOI] [PubMed] [Google Scholar]
- O’Brien J.; Wilson I.; Orton T.; Pognan F. Investigation of the Alamar Blue (resazurin) fluorescent dye for the assessment of mammalian cell cytotoxicity. Eur. J. Biochem. 2000, 267, 5421–5426. 10.1046/j.1432-1327.2000.01606.x. [DOI] [PubMed] [Google Scholar]
- Farinha J. P. S.; Martinho J. M. G. Resonance Energy Transfer in Polymer Nanodomains. J. Phys. Chem. C 2008, 112, 10591–10601. 10.1021/jp8016437. [DOI] [Google Scholar]
- Tambe D. E.; Sharma M. M. Factors Controlling the Stability of Colloid-Stabilized Emulsions. J. Colloid Interface Sci. 1993, 157, 244–253. 10.1006/jcis.1993.1182. [DOI] [Google Scholar]
- Sengupta S.; Dubey R. K.; Hoek R. W. M.; van Eeden S. P. P.; Gunbaş D. D.; Grozema F. C.; Sudhölter E. J. R.; Jager W. F. Synthesis of Regioisomerically Pure 1,7-Dibromoperylene-3,4,9,10-tetracarboxylic Acid Derivatives. J. Org. Chem. 2014, 79, 6655–6662. 10.1021/jo501180a. [DOI] [PubMed] [Google Scholar]
- Arbeloa F. L.; Ojeda P. R.; Arbeloa I. L. Flourescence self-quenching of the molecular forms of Rhodamine B in aqueous and ethanolic solutions. J. Lumin. 1989, 44, 105–112. 10.1016/0022-2313(89)90027-6. [DOI] [Google Scholar]
Associated Data
This section collects any data citations, data availability statements, or supplementary materials included in this article.


