Abstract
Expression of co-inhibitory receptors, such as CTLA-4 and PD-1, on effector T cells is a key mechanism for ensuring immune homeostasis. Dysregulated co-inhibitory receptor expression on CD4+ T cells promotes autoimmunity while sustained overexpression on CD8+ T cells promotes T cell dysfunction or exhaustion, leading to impaired ability to clear chronic viral infections and cancer1,2. Here, we used RNA and protein expression profiling at single-cell resolution to identify a module of co-inhibitory receptors that includes not only several known co-inhibitory receptors (PD-1, Tim-3, Lag-3, and TIGIT), but also a number of novel surface receptors. We functionally validated two novel co-inhibitory receptors, Activated protein C receptor (Procr) and Podoplanin (Pdpn). The module of co-inhibitory receptors is co-expressed in both CD4+ and CD8+ T cells and is part of a larger co-inhibitory gene program that is shared by non-responsive T cells in multiple physiological contexts and is driven by the immunoregulatory cytokine IL-27. Computational analysis identified the transcription factors Prdm1 and c-Maf as cooperative regulators of the co-inhibitory module, which we validated experimentally. This molecular circuit underlies the co-expression of co-inhibitory receptors in T cells and identifies novel regulators of T cell function with the potential to regulate autoimmunity and tumor immunity.
We used single-cell RNA-seq (scRNA-Seq) to analyze co-inhibitory and co-stimulatory receptor expression in 588 CD8+ and 316 CD4+ tumor-infiltrating lymphocytes (TILs) from B16F10 melanoma3. We found that PD-1, Tim-3, Lag-3, CTLA-4, 4–1BB, and TIGIT strongly co-vary in CD8+ TILs. CD4+ TILs showed a similar pattern with the additional co-expression of ICOS, GITR, and OX40 (Fig. 1a, top). Single-cell mass cytometry (CyTOF) confirmed the surface co-expression of these receptors (Fig. 1a, bottom, Supplementary Table Information 1). Expression of PD-1, Lag-3, Tim-3, and TIGIT was tightly correlated on both CD8+ and CD4+ TILs (Fig. 1a, bottom). Clustering analysis (t-SNE4, Methods) showed two groups of CD8+ TILs (clusters 1 and 2) (Fig. 1b, Extended Data Fig. 1a,c) where PD-1, Lag-3, Tim-3, and TIGIT were mainly expressed in cluster 1 cells (Fig. 1b, Extended Data Fig. 1c) as were LILRB4 (Extended Data Fig. 1a), and co-stimulatory receptors of the TNF-receptor family, 4–1BB, OX-40, and GITR. In contrast, ICOS and CD226 were less restricted to cluster 1 (Extended Data Fig. 1a). We further observed two discrete clusters of CD4+ TILs (clusters 3 and 4) wherein PD-1, Tim-3, Lag-3, and TIGIT co-expression was restricted to cluster 3 (Fig. 1b, Extended Data Fig. 1c).
Figure 1. Multiple co-inhibitory receptors are expressed as a module on CD4+ and CD8+ T cells.
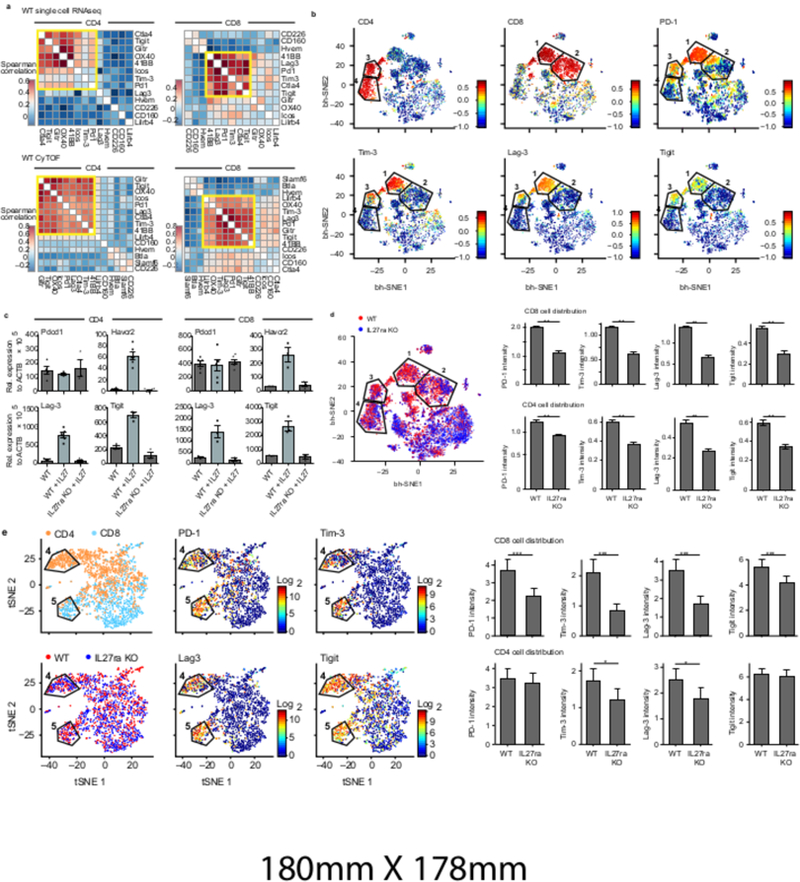
a) CD4+ and CD8+ tumor-infiltrating lymphocytes (TILs) were harvested from WT mice bearing B16F10 melanoma tumors. Top panels, co-expression analysis of co-inhibitory and co-stimulatory receptor mRNA expression as determined by single-cell RNA-seq for 316 CD4+ and 588 CD8+ TILs. Bottom panels, protein expression by CyTOF for 23,656 CD4+ and 36,486 CD8+ TILs. Spearman correlation, followed by dendrogram ordering of the matrix using Euclidian distance is shown. Data are from biologically independent experiments. b) TILs from WT mice bearing B16F10 melanoma were analyzed using CyTOF with a custom panel of antibodies against co-inhibitory and co-stimulatory cell surface receptors2,24 (Supplementary Information Table 1). Data were analyzed using vi-SNE. Polygons indicating clusters 1, 2 (in CD8+ T cells), 3 and 4 (in CD4+ T cells) are shown. Individual panels show expression of the indicated markers. c) Naïve T cells from either wild type (WT) or IL-27ra deficient (IL27ra KO) mice were stimulated with anti-CD3/CD28 in the presence or absence of IL-27. Indicated co-inhibitory receptors expression was examined by real-time PCR (qPCR) at 96hr (CD4) and 72hr (CD8). Data are from biologically independent animals. mean + s.e.m is shown. d) vi-SNE plot showing WT (red) and IL27ra KO (blue) cells. e) ScRNA-seq of TILs from mice bearing B16F10 melanoma. Data were analyzed using t-SNE. Polygons indicating cluster 4 (in CD4+ T cells, orange) and cluster 5 (in CD8+ T cells, blue) are shown. Individual panels show expression of the indicated markers. Bar graphs show the mean signal intensity for indicated co-inhibitory receptors from WT (CD4+ (n=849); CD8+ (n=1752)) and IL27ra KO (CD4+ (n=628); CD8+ (n=541)) TILs for CyTOF (d) or WT (CD4+ (n=707); CD8+ (n=825)) and IL27ra KO (CD4+ (n=376); CD8+ (n=394)) TILs for ScRNA-seq (e). Error bars indicate s.e.m. and *p < 0.05, **p < 0.01, ***p < 0.001; two-sided t-test.
The co-expression of co-inhibitory receptors on CD8+ and CD4+ T cells suggests a common trigger. One candidate is IL-27, a heterodimeric member of the IL-12 cytokine family that suppresses autoimmunity5, induces IL-10-secreting Type 1 regulatory (Tr1) cells6,7, and induces expression of Tim-3 and PD-L1 on CD4+ and CD8+ T cells8,9. Activation of CD4+ and CD8+ T cells in the presence of IL-27 induced Tim-3 (Havcr2), Lag-3, and TIGIT at mRNA (Fig. 1c) and protein levels (Extended Data Fig. 2a). Expression of Tim-3, Lag-3, and TIGIT was reduced in IL-27R-deficient T cells, whereas PD-1 (Pdcd1) expression was unaffected by IL-27 in vitro (Fig. 1c, Extended Data Fig. 2a).
CyTOF analysis showed that loss of IL-27ra resulted in loss of cells in cluster 1 of CD8+ TILs and cluster 3 of CD4+ TILs (Fig. 1d, p-value= 5×10⁻²³ and 6.8×10⁻⁷ for CD8+ and CD4+ respectively, hypergeometric test, Extended Data Fig. 1b,c,d), indicating a key role for IL-27 in driving co-inhibitory receptor co-expression in both CD4+ and CD8+ T cells in vivo. Although PD-1 expression wasn’t dependent on IL-27 in vitro, it was dependent on IL-27R signaling in vivo. In line with the induction of IL-10 by IL-275−7, we observed reduced IL-10 in IL27ra KO CD8+ TILs (Extended Data Fig. 2b).
scRNA-seq of CD8+ and CD4+ TILs from WT and IL27ra KO mice (Fig. 1e, Extended Data Fig. 3a,b; Methods) revealed distinct clusters of CD8+ (cluster 5) and CD4+ (cluster 4) TILs that highly expressed the co-inhibitory receptors PD-1, Tim-3, Lag-3, and TIGIT. Expression of these genes was decreased in CD8+ TILs from IL27ra KO mice, while only Tim-3 and Lag-3 were decreased in CD4+ TILs from IL27ra KO mice (Fig. 1e). Thus, IL-27 drives a module of co-inhibitory receptors that are strongly co-expressed in vivo together with IL-10.
The co-inhibitory receptor module could be part of a larger IL-27-driven inhibitory gene program. We analyzed the mRNA profiles of CD4+ and CD8+ T cells stimulated in the presence or absence of IL-27. IL-27 induced similar expression programs in CD4+ and CD8+ T cells (Extended Data Fig. 4a,b). We identified 1,201 genes with IL-27-dependent expression (Methods). We compared the IL-27-driven gene program to the gene signatures for four different states of T cell non-responsiveness: CD8+ T cell exhaustion in both cancer3 and chronic viral infection10 and antigen-specific11 or non-specific (anti-CD3 antibody12) CD4+ T cell tolerance. We found significant overlap with all of these signatures (Methods, Extended Data Fig. 4c-f).
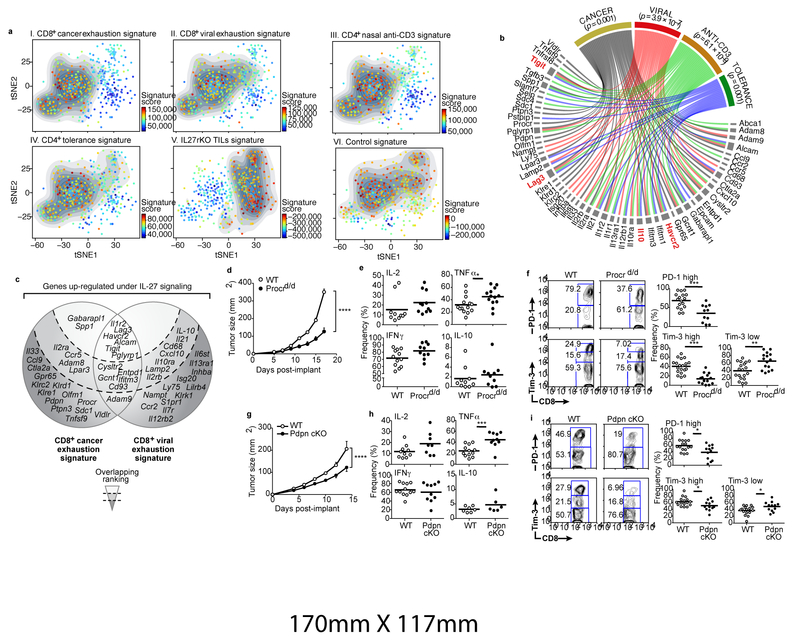
Projection of the IL-27/CD8+ cancer T cell exhaustion overlap signature onto the single-cell profiles of CD8+ TILs marked a distinct subset of cells (Fig. 2a, panel I). This subset scored highly for the overlap signatures between the IL-27-driven gene program and each of the other three states of T cell non-responsiveness (Fig. 2a, panels II-IV). The transcriptional program induced in IL27ra KO TILs was active in a complimentary subset of TILs (Methods, Fig. 2a panel V). The control signature from cells stimulated with IL-27 in vitro showed bimodal distribution and by itself did not detect the same population of cells (Fig. 2a panel VI). From these analyses, we identified a co-inhibitory gene module (272 genes) that is shared across multiple states of T cell non-responsiveness (Supplementary Information Table 2). Within this module, we identified a set of 57 genes encoding cell surface receptors and cytokines, including Tim-3, Lag-3, TIGIT, and IL10 (Fig. 2b), which we further stratified by their expression in cancer and chronic viral infections (Fig. 2c). Two surface molecules, Procr (protein C receptor) and Pdpn (podoplanin) were highly expressed in the setting of cancer (Fig. 2c). Activation of naïve CD4+ and CD8+ T cells in vitro in the presence of IL-27 induced the expression of Procr and Pdpn (Extended Data Fig. 5a). In vivo, Procr and Pdpn exhibited IL-27 dependent co-expression with PD-1 and Tim-3 on CD8+ TILs (Extended Data Fig. 5b).
Figure 2. The IL-27-induced gene program overlaps with multiple signatures of T cell dysfunction and tolerance.
a) Panels I-VI, tSNE plots of the 588 CD8+ single-cell TILs (dots) harvested from WT mice bearing B16F10 melanoma. Cells are colored in each panel by their signature score that reflects the relative average expression of the genes in the overlap of the IL-27-induced gene program with the signatures for each of the indicated states of T cell non-responsiveness. Panel VI is a projection of a signature of the differentially expressed genes between CD8+ TILs from WT and IL27ra KO mice bearing B16 melanoma (Methods). The contour marks the region of highly scored cells based on cells with signature scores above the mean. b) Graphical representation of the overlap of 57 IL-27-induced cell surface receptors or cytokine genes with genes expressed in different states of T cell non-responsiveness. The width of the gray bars reflects the extent of overlap across states. Significance of the overlap genes between the IL-27 induced and each state of T cell non-responsiveness state were calculated using Wilcox GST and camera. c) Graphical representation of the selected overlap genes between the cancer exhaustion and the chronic viral exhaustion signatures. The shaded background reflects the ranking based on the extent of overlap with the T cell states depicted. d) WT (n=8) mice and Procrd/d (n=7) or g) WT (n=5) and Pdpn cKO (n=5) mice were implanted with B16F10 melanoma. Data are from 3 biologically independent experiments. Mean tumor size + s.e.m is shown. ****P<0.0001, repeated measures ANOVA, Sidak’s multiple comparisons test. e and h) Summary of flow cytometry data for cytokine production in the indicated CD8+ TILs. f and i) Left panels, representative flow cytometry data for Tim-3 and PD-1 expression on the indicated CD8+ TILs. Right panels, summary data. e-i) *p < 0.05; **p < 0.01; ***p < 0.001, two-sided t-test.
Procr+ CD8+ TILs exhibited an exhausted phenotype, producing less TNFα and IL-2 and more IL-10 than Procr- CD8+ TILs (Extended Data Fig. 5c). Growth of B16F10 melanoma was inhibited in Procr hypomorph (Procrd/d)13 mice (Fig. 2d), and Procrd/d CD8+ TILs mice exhibited enhanced TNFα production, but no difference in IL-2, IFN-γ, or IL-10 (Fig. 2e). Procrd/d TILs exhibited a decreased frequency of Tim-3hiPD-1hi CD8+ T cells suggesting that Procr signaling promotes a severely exhausted phenotype in CD8+ T cells14 (Fig. 2f). Adoptive transfer of CD8+ T cells lacking Procr revealed a T cell specific role for Procr in constraining tumor growth (Extended Data Fig. 5d).
Although Pdpn can limit CD4+ T cell survival in inflamed tissues15, its role in T cell exhaustion is unknown. We observed a significant delay in B16F10 tumor growth in mice with Pdpn deficiency in T cells (Pdpn cKO) (Fig. 2g). Pdpn-deficient CD8+ TILs exhibited enhanced TNFα production but no significant difference in IL-2, IFN-γ, or IL-10 (Fig. 2h). The frequency of Tim-3hiPD-1hi CD8+ TILs was decreased, indicating a reduced accumulation of T cells with a severely exhausted phenotype in Pdpn cKO14 (Fig. 2i). Consistent with previous data15, Pdpn-deficient PD-1+Tim-3+ CD8+ TILs had higher expression of IL-7Ra, indicating that Pdpn may limit the survival of CD8+ TILs in the tumor microenvironment (Extended Data Fig. 5e,f).
We identified the transcription factor (TF) Prdm1 as a candidate regulator of the co-inhibitory module. Prdm1 is induced in vitro by IL-27 in CD4+ and CD8+ T cells (Extended Data Fig. 6a), is enriched in TILs with high expression of the IL-27 co-inhibitory module (Extended Data Fig. 3c-f and 6b,c and Methods), and is overexpressed in exhausted CD8+ TILs (p-value= 0.0004, t-test, Extended Data Fig. 6d). Network analysis based on profiling of naïve CD8+ T cells from mice with a T cell specific deletion of Prdm1 (Prdm1 cKO) stimulated with IL-27, showed that Prdm1 regulates multiple genes in the IL-27 co-inhibitory module (Extended Data Fig. 6e, p-value= 2.32×10⁻¹²; hypergeometric test; Methods). This was further supported by Prdm1 Chip-seq data16 (p-value= 2.9×10⁻⁸ respectively, hypergeometric test; Fig. 6e; Methods).
CD8+ TILs from B16F10 tumor-bearing Prdm1 cKO mice expressed lower levels of Tim-3, PD-1, and Procr (Fig. 3a); however, there was no difference in tumor growth compared to wild type (WT) controls (Fig. 3b), indicating that the reduction of co-inhibitory receptor expression in Prdm1 cKO mice was insufficient to promote effective anti-tumor immunity. We therefore examined whether other TFs may regulate the co-inhibitory module and compensate for the absence of Prdm1. We analyzed CD8+ TILs from Prdm1 cKO mice for the expression of genes from the IL-27-driven gene signature and the signature for exhausted CD8+ TILs (Methods; Supplementary Information Table 3). We found that only a few genes were upregulated in Prdm-1 cKO CD8+ T cells, including one TF, c-Maf (p-value < 0.05) (Fig. 3c). Indeed, c-Maf is induced by IL-27, is co-expressed with Prdm1 in T cells upon IL-27 stimulation (Extended Data Fig. 6a), and can regulate IL-10 expression17 and T cell exhaustion18. Additionally, many genes (226 genes, p-value 5.34×10⁻⁵, hypergeometric test) in the co-inhibitory gene module have a binding motif and a reported binding event for c-Maf within their promoter regions19.
Figure 3. Prdm1 and c-Maf individually regulate co-inhibitory receptors on T cells.
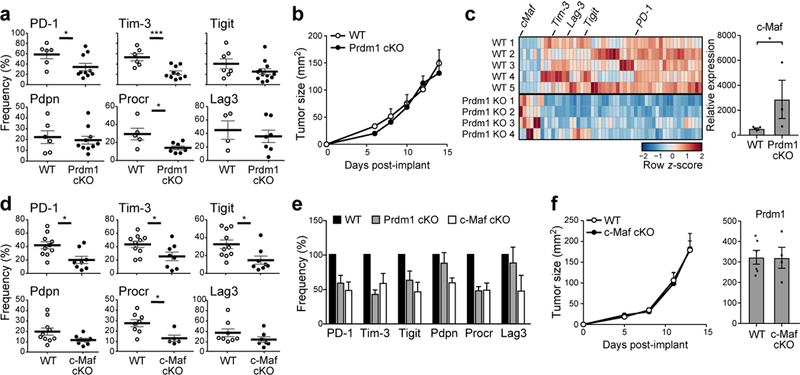
a) Summary data of co-inhibitory receptor expression on CD8+ TILs from WT and Prdm1 cKO mice bearing B16F10 melanoma. Data are from biologically independent animals. mean + s.e.m is shown. *p<0.05, ***p<0.001, two-sided t-test. b) WT (n=5) and Prdm1 cKO (n=5) mice were implanted with B16F10 melanoma. Mean tumor size + s.e.m. is shown. Data are from 3 biologically independent experiments. c) Left panel, gene expression in CD8+ TILs from WT and Prdm1 cKO mice bearing B16F10 melanoma was analyzed by n-counter code-set (Supplementary Information Table 3). Differentially expressed genes are shown as a heatmap. Right panel, expression of c-Maf in CD8+ TILs from WT and Prdm1 cKO mice as determined by qPCR. Data are from biologically independent animals. mean + s.e.m is shown. p = 0.03, two-sided t-test. d) Summary data of co-inhibitory receptor expression on CD8+ TILs from WT and c-Maf cKO. Data are from biologically independent animals. mean + s.e.m is shown. *p < 0.05, two-sided t-test. e) Frequency of co-inhibitory receptor expression of Prdm1 cKO (gray bar) and c-Maf cKO (open bar) CD8+ TILs relative to WT (filled bar). Data are from 3a and 3d, mean + s.e.m is shown. f) Left panel, WT (n=8) and c-Maf cKO (n=5) mice were implanted with B16F10 melanoma. Mean tumor size + s.e.m is shown. Data are from two biologically independent experiments. Right panel, expression of Prdm1 in CD8+ TILs from WT and c-Maf cKO mice as determined by qPCR.
CD8+ TILs from c-Maf cKO mice exhibited decreased expression of multiple co-inhibitory receptors (Fig. 3d). Interestingly, Prdm1 and c-Maf each impacted co-inhibitory receptor expression only partially (Fig. 3e). As in the Prdm1 cKO mice, c-Maf cKO mice did not show any differences in tumor growth relative to controls (Fig. 3f). Notably, Prdm1 expression in c-Maf cKO TILs was similar to that in WT TILs, indicating that Prdm1 might drive expression of the co-inhibitory gene module in the absence of c-Maf.
We addressed whether Prdm1 and c-Maf could act cooperatively to regulate co-inhibitory receptor expression. We found no evidence for a physical interaction between Prdm1 and c-Maf (data not shown); therefore we examined whether they shared targets. We combined the network analysis for Prdm1 (Extended Data Fig. 6e) with c-Maf ChIP-seq data19 and c-Maf targets (Methods). We observed 121 genes in the co-inhibitory module that are affected (RNAseq) or have a direct binding event (ChIP-Seq) for both Prdm1 and c-Maf (Fig. 4a), but that are not affected in either individual knockout. This is consistent, among other possibilities, with compensatory (e.g., “OR”) regulation20. Examination of ATACseq21,22 and ChIP-seq data for PD-1, Tim-3, Lag-3 and TIGIT shows that Prdm1 and c-Maf can bind both overlapping and non-overlapping sites in the loci of these receptors and can synergistically trans-activate Tim-3 expression (Extended Data Fig. 7).
Figure 4. Prdm1 and c-Maf together regulate a co-inhibitory gene module that determines anti-tumor immunity.
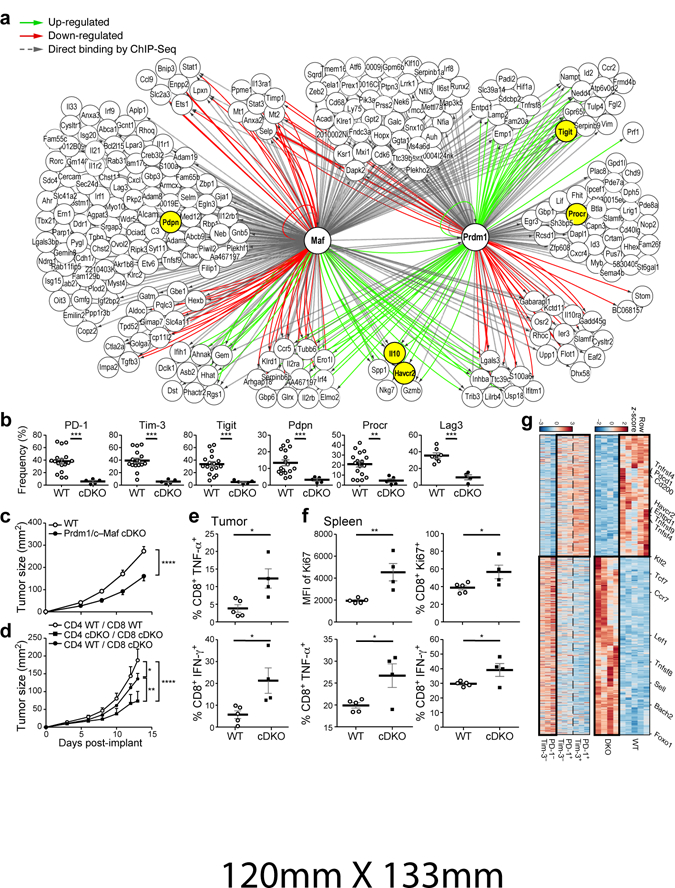
a) Network model based on coupling RNAseq gene expression data of naïve CD8+ T cells from Prdm1 cKO or c-Maf cKO mice stimulated in the presence of IL-27 and Prdm1 and c-Maf ChIPseq data. Up-regulated genes (green arrows), down-regulated genes (red arrows), and c-Maf or Prdm1 binding events (gray arrows) are shown. b) Summary data of indicated co-inhibitory receptors expression on CD8+ TILs from WT and Prdm1/c-Maf cDKO bearing B16F10 melanoma. Data are from biologically independent animals. mean + s.e.m is shown. **p < 0.01; ***p < 0.001, two-sided t-test. c) WT (n=15) and cDKO (n=8) mice were implanted with B16F10 melanoma. Data shown are from 3 biologically independent experiments. d) CD4+ or CD8+ T cells sorted from cDKO mice or littermate controls were transferred into Rag1 KO mice at a 2:1 CD4:CD8 ratio followed by subcutaneous injection of B16-OVA (n=5, each condition). Data are representative of 3 biologically independent experiments. c-d) Mean tumor size + s.e.m is shown. *P<0.05, **P<0.01, ****P<0.0001, repeated measures ANOVA, Sidak’s multiple comparisons test. e–f) T cells were harvested from Rag1 KO mice that received an adoptive transfer of CD4+ and CD8+ T cells from WT or cDKO mice (2:1 CD4:CD8 ratio) followed by subcutaneous injection of MC38-OVA (Extended Data Fig. 8e). e) The frequency of IFN-γ and TNF- α CD8+ TILs after OVA-peptide stimulation, f) the frequency and expression of Ki67+ cells on splenocytes (upper panel), and the frequency of IFN-γ and TNF-α CD8+ splenocytes (lower panel) after OVA-peptide stimulation. mean + s.e.m is shown. Data are from biologically independent animals. *P<0.05, **P<0.01, two-sided t-test. g) 940 differentially expressed genes between CD8+ TILs from WT and cDKO bearing B16F10 melanoma. (adj. P. value<0.05, likelihood ratio test and FDR correction) (top panel) and their corresponding expression pattern in PD-1+Tim-3+ CD8+, PD-1+Tim-3- CD8+, and PD-1-Tim-3- CD8+ TILs.
Mice with a T cell specific deletion in both Prdm1 and c-Maf (Prdm1/c-Maf cDKO) showed normal development of CD4+ and CD8+ T cells in terms of frequency and expression of memory/activation markers, although the frequency of Foxp3+ Treg was increased (Extended Data Fig. 8a). CD4+ and CD8+ TILs from cDKO mice bearing B16F10 melanomas exhibited a near absence of PD-1, Tim-3, Lag-3, TIGIT, Pdpn, and Procr expression (Fig. 4b; Extended Data Fig. 8b). Moreover, cDKO CD8+ TILs exhibited enhanced IL-2 and TNFα production (Extended Data Fig. 8c). In contrast to singly deficient mice, cDKO mice showed significant control of B16F10 tumor growth despite the increased frequency of Treg (Fig. 4c). We addressed whether Prdm1 and c-Maf play a cell-intrinsic role in CD8+ and CD4+ T cells in controlling tumor growth by using an adoptive transfer model. Although CD8+ T cells from cDKO were able to inhibit tumor growth with decreased expression of co-inhibitory molecules, these effects were stronger when Prdm1 and c-Maf were lacking in both CD4+ and CD8+ T cells (Fig. 4d; Extended Data Fig. 8d). We examined the roles of Prdm-1 and c-Maf in tumor antigen-specific T cell responses using the MC38-OVA tumor model. We observed a significant reduction in tumor growth in mice receiving cDKO T cells as compared to mice receiving WT T cells (Extended Data Fig. 8e). We also observed an increase in Ova-specific T cells in the tumor draining lymph nodes and in OVA-specific IFN-γ and TNF-α producing CD8+ T cells in both the tumor infiltrate and in the periphery in mice receiving DKO T cells (Fig. 4e,f; Extended Data Fig. 8f). Lastly, we observed an increase in CD8+ Ki67+ T cells in the periphery of mice receiving DKO T cells (Fig. 4f).
We tested for non-additive effects between Prdm1 and c-Maf by using a binomial generalized linear model to compare the effect of single knockouts to the cDKO, and found that 149 out of 940 differentially expressed genes (adj. p-value<0.05, likelihood ratio test and FDR correction) between WT and cDKO CD8+ TILs have non-additive (i.e. synergistic) effects (Extended Data Fig. 9, Methods).
Examination of the transcriptional signatures of cDKO CD8+ TILs showed significant overlap with those of CD8+ Tim-3-PD-1- TILs (Fig. 4g; p-value = 2.8×10⁻⁷ one-sample Kolmogorov-Smirnov test, Extended Data Fig. 10a-c, p-value=0.008), suggesting that loss of both c-Maf and Prdm1 increases the proportion of non-exhausted CD8+ effectors that exist normally in tumors. We scored the individual scRNA-seq profiles of CD8+ TILs for the cDKO 940 gene signature and found that expression of the cDKO gene signature and the co-inhibitory gene module signature mark mutually exclusive populations of TILs (Extended Data Fig. 10e). The cDKO signature showed significant overlap with PD-1+CXCR5+CD8+ T cells, which may represent precursors for functional effectors in chronic LCMV infection23 (Extended Data Fig. 10d,e, p-value = 1×10⁻¹³ one-sample Kolmogorov-Smirnov test). Furthermore, the IL27ra KO TILs signature also showed significant overlap with this PD-1+CXCR5+CD8+ T cell signature (p-value < 2.2×10⁻¹⁶ one-sample Kolmogorov-Smirnov test, Extended Data Fig. 10e; Fig. 2a). Collectively, our data indicate that loss of c-Maf and Prdm1 preferentially results in loss of the co-inhibitory gene module expression and acquisition of a more responsive effector T cell state.
In conclusion, we identified a co-inhibitory gene module, which is expressed in multiple settings of both CD4+ and CD8+ T cell non-responsiveness, along with its transcriptional regulators. The discovery of this module provides a basis for the identification of novel co-inhibitory and co-stimulatory receptors that may play an important role in T cell regulation.
Methods
Mice
C57BL/6 wild-type (WT), IL27ra KO, and Prdm1 fl/fl mice were obtained from the Jackson Laboratory (Bar Harbor, ME). c-Maf fl/fl, Pdpn fl/fl mice and Procr delta/delta mice were previously described13,15,26. Pdpn fl/fl mice were initially obtained from Christopher Buckley (University of Birmingham, Birmingham, UK) and crossed to CD4Cre mice to obtain conditional deletion in T cell. CD4Cre mice were purchased from Taconic (Hudson, NY). Prdm1 fl/fl and c-Maf fl/fl mice were crossed to CD4Cre mice to generate doubly deficient T cell conditional knockout mice. All experiments were performed in accordance to the guidelines outlined by the Harvard Medical Area Standing Committee on Animals (Boston, MA).
Tumor Experiments
5 × 10⁵ B16F10 melanoma cells (ATCC) were implanted into the right flank of C57BL/6 mice. Tumor size was measured in two dimensions using a caliper. TILs were isolated by dissociating tumor tissue in the presence of 2.5 mg/ml collagenase D for 20 min before centrifugation on a discontinuous Percoll gradient (GE Healthcare). Isolated cells were then used in various assays of T cell function. For antigen specific analysis, we applied adoptive transfer tumor experiments using T cells from Prdm1/c-Maf cDKO mice, CD4+ or CD8+ T cells sorted from cDKO mice or littermate controls were transferred into Rag1 KO mice at a 2:1 ratio (CD4: 1 million/mouse and CD8: 0.5 million/mouse) 2 days before subcutaneous injection of B16-OVA or MC38-OVA tumor. B16-Ova was kind gift from Kai Wucherpfennig (Dana-Farber Cancer Institute, Boston, MA) and MC38-Ova was kind gift from Mark Smyth (QIMR Berghofer, Queensland Institute of Medical Research, Brisbane Australia). For adoptive transfer tumor experiments using T cells from Procrd/d mice, CD4+ T cells from WT and CD8+ T cells from WT or Procrd/d mice were isolated by cell sorting (BD FACS Aria) and transferred into Rag deficient recipient mice at a 2:1 ratio (WT CD4+: 1 million/mouse and WT or Procrd/d CD8+: 0.5 million/mouse) 2 days before tumor implant. Although we did not blinding or randomization, at least 5 animals of target gene knock out and control mice were used to adequately power biological validation experiments throughout the article. All mice used are C57BL/6 background, both male and female, 6–12 weeks of age, 15–25g. Each experiment was performed using age, sex matched controls (Supplementary Information Table 5).
CyTOF
Antibodies were labeled using MaxPar® Metal Labeling Kits (DVS) by The Longwood Medical Area CyTOF Antibody Resource and Core. In some experiments, TILs were enriched using Dynabeads FlowComp Mouse Pan T (CD90.2) Kit (Invitrogen). Cells were washed and resuspended in CyTOF PBS (PBS + 0.05% sodium azide + 0.5% BSA) and stained viability marker Rhodium (DVS) following the cocktail of antibodies against cell-surface molecules for 30 min. Cells were washed again and resuspended in CyTOF PBS with 4% paraformaldehyde. After 10 min fixation, cells were washed and barcoded with Cell-ID intercalators (DVS). Before analysis, cells were resuspended in water with beads and loaded to the CyTOF® Mass Cytometer (DVS). CyTOF data were recorded in dual-count according to Fluidigm’s recommended settings that calibrated on the fly, combining pulse-count and intensity information. Data obtained as mass peaks for the channels are processed according to cell event selection criteria. These criteria include cell viability selection (Pt195), single-cell selection (Intercalator-Ir), and barcoding selection (Pt194 and Pt198) to identify single-cell events from WT TILs and KO TILs for further analysis.
To obtain clusters of cells similar in their protein expression patterns, cells were clustered using k-means algorithm. Optimal cluster number was estimated using the within groups sum of squared error (SSE) plot followed by gap statistics with bootstrapping and first SE max method. These methods suggested 9 clusters as optimal in the multidimensional space. Applying k-means clustering with (k=9) on our CyTOF data, resulted in clear distinction between cluster 1 and 2 of the CD8+ TILs and cluster 3 and 4 of the CD4+ TILs. This separation could be further visualized by two-dimensional non-linear embedding of the protein expression profiles using t-stochastic neighborhood embedding (t-SNE4). The t-SNE plot can then be overlaid by k-means clustering results to reflect a non-biased approach to the clusters or with intensity of the different markers.
Flow Cytometry
Single cell suspensions were stained with antibodies against CD4 (RM4–5), CD8 (53–6.7), PD-1 (RMP1–30), Lag-3 (C9B7W), TIGIT (GIGD7), and Tim-3 (5D12), Procr (eBio1560), and Pdpn (8.1.1.) were obtained from BioLegend (San Diego, CA). Fixable viability dye eF506 (eBioscience) was used to exclude dead cells. For intra-cytoplasmic cytokine staining, cells were stimulated with (PMA) (50ng/ml, Sigma-Aldrich, MO), ionomycin (1µg/ml, Sigma-Aldrich, MO). Permeabilized cells were then stained with antibodies against IL-2, TNF-α, IFN-γ or IL-10. All data were collected on a BD LSR II (BD Biosciences) and analyzed with FlowJo software (Tree Star).
In vitro T cell differentiation
CD4+ and CD8+ T cells were purified from spleen and lymph nodes using anti-CD4 microbeads and anti-CD8a microbeads (Miltenyi Biotech) then stained in PBS with 0.5% BSA for 15 min on ice with anti-CD4, anti-CD8, anti-CD62L, and anti-CD44 antibodies (all from Biolegend, CA). Naïve CD4+ or CD8+ CD62LhighCD44low T cells were sorted using the BD FACSAria cell sorter. Sorted cells were activated with plate bound anti-CD3 (2μg/ml for CD4 and 1μg/ml for CD8) and anti-CD28 (2μg/ml) in the presence of rmIL-27 (25ng/ml) (eBioscience). Cells were harvested at various time points for RNA, intracellular cytokine staining, and flow cytometry.
Real-time PCR
Total RNA was extracted using RNeasy columns (Qiagen). Reverse transcription of mRNA was performed in a thermal cycler (Bio-Rad) using iScript™ cDNA Synthesis Kit (Bio-Rad). Real-time PCR was performed in the Vii7™ Real-Time PCR system (Applied Biosystems) using the primers for Taqman gene expression (Applied Biosystems). Data was normalized to the expression of ACTB.
Nanostring RNA analysis
Expression profiling of TILs.
We analyzed gene expression in CD8+ TILs from Prdm1 or c-Maf cKO mice bearing B16F10 melanoma collected on day 14 after tumor implantation, using a custom nanostring code-set of 397 genes representing both the IL-27-driven gene signature (245 genes) and the dysfunctional CD8+ TIL gene signature (245 genes) (Supplementary Information Table 3). Expression values were normalized by first adjusting each sample based on its relative value to all samples. This was followed by subtracting the calculated background (mean.2sd) from each sample with additional normalization by housekeeping geometric mean, where housekeeping genes were defined as: Hprt, Gapdh, Actin and Tubb5. Differentially expressed genes were defined using the function that fits multiple linear models from the Bioconductor package limma in R27 with p-value<0.05.
Microarray processing and analysis
Naïve CD4+ and CD8+ T cells were isolated from WT or IL27ra KO mice, and differentiated in vitro with or without IL-27. Cells were collected at 72 hours for CD8+ and 96 hours for CD4+ and Affymetrix GeneChip Mouse Genome 430 2.0 Arrays were used to measure the resulting mRNA levels at these time points. Individual .CEL files were RMA normalized and merged to an expression matrix using the ExpressionFileCreator of GenePattern with default parameters28. Gene-specific intensities were then computed by taking for each gene j and sample i the maximal probe value observed for that gene. Samples were then transferred to log-space by taking log2(intensity).
Differentially expressed genes were annotated as genes with FDR-corrected ANOVA <0.05 computed between the CD4 with or without IL-27 stimulation (CD4+ IL27 and Th0) subpopulations (1,202 genes). 468 genes were differentially expressed between WT CD8+ T cells stimulated in the presence or absence of IL-27 (p-value<0.05). 234 genes were shared between these two differentially expressed gene lists (p-value = 2.25×10−157, hypergeometric test, background=16,618 (union of genes expressed)). A list of 972 cell surface/cytokines genes of interest that include: cytokines, adhesion, aggregation, chemotaxis and other cell surface molecules (Supplementary Information Table 4) composed using GO annotation in Biomart was used to generate the gene subset in Fig. 2b and c.
RNAseq gene expression profiling of tumor infiltrating cells
Tumor infiltrating CD8+ T cells were isolated from WT, IL27ra KO, Prdm1 cKO, c-Maf cKO, and Prdm1/c-Maf cDKO tumor bearing mice via FACS sorting on a FACSAria (BD Biosciences). Tumor infiltrating CD8+ T cells were processed using an adaptation of the SMART-Seq 2 protocol29, using 5uL of lysate from bulk CD8+ T cells as the input for each sample during RNA cleanup via SPRI beads (~2,000 cells lysed on average in RLT).
RNA-seq reads were aligned using Tophat30 (mm9) and RSEM-based quantification31 using known transcripts (mm9), followed by further processing using the Bioconductor package DESeq in R32. The data was normalized using TMM normalization. The TMM method estimates scale factors between samples that can be incorporated into currently used statistical methods for DE analysis. Post-processing and statistical analysis was carried out in R31. Differentially expressed genes were defined using the differential expression pipeline on the raw counts with a single call to the function DESeq (adjusted p value<0.1). Heatmap figures were generated using pheatmap package33.
Single-cell RNA-seq
CD4+ and CD8+ TILs from WT or IL27ra KO mice bearing B16 melanomas were sorted into 96-well plates with 5 µl lysis buffer comprised of Buffer TCL (Qiagen) plus 1% 2-mercaptoethanol (Sigma). Plates were then spun down for one minute at 3000rpm and immediately frozen at −80°C. Cells were thawed and RNA was isolated with 2.2x RNAClean SPRI beads (Beckman Coulter Genomics) without final elution34. The beads were then air-dried and processed immediately for cDNA synthesis. Samples were then processed using the Smart-seq2 protocol35, with minor modifications applied to the reverse transcription (RT) step (MSK and AR., in preparation). This was followed by making a 25µl reaction mix for each PCR and performing 21 cycles for cDNA amplification. Then 0.25 ng cDNA from each cell and ¼ of the standard Illumina NexteraXT reaction volume were used in both the tagmentation and final PCR amplification steps. Finally, libraries were pooled and sequenced (50 × 25 paired-end reads) using a single kit on the NextSeq500 5 instrument. All CD4+ TILs (WT and IL27ra KO) single-cell RNA-seq data was generated as part of this study. CD8+ TILs single-cell data includes WT CD8+ TILs data from3 and WT and IL27ra KO CD8+ single-cell data generated as part of this study.
Single-cell RNA-seq data preprocessing and expression
Initial preprocessing was performed as described in3. Briefly, paired reads were mapped to mouse annotation mm10 using Bowtie36 (allowing a maximum of one mismatch in seed alignment, and suppressing reads that had more than 10 valid alignments) and TPMs were computed using RSEM31, and log2(TPM+1) values were used for subsequent analyses.
Next, we filtered out low quality cells and cell doublets, maintaining for subsequent analysis the cells that had (1) 1,000–4,000 detected genes (defined by at least one mapped read), (2) at least 200,000 reads mapped to the transcriptome, and (3) at least 50% of the reads mapped to the transcriptome, ending with a total of 707 CD4+ and 825 CD8+ WT TILs and 376 CD4+ and 394 CD8+ IL27ra KO TILs. We restricted the genes considered in subsequent analyses to be the genes expressed at log2(TPM+1)≥2 in at least twenty percent of the cells.
After removal of low quality cells the data was normalized using quantile normalization followed by PCA analysis. PCs 1–10 were chosen for subsequent analysis due to a drop in the proportion of variance explained following PC10. We used tSNE4 to visualize single-cells in a two-dimensional non-linear embedding.
Single-cell RNA-seq clustering and differential expression analysis
For the coupled dataset of WT and IL27ra KO TILs we followed the analysis described in 37. We performed batch correction using ComBat38 and the batch-corrected expression matrix was then reduced using PCA, PCs 1–13 were chosen for subsequent analysis due to a drop in the proportion of variance explained following PC13. Next, we cluster the cells based on their PC scores using the Louvain-Jaccard method using 40 nearest neighbors, and the 13 PCs25,39; 11 clusters were detected. We then compared the composition of each cluster in terms of total number and percentage of WT and IL27ra KO cells and found cluster 5 to be enriched for WT CD8 TILs cells (p-value= 0.0357, one sample t-test, Extended Data Fig. 3c,d). Projecting the IL-27 co-inhibitory gene module onto the single-cell RNA-seq data highlighted clusters 4 and 5 (CD4 and CD8 respectively) (Extended Data Fig. 3e), further showing that in addition to the decrease in the expression of the co-inhibitory receptors: PD-1, Tim-3, Lag-3 and TIGIT (Fig. 1e), a significant decrease in the total IL-27 co-inhibitory gene module signature score is observed with lack of IL-27 signaling (p-value=0.01, t-test, Extended Data Fig. 3f). Last, we searched for differentially expressed genes between clusters 4/5 and the rest of the clusters using a nonparametric binomial test37.
Signature analysis of other states of T cell non-responsiveness
Given that orthogonal approaches were used to generate the various signatures, we first addressed the robustness of each signature prior to the comparative analysis. First, to address some of the concerns regarding the definition of these signatures we sub-sampled the genes in each of the signatures and observed the resulting changes by projection on the single-cell data. These changes were quantified by randomly selecting decreasing subsets of genes from each signature (100%, 90% … 30%) and calculating the average silhouette width of the cells that scored high for the different generated signatures, based on Euclidian distance between the principal component values used to generate the tSNE plot. This analysis shows that the signatures are relatively resilient to this procedure up to 60% of the original signature (Extended Data Fig. 4e).
Second, we calculated a signature p-value per cell. The p-value is calculated by generating random sets of signatures that are composed of genes with a similar average and variance expression levels as the original signature. This was followed by comparing the generated scores to the score obtained from the original signature. Cells that had a statistically significant score (adjusted p-value<0.05) were marked by ‘+’ (Extended Data Fig. 4f).
For viral exhaustion: Microarray dataset10 was downloaded, followed by RMA. A signature of viral exhaustion was defined as the genes that are differentially expressed between chronic and acute viral infection on day 15 and day 30. Genes were ranked based on a t-test statistic and fold change, each gene rank was then adjusted for multiple hypotheses testing using false discovery rate (FDR). A threshold of fold change>1.1 and FDR<0.2 was applied.
For antigen-specific tolerance: Data11 were downloaded. Two groups were defined, group 1 that includes the PBS and 0.008 μg treated samples (treatment number 1) versus group 2 – 80 μg (treatment number 5 and 6). After Log2 transformation and quantile normalization, the Limma package was used to estimate the fold changes and standard errors by fitting a linear model for each gene for the assessment of differential expression. Genes with p value < 0.05 were selected: 1,845 genes were upregulated of which 88 were defined as cytokine and cell surface molecules27,40,41.
For antigen non-specific tolerance: Data12 was downloaded. Robust Multi-array Average (RMA) and quantile normalization were applied for background correction and normalization using the ExpressionFileCreator module of GenePatterns. Differentially expressed genes were defined using signal-to-noise ratio (SNR), following FDR correction. Differentially expressed genes were identified as genes having a FDR<0.2 between mRNA expression profiles of naïve CD4+ or CD4+ GFP/IL-10+ T cells isolated from the spleen or cLNs of B6NODF1IL10:GFP mice following nasal treatment with anti-CD3 which attenuates the of progressive phase of EAE.
For cancer: Data3 was obtained. Briefly, mRNA samples from CD8+Tim-3-PD-1- (DN) TILs, CD8+Tim-3-PD-1+(SP), and CD8+Tim-3+PD-1+ (DP) TILs were measured using Affimetrix GeneChip Mouse Genome 430 2.0 Arrays, expression values were RMA normalized, corrected for batch effects using ComBat38 and gene-specific intensities were then computed by using the maximal prob intensity per gene, values were transferred to log-space by taking log2(intensity). Differentially expressed genes were defined as genes with either an FDR-corrected t-test p-value smaller or equal to 0.2 computed between the DN and DP subpopulations and a fold-change of at least 1.5 between the two subpopulations.
The IL-27 co-inhibitory gene module was defined as a union of the overlap between the IL-27-driven gene program (1,201 genes see Methods: Microarray processing and analysis) and each of the four different states of T cell non-responsiveness mentioned above (272 genes, Supplementary Information Table 2).
For IL27ra KO signature: mRNA samples from FACS sorted CD8+ TILs from WT and IL27ra KO mice bearing B16 melanomas were measured an adaptation of the SMART-Seq 2 protocol29 (see Method: RNA expression profiling of tumor infiltrating cells). Differentially expressed genes were defined as genes with either an FDR-corrected t-test p-value smaller or equal to 0.2 computed between the WT and IL27ra KO and a fold-change of at least 1.5 between the two subpopulations. IL27ra KO signature was defined as 929 differentially expressed genes in IL27ra KO CD8+ TILs compared to WT CD8+ TILs.
Single-cell gene signature computation
As an initial step, the data was scaled (z-score across each gene) to remove bias towards highly expressed genes. Given a gene signature (list of genes), a cell-specific signature score was computed by first sorting the normalized scaled gene expression values for each cell followed by summing up the indices (ranks) of the signature genes. For gene-signatures consisting of an upregulated and downregulated set of genes, two ranking scores were obtained separately, and the down-regulated associated signature score was subtracted from the up-regulated generated signature score. A contour plot was added on top of the tSNE space, which takes into account only those cells that have a signature score above the mean to further emphasis the region of highly scored cells.
Network construction
Networks were generated using Cytoscape version 3.2.142. The network model is based on coupling in vitro RNAseq gene expression data of naïve CD8+ T cells from KO (Prdm1 or c-Maf) and WT controls stimulated in the presence of IL-27 and previously published ChIP-seq data for c-Maf and predicted Prdm1 binding sites by motif scan. More specifically, differentially expressed genes between WT control and KO were defined using the function that fits multiple linear models from the Bioconductor package limma in R27 with FDR<0.05. We used published c-Maf ChIP-seq data19 and and Prdm1 ChiP-seq data16. In addition, potential Prdm1 binding sites were detected using FIMO (MEME suite - http://meme-suite.org/doc/fimo.html). Association to gene promoters was based on the following thresholds (upstream=5000, downstream=500 of TSS) and the overlap with the co-inhibitory module was found to be significant (p-value= 0.009 hyper geometric, background of 20,000 genes). In the network presentation, we visualize all the genes that are part of the IL-27 inhibitory module (Extended Data Fig. 6e and Fig. 4a).
Extended Data
Extended Data Figure 1. CyTOF analysis of co-inhibitory and co-stimulatory receptor co-expression in TILs.
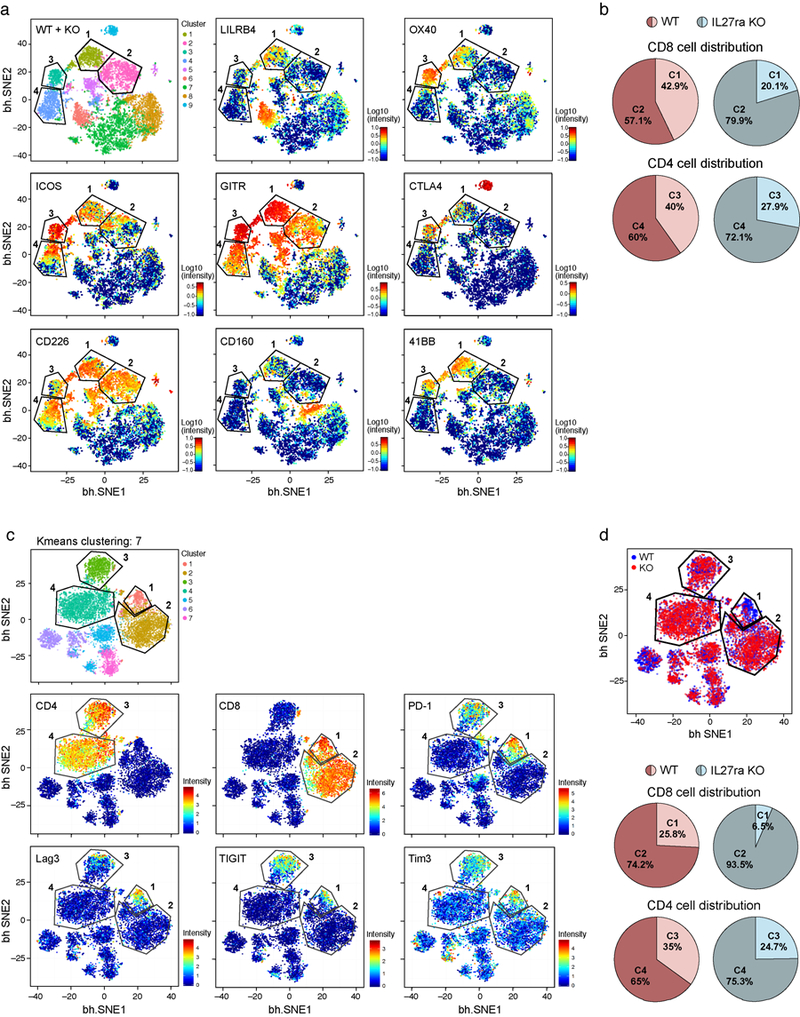
a) TILs were harvested from B16F10 melanoma tumor-bearing WT and IL27ra KO mice from Fig. 1b and analyzed using CyTOF (5000 cells from each). CyTOF data were analyzed using vi-SNE. Applying k-means clustering with (k=9) on the CyTOF data resulted in clear distinction between clusters 1, 2, 3 and 4. Polygons indicating clusters 1, 2 (in CD8+ T cells), 3 and 4 (in CD4+ T cells) are shown. Individual panels show expression of the indicated markers. b) Pie charts show the distribution of WT or IL27ra KO CD8+ and CD4+ TILs in clusters 1 and 2 (C1 and C2) of CD8+ TILs and clusters 3 and 4 (C3 and C4) of CD4+ TILs as defined in Fig. 1d. c) Independent data of WT and IL27ra KO TILs samples from that shown in Fig. 1 (5000 cells from each). Applying k-means clustering with (k=7) on the CyTOF data resulted in clear distinction between clusters 1, 2, 3 and 4. Polygons indicating clusters 1, 2 (in CD8+ T cells), 3 and 4 (in CD4+ T cells) are shown. d) vi-SNE plot highlighting the distribution of cells from WT (blue) and IL27ra KO (red) in CD8+ TILs clusters 1 and 2 and CD4+ TILs clusters 3 and 4. Pie charts show the distribution of WT or IL27ra KO CD8+ and CD4+ TILs in each cluster.
Extended Data Figure 2. IL-27 induces multiple co-inhibitory receptors on CD4+ and CD8+ T cells.
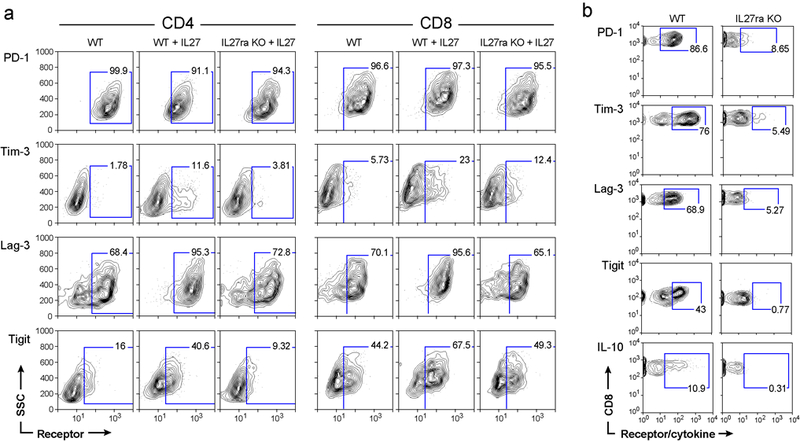
a) Naïve T cells from WT or IL27ra KO mice were stimulated in vitro with anti-CD3/CD28 in the presence or absence of IL-27. Expression of co-inhibitory receptors was determined by flow cytometry. Representative data of 3 biologically independent experiments are shown. b) Expression of PD-1, Tim-3, Lag-3, TIGIT, and IL-10 on CD8+ TILs obtained from WT and IL27ra KO mice bearing B16F10 melanoma was determined by flow cytometry. Thy1.1-IL-10 reporter mice crossed with WT and IL27ra KO mice were used for IL-10 expression analysis. Representative data of 3 biologically independent experiments are shown.
Extended Data Figure 3. Single-cell RNA-seq expression analysis of WT and IL27ra KO TILs.
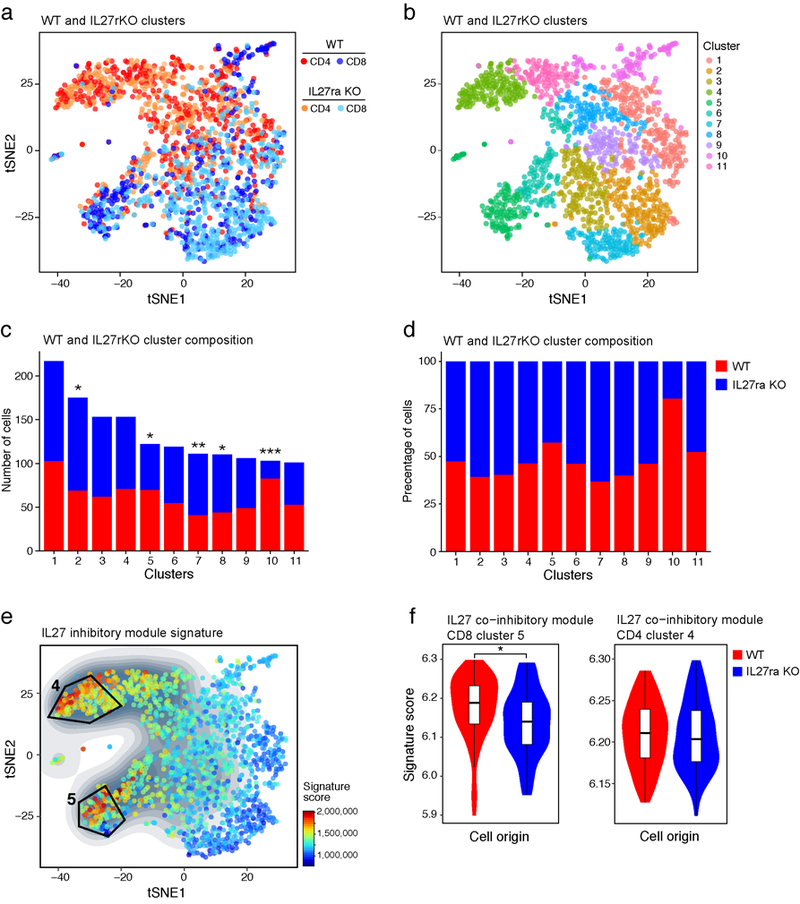
a) TILs were harvested from B16F10 melanoma tumor-bearing WT (707 and 825 for CD4+ and CD8+ respectively) and IL27ra KO (376 and 394 for CD4+ and CD8+ respectively) mice as in Fig. 1e. t-SNE plot shows the presence of WT and IL27ra KO CD4+ and CD8+ TILs as indicated. b) Clustering using the Louvain-Jaccard method (40 nearest neighbors and 13 principal components25). c) The composition of each cluster in terms of total number (c) and percentage (d) of WT (red) and IL27ra KO (blue) cells. P-values (*p-value<0.05, **p-value<0.01, ***p-value<0.001) were calculated using one sample t-test. e) Projection of the IL-27 co-inhibitory module signature on the single-cell RNA-seq data. The contour plot marks the region of highly expressing cells by taking into account only those cells that have an expression value above the mean. f) Violin and box plots displaying the distribution of the IL-27 co-inhibitory module signature score compared between WT (72 and 98 for CD4+ and CD8+ respectively) and IL27ra KO (85 and 77 for CD4+ and CD8+ respectively) cells in clusters 4 and 5 (CD4+ and CD8+ respectively, *p-value=0.01, one-sided t-test. The lower and upper hinges in the boxplot correspond to the first and third quartiles and the horizontal line corresponds to the median).
Extended Data Figure 4. Overlap of the IL-27-induced gene program with signatures from four states of T cell impairment/tolerance/dysfunction.
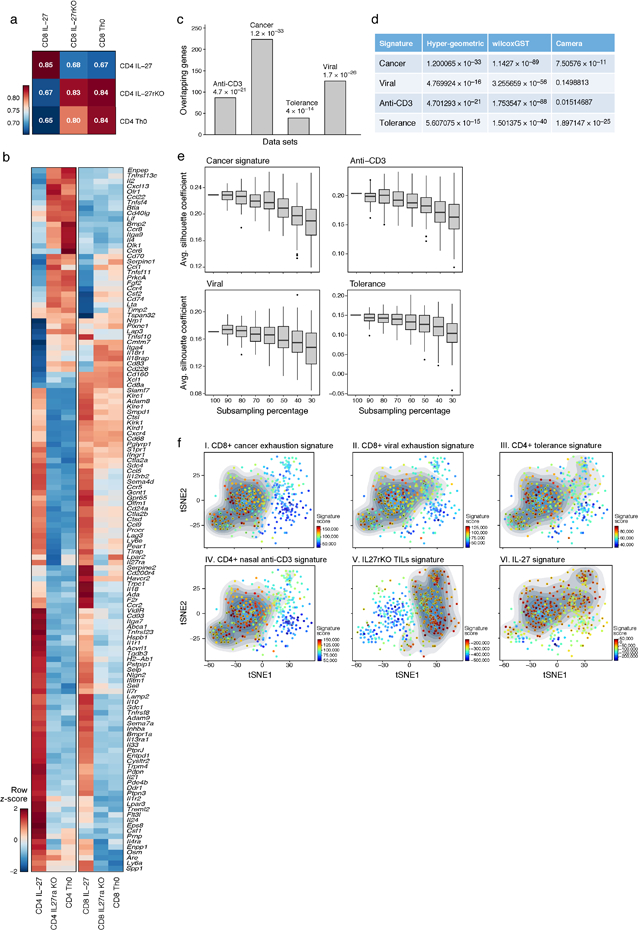
a) Pearson correlation between WT CD4+ and CD8+ T cells for the 1,201 genes that were differentially expressed between WT CD4+ T cells stimulated in the presence or absence of IL-27 (FDR<0.05). b) Expression profile of 118 differentially expressed genes (from (a)) encoding cell surface receptors and cytokines are shown as a heatmap. c) The IL-27-induced gene program (1,201 genes) was compared to T cell signatures obtained from four states of T cell non-responsiveness. Number of overlapping genes between the IL-27 gene program and each signature is depicted. P values (***p < 0.001) were determined by hypergeometric test: Nasal anti-CD3 – 4.7×10⁻²¹, Cancer – 1.2 ×10⁻³³, antigen-specific tolerance – 4 ×10⁻¹⁴ and Viral exhaustion – 1.7 ×10⁻²⁶. d) p-value statistics for the significance of the overlap between the IL-27-induced gene program (1,201) and genes induced in other states of T cell non-responsiveness using wilcoxGST and camera. e) Gene signatures from (c) were sub-sampled and projected onto the CD8+ single-cell TILs data. Changes were quantified by randomly selecting decreasing subsets of genes from each signature and calculating the average silhouette width of cells that scored high for the different generated signatures based on Euclidian distance between the principal component values used to generate the tSNE plot. The lower and upper hinges in the boxplot correspond to the first and third quartiles and the horizontal line corresponds to the median (Methods). f) Panels I-V, tSNE plots of the 588 CD8+ single-cell TILs (dots) harvested from WT mice bearing B16F10 melanoma tumor. Cells are colored in each panel by their signature score. The score reflects the relative average expression of the genes in the overlap of the IL-27 gene signature with the signatures for each of the indicated states of T cell non-responsiveness. Panel VI is a projection of a signature of the differentially expressed genes between CD8+ TILs from WT and IL27ra KO mice bearing B16 melanomas (Methods). The contour plot marks the region of highly scored cells by taking into account only those cells that have a signature score above the mean score. Cells that had a statistically significant score (adjusted p-value<0.05) were marked by ‘+’ (Methods).
Extended Data Figure 5. Characterization of the role of Pdpn and Procr in CD8+ TILs.
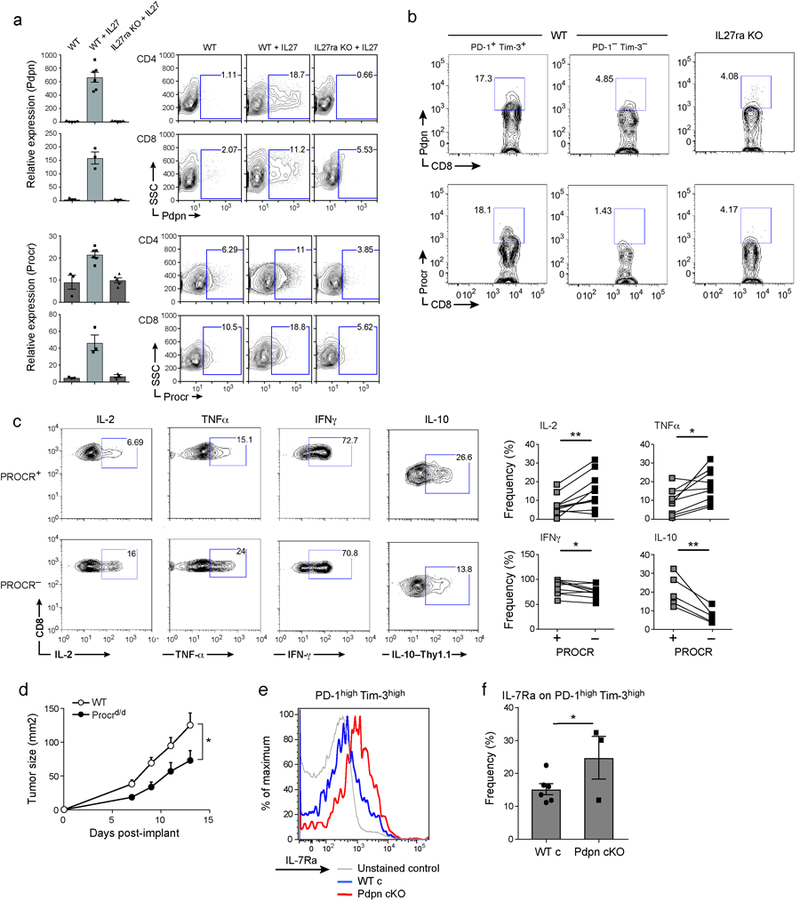
a) Pdpn and Procr protein and mRNA expression was determined in T cells from WT and IL27ra KO stimulated with anti-CD3/CD28 in the presence or absence of IL-27. CD4+ cells were analyzed at 96hr and CD8+ cells at 72hr. Data are representative flow cytometry and qPCR data from biologically independent animals. mean + s.e.m is shown. b) Representative flow cytometry data of 3 independent experiments showing Pdpn and Procr expression in PD-1+Tim-3+ CD8+ and PD-1-Tim-3- CD8+ TILs obtained from WT and IL27ra KO mice bearing B16F10 melanoma. c) TILs from WT mice bearing B16F10 melanoma were stimulated with PMA and Ionomycin. Cytokine production in Procr+ or Procr- CD8+ TILs is shown. Thy1.1-IL-10 reporter mice were used for IL-10 expression analysis. Data are from biologically independent animals. mean + s.e.m is shown. *p < 0.05; **p < 0.01, paired t-test. d) 5×10⁵ CD8+ T cells from wild type or Procrd/d mice were transferred along with 1×10⁶ wild type CD4+ T cells to Rag1 KO mice (N=5). On day 2, 5×10⁵ B16F10 cells were implanted. Mean tumor size + s.e.m is shown. *P<0.05, repeated measures ANOVA, Sidak’s multiple comparisons test. e) TILs were obtained from WT and Pdpn cKO mice bearing B16F10 melanoma and stained for the expression of IL-7Ra. Representative flow cytometry data from 3 independent animals. f) Summary data of IL-7Ra expression are from biologically independent animals. mean + s.e.m is shown. *p < 0.05, one-sided t-test.
Extended Data Figure 6. Prdm1 is a candidate regulator of the co-inhibitory module.
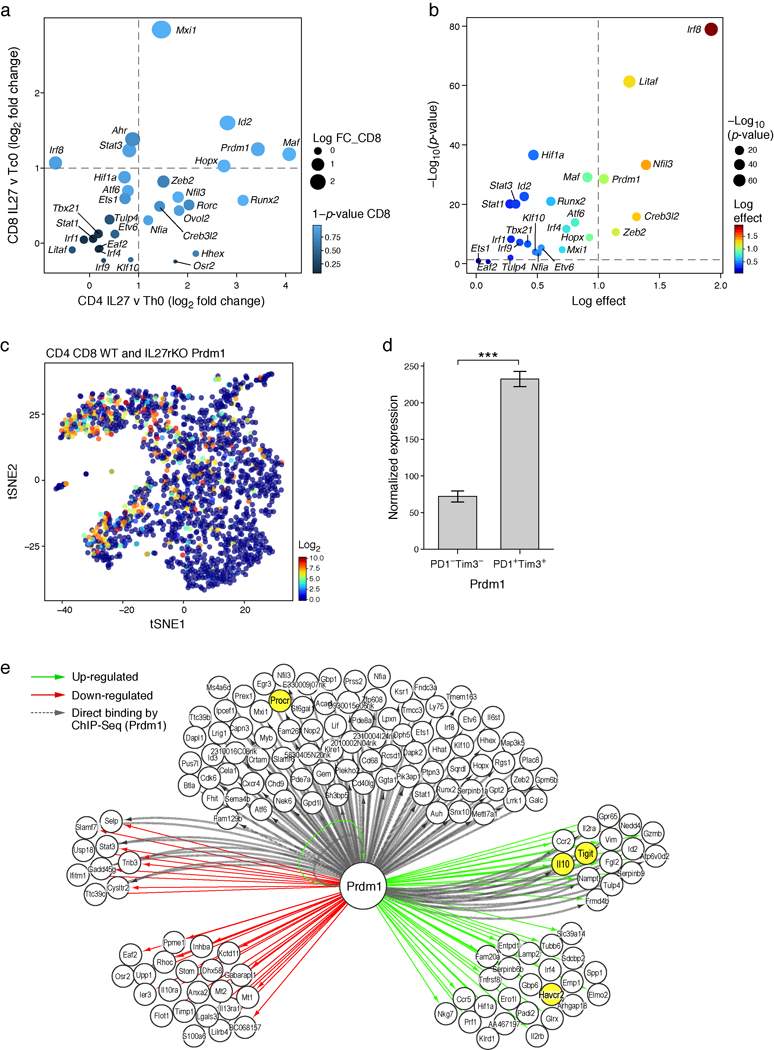
a) Log2 fold change RNA levels between naïve CD4+ or CD8+ T cells simulated with or without IL-27. Data are from two independent experiments. Shown are transcription factors that are part of the IL-27 co-inhibitory module (Differentially expressed transcription factors were annotated as genes with FDR-corrected ANOVA <0.05). b) Transcription factors that are both in the IL-27 co-inhibitory module and are also overexpressed in clusters 4 and 5 in the single-cell data (clusters that were enriched for the IL-27 signature, Extended data Fig. 3e,f). Differentially expressed genes between clusters 4/5 and the rest of the clusters were determined using binomcount.test (binomial distribution, Methods). Log effect corresponds to log proportion of expressing cells and p-value is calculated by the probability of finding n or more cells positive for the gene in clusters 4/5 given the fraction in the rest of the clusters. c) tSNE plot of Fig. 1e. showing the expression of Prdm1 in WT (707 and 825 for CD4+ and CD8+, respectively) and IL27ra KO (376 and 394 for CD4+ and CD8+, respectively) cells. d) Normalized RNA expression levels of Prdm1 in PD-1-Tim-3- (n=3) and PD-1+Tim-3+ (n=3) CD8+ TILs (mean + s.e. is shown, ***p = 0.0004, two-sided t-test). e) Network model based on RNAseq gene expression data of naïve CD8+ T cells from Prdm1fl/fl (WT) or CD4crePrdm1fl/fl (Prdm1 cKO) mice stimulated in the presence of IL-27 and actual binding events (ChIPseq) data for Prdm119. Green arrows designate genes up-regulated by Prdm1, red arrows designate genes down-regulated by Prdm1, and dashed gray arrows mark binding events.
Extended Data Figure 7. Genomic tracks surrounding the co-inhibitory molecules.
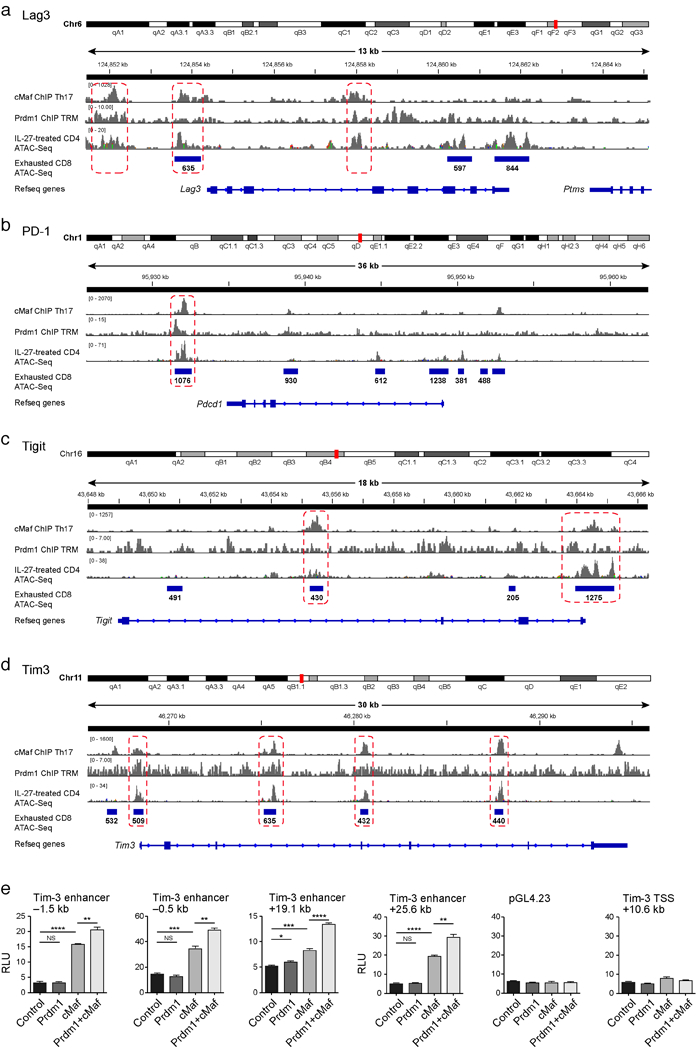
Lag3 (a), Pd-1 (b), Tigit (c) and Tim-3 (d) with overlay of Chipseq data of Prdm116 and c-Maf19 and ATACseq data of naïve CD4+ cells induced with IL27 for 72h and ATACseq data of CD8+ T cells 27 days following chronic viral infection22. Regions of binding sites common to both Prdm1 and c-Maf are indicated by the dotted rectangles. e) Luciferase activity in 293T cells transfected with pGL4.23 luciferase reporters for depicted enhancers of Tim-3 together with empty vector (control), constructs encoding Prdm1, c-Maf, or both. Firefly luciferase activity was measured 48h after transfection and is presented relative to constitutive Renilla luciferase activity.
Extended Data Figure 8. Immune characterization of Prdm1 cKO, cMaf cKO, and Prdm1/c-Maf cDKO before and after tumor challenge.
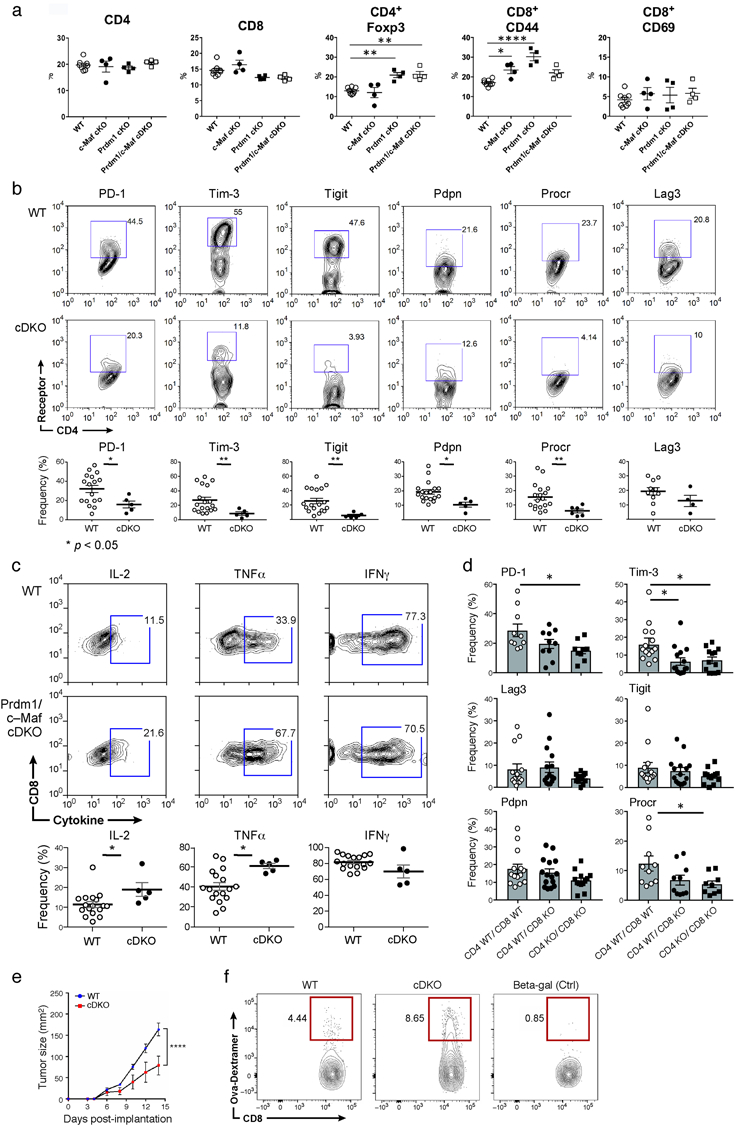
a) Analysis of steady-state immune system in WT, c-Maf cKO, Prdm1 cKO, and Prdm1/c-Maf cDKO. Summary data for CD4, CD8, Foxp3, CD44, CD62L, and CD69 expression in spleen from WT, c-Maf cKO, Prdm1 cKO andPrdm1/c-Maf cDKO mice. Data are from biologically independent animals. mean + s.e.m is shown. *p < 0.05; **p <0.01; ****p < 0.0001, one-way ANOVA and Tukey’s multiple comparisons test. b) co-inhibitory receptor expression in CD4+ TILs from Prdm1/c-Maf cDKO mice. Top panels, representative flow cytometry data from 3 independent experiments for TILs from WT and Prdm1/c-Maf cDKO stained for PD-1, Tim-3, TIGIT, Pdpn, and Procr expression. Bottom panels show summary data. Data are from biologically independent animals. mean + s.e.m is shown *p < 0.05, two-sided t-test. c) Top panels, representative flow cytometry data from 3 independent experiments showing cytokine production from CD8+ TILs from WT and cDKO bearing B16F10 melanoma. Bottom panels, summary data. Data are from biologically independent animals. mean + s.e.m is shown. *p < 0.05, two-sided t-test. d) Co-inhibitory receptor expression on CD8+ TILs sorted from B16-OVA-bearing Rag1 KO mice that were transferred with Prdm1/c-Maf cDKO (n=4) or wild type (n=4) CD4+ and CD8+ T cells as indicated. Data are from biologically independent animals. mean + s.e.m is shown. *P<0.05, one-way ANOVA and Tukey’s multiple comparisons test. e) Rag1 KO mice were transferred with either wildtype or cDKO CD4+ and CD8+ (2:1 CD4:CD8 ratio) followed by subcutaneous injection of MC38-OVA. Mean tumor size + s.e.m is shown. ****P<0.0001, repeated measures ANOVA, Sidak’s multiple comparisons test. On Day 14 post tumor implantation mice were sacrificed and TILs, spleen and draining Lymph nodes were harvested. f) The frequency of antigen specific CD8+ T cells in the dLN of mice in (e).
Extended Data Figure 9. Examination of additive and non-additive (synergistic) effects of Prdm1 and c-Maf.
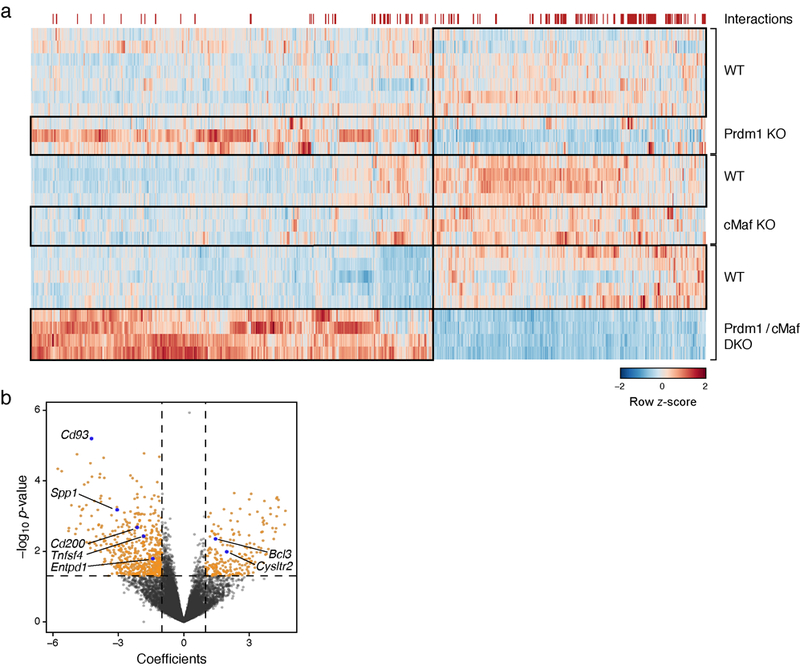
a) A Heatmap showing all 940 DE genes between WT (n=5) and cDKO (Prdm1/c-Maf, n=4) and their expression in single KO (Prdm1 control n=7, Prdm1 KO n=3, cMaf control n=4 and cMaf KO n=3) mice. The red markings on the top of the heatmap indicate genes on whose expression the two knockouts have a statistically significant (p-value<0.05) non-additive effect in the cDKO (149 out of 940 DE genes). b) Volcano plot of the same analysis as in (a) for global gene expression. Genes whose expression in the two single knockouts have a statistically significant (p-value<0.05) non-additive effect in the cDKO (1144 out of 12,906 genes) and had abs (coefficient)>1 (779 out of 1144) are shown in orange.
Extended Data Figure 10. Comparison of gene expression between Prdm1/c-Maf cDKO TILs and CD8+ TILs populations from wild type mice.
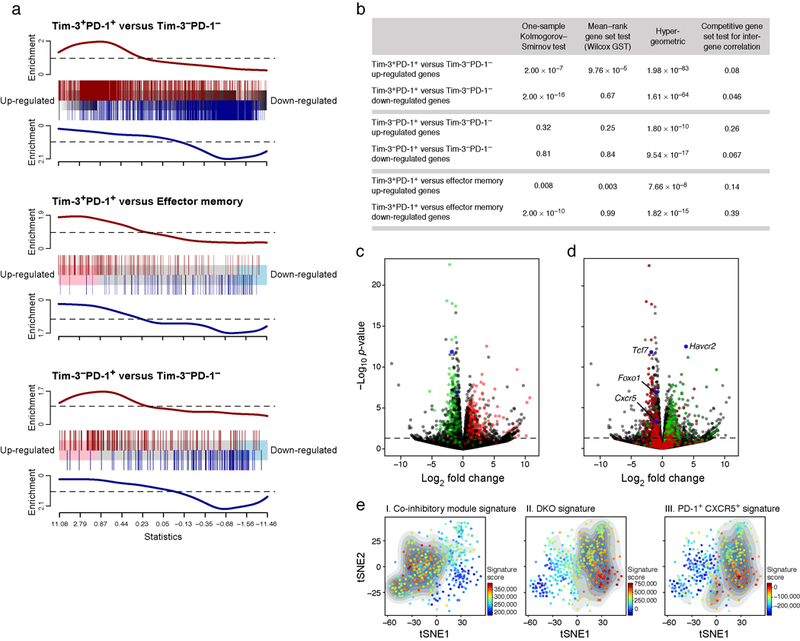
a) Barcode enrichment plot displaying two gene sets in a ranked gene list. The ranked gene list was defined as fold change in gene expression between Prdm1/c-Maf cDKO and WT CD8+ TILs. The three gene sets consist of differentially expressed genes between: PD-1+Tim-3+ CD8+ (DP, n=3) and PD-1-Tim-3- CD8+ (DN, n=3) TILs, PD-1+Tim-3+ CD8+ (DP) TILs and Memory CD8+ (n=3), and PD-1+Tim-3- CD8+ (SP, n=3) and PD-1-Tim-3- CD8+ (DN) TILs. b) This analysis was followed by four statistical tests (one-sample Kolmogorov-Smirnov test, mean-rank gene set test (wilcoxGST), hypergeometric, and competitive gene set test accounting for inter-gene correlation) for enrichment of these signatures in the cDKO expression profile. c) WT versus cDKO volcano plot. Green indicates genes that were up-regulated in the PD-1-Tim-3- CD8+ (DN) TILs and red indicates genes that were up-regulated in the PD-1+Tim-3+ CD8+ (DP) TILs. d) WT versus cDKO volcano plot. Red indicates genes that were up-regulated in PD-1+CXCR5+CD8+ T cells and green indicates genes that were up-regulated in PD-1+CXCR5-CD8+ T cells in chronic LCMV infection23. e). A tSNE plot of the 588 CD8+ TILs harvested from WT mice bearing B16F10 melanoma tumors, colored by the relative signature score for the co-inhibitory module (272 genes, Supplementary Information Table 2), the cDKO signature (shown in (g)), and the PD-1+CXCR5+CD8+ T cell signature from chronic virus infection23. The contour plot marks the region of highly scored cells by taking into account only those cells that have a signature score above the mean.
Supplementary Material
Acknowledgements
We thank Mary Collins for insightful discussions, Deneen Kozoriz, Junrong Xia, and Zoujia Chen for technical advice, Samantha Riesenfeld for computational advice, Nicole Paul and Josh Keegan for CyTOF, and Leslie Gaffney for artwork. This work was supported by grants from the National Institutes of Health, the American Cancer Society, the Melanoma Research Alliance, the Klarman Cell Observatory at the Broad Institute, and the Howard Hughes Medical Institute.
Footnotes
Data availability
Sequence data that support the findings of this study have been deposited in GEO with the accession codes XXX
Conflict of Interest
A.C.A. is a member of the SAB for Potenza Therapeutics and Tizona Therapeutics. V.K.K. has an ownership interest and is a member of the SAB for Potenza Therapeutics and Tizona Therapeutics. A.C.A.’s and V.K.K.’s interests were reviewed and managed by the Brigham and Women’s Hospital and Partners Healthcare in accordance with their conflict of interest policies. A.R. is an SAB member for Thermo Fisher and Syros Pharmaceuticals and is a consultant for Driver Group.
References
- 1.Wherry EJ & Kurachi M Molecular and cellular insights into T cell exhaustion. Nature reviews. Immunology 15, 486–499, 10.1038/nri3862 (2015). [DOI] [PMC free article] [PubMed] [Google Scholar]
- 2.Anderson AC, Joller N & Kuchroo VK Lag-3, Tim-3, and TIGIT: Co-inhibitory Receptors with Specialized Functions in Immune Regulation. Immunity 44, 989–1004, 10.1016/j.immuni.2016.05.001 (2016). [DOI] [PMC free article] [PubMed] [Google Scholar]
- 3.Singer M et al. A Distinct Gene Module for Dysfunction Uncoupled from Activation in Tumor-Infiltrating T Cells. Cell 166, 1500–1511 e1509, 10.1016/j.cell.2016.08.052 (2016). [DOI] [PMC free article] [PubMed] [Google Scholar]
- 4.Maaten L HG Visualizing Data using t-SNE. Journal of Machine Learning Research, 2579–2605 (2008). [Google Scholar]
- 5.Fitzgerald DC et al. Suppression of autoimmune inflammation of the central nervous system by interleukin 10 secreted by interleukin 27-stimulated T cells. Nature immunology 8, 1372–1379, 10.1038/ni1540 (2007). [DOI] [PubMed] [Google Scholar]
- 6.Awasthi A et al. A dominant function for interleukin 27 in generating interleukin 10-producing anti-inflammatory T cells. Nature immunology 8, 1380–1389, 10.1038/ni1541 (2007). [DOI] [PubMed] [Google Scholar]
- 7.Stumhofer JS et al. Interleukins 27 and 6 induce STAT3-mediated T cell production of interleukin 10. Nature immunology 8, 1363–1371, 10.1038/ni1537 (2007). [DOI] [PubMed] [Google Scholar]
- 8.Zhu C et al. An IL-27/NFIL3 signalling axis drives Tim-3 and IL-10 expression and T-cell dysfunction. Nature communications 6, 6072, 10.1038/ncomms7072 (2015). [DOI] [PMC free article] [PubMed] [Google Scholar]
- 9.Hirahara K et al. Interleukin-27 priming of T cells controls IL-17 production in trans via induction of the ligand PD-L1. Immunity 36, 1017–1030, 10.1016/j.immuni.2012.03.024 (2012). [DOI] [PMC free article] [PubMed] [Google Scholar]
- 10.Doering TA et al. Network analysis reveals centrally connected genes and pathways involved in CD8+ T cell exhaustion versus memory. Immunity 37, 1130–1144, 10.1016/j.immuni.2012.08.021 (2012). [DOI] [PMC free article] [PubMed] [Google Scholar]
- 11.Burton BR et al. Sequential transcriptional changes dictate safe and effective antigen-specific immunotherapy. Nature communications 5, 4741, 10.1038/ncomms5741 (2014). [DOI] [PMC free article] [PubMed] [Google Scholar]
- 12.Mayo L et al. IL-10-dependent Tr1 cells attenuate astrocyte activation and ameliorate chronic central nervous system inflammation. Brain, 10.1093/brain/aww113 (2016). [DOI] [PMC free article] [PubMed] [Google Scholar]
- 13.Castellino FJ et al. Mice with a severe deficiency of the endothelial protein C receptor gene develop, survive, and reproduce normally, and do not present with enhanced arterial thrombosis after challenge. Thrombosis and haemostasis 88, 462–472, 10.1267/THRO88030462 (2002). [DOI] [PubMed] [Google Scholar]
- 14.Sakuishi K et al. Targeting Tim-3 and PD-1 pathways to reverse T cell exhaustion and restore anti-tumor immunity. The Journal of experimental medicine 207, 2187–2194, 10.1084/jem.20100643 (2010). [DOI] [PMC free article] [PubMed] [Google Scholar]
- 15.Peters A et al. Podoplanin negatively regulates CD4+ effector T cell responses. The Journal of clinical investigation 125, 129–140, 10.1172/JCI74685 (2015). [DOI] [PMC free article] [PubMed] [Google Scholar]
- 16.Mackay LK et al. Hobit and Blimp1 instruct a universal transcriptional program of tissue residency in lymphocytes. Science 352, 459–463, 10.1126/science.aad2035 (2016). [DOI] [PubMed] [Google Scholar]
- 17.Apetoh L et al. The aryl hydrocarbon receptor interacts with c-Maf to promote the differentiation of type 1 regulatory T cells induced by IL-27. Nature immunology 11, 854–861, 10.1038/ni.1912 (2010). [DOI] [PMC free article] [PubMed] [Google Scholar]
- 18.Giordano M et al. Molecular profiling of CD8 T cells in autochthonous melanoma identifies Maf as driver of exhaustion. EMBO J 34, 2042–2058, 10.15252/embj.201490786 (2015). [DOI] [PMC free article] [PubMed] [Google Scholar]
- 19.Ciofani M et al. A validated regulatory network for Th17 cell specification. Cell 151, 289–303, 10.1016/j.cell.2012.09.016 (2012). [DOI] [PMC free article] [PubMed] [Google Scholar]
- 20.Capaldi AP et al. Structure and function of a transcriptional network activated by the MAPK Hog1. Nat Genet 40, 1300–1306, 10.1038/ng.235 (2008). [DOI] [PMC free article] [PubMed] [Google Scholar]
- 21.Karwacz K et al. Critical role of IRF1 and BATF in forming chromatin landscape during type 1 regulatory cell differentiation. Nature immunology 18, 412–421, 10.1038/ni.3683 (2017). [DOI] [PMC free article] [PubMed] [Google Scholar]
- 22.Sen DR et al. The epigenetic landscape of T cell exhaustion. Science 354, 1165–1169, 10.1126/science.aae0491 (2016). [DOI] [PMC free article] [PubMed] [Google Scholar]
- 23.Im SJ et al. Defining CD8+ T cells that provide the proliferative burst after PD-1 therapy. Nature 537, 417–421, 10.1038/nature19330 (2016). [DOI] [PMC free article] [PubMed] [Google Scholar]
- 24.Chen L & Flies DB Molecular mechanisms of T cell co-stimulation and co-inhibition. Nature reviews Immunology 13, 227–242, 10.1038/nri3405 (2013). [DOI] [PMC free article] [PubMed] [Google Scholar]
References for Method and Extended Data
- 25.Blondel VD, Guillaume JL, Lambiotte R & Lefebvre E Fast unfolding of communities in large networks. J. Stat. Mech, P10008 (2008). [Google Scholar]
- 26.Wende H et al. The transcription factor c-Maf controls touch receptor development and function. Science 335, 1373–1376, 10.1126/science.1214314 (2012). [DOI] [PubMed] [Google Scholar]
- 27.Smyth GK Linear models and empirical bayes methods for assessing differential expression in microarray experiments. Statistical applications in genetics and molecular biology 3, Article3, 10.2202/1544-6115.1027 (2004). [DOI] [PubMed] [Google Scholar]
- 28.Reich M et al. GenePattern 2.0. Nat Genet 38, 500–501, 10.1038/ng0506-500 (2006). [DOI] [PubMed] [Google Scholar]
- 29.Tirosh I et al. Dissecting the multicellular ecosystem of metastatic melanoma by single-cell RNA-seq. Science 352, 189–196, 10.1126/science.aad0501 (2016). [DOI] [PMC free article] [PubMed] [Google Scholar]
- 30.Trapnell C, Pachter L & Salzberg SL TopHat: discovering splice junctions with RNA-Seq. Bioinformatics 25, 1105–1111, 10.1093/bioinformatics/btp120 (2009). [DOI] [PMC free article] [PubMed] [Google Scholar]
- 31.Li B & Dewey CN RSEM: accurate transcript quantification from RNA-Seq data with or without a reference genome. BMC Bioinformatics 12, 323, 10.1186/1471-2105-12-323 (2011). [DOI] [PMC free article] [PubMed] [Google Scholar]
- 32.Anders S & Huber W Differential expression analysis for sequence count data. Genome Biol 11, R106, 10.1186/gb-2010-11-10-r106 (2010). [DOI] [PMC free article] [PubMed] [Google Scholar]
- 33.Kolde R (R package version 1.0.2, 2015).
- 34.Shalek AK et al. Single-cell transcriptomics reveals bimodality in expression and splicing in immune cells. Nature 498, 236–240, 10.1038/nature12172 (2013). [DOI] [PMC free article] [PubMed] [Google Scholar]
- 35.Picelli S et al. Full-length RNA-seq from single cells using Smart-seq2. Nat Protoc 9, 171–181, 10.1038/nprot.2014.006 (2014). [DOI] [PubMed] [Google Scholar]
- 36.Langmead B, Trapnell C, Pop M & Salzberg SL Ultrafast and memory-efficient alignment of short DNA sequences to the human genome. Genome Biol 10, R25, 10.1186/gb-2009-10-3-r25 (2009). [DOI] [PMC free article] [PubMed] [Google Scholar]
- 37.Shekhar K et al. Comprehensive Classification of Retinal Bipolar Neurons by Single-Cell Transcriptomics. Cell 166, 1308–1323 e1330, 10.1016/j.cell.2016.07.054 (2016). [DOI] [PMC free article] [PubMed] [Google Scholar]
- 38.Johnson WE, Li C & Rabinovic A Adjusting batch effects in microarray expression data using empirical Bayes methods. Biostatistics 8, 118–127, 10.1093/biostatistics/kxj037 (2007). [DOI] [PubMed] [Google Scholar]
- 39.Levine JH et al. Data-Driven Phenotypic Dissection of AML Reveals Progenitor-like Cells that Correlate with Prognosis. Cell 162, 184–197, 10.1016/j.cell.2015.05.047 (2015). [DOI] [PMC free article] [PubMed] [Google Scholar]
- 40.Smyth GK Limma: linear models for microarray data, 397–420 (Springer, 2005). [Google Scholar]
- 41.Davis S & Meltzer PS GEOquery: a bridge between the Gene Expression Omnibus (GEO) and BioConductor. Bioinformatics 23, 1846–1847, 10.1093/bioinformatics/btm254 (2007). [DOI] [PubMed] [Google Scholar]
- 42.Lopes CT et al. Cytoscape Web: an interactive web-based network browser. Bioinformatics 26, 2347–2348, 10.1093/bioinformatics/btq430 (2010). [DOI] [PMC free article] [PubMed] [Google Scholar]
Associated Data
This section collects any data citations, data availability statements, or supplementary materials included in this article.


