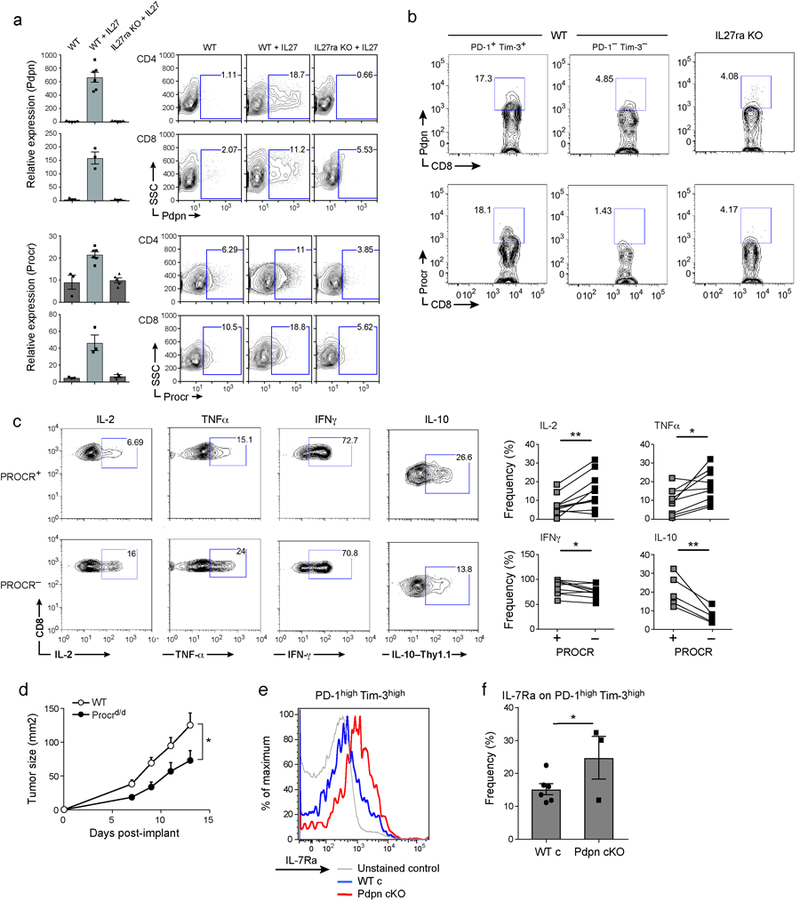
Extended Data Figure 5. Characterization of the role of Pdpn and Procr in CD8+ TILs.

a) Pdpn and Procr protein and mRNA expression was determined in T cells from WT and IL27ra KO stimulated with anti-CD3/CD28 in the presence or absence of IL-27. CD4+ cells were analyzed at 96hr and CD8+ cells at 72hr. Data are representative flow cytometry and qPCR data from biologically independent animals. mean + s.e.m is shown. b) Representative flow cytometry data of 3 independent experiments showing Pdpn and Procr expression in PD-1+Tim-3+ CD8+ and PD-1-Tim-3- CD8+ TILs obtained from WT and IL27ra KO mice bearing B16F10 melanoma. c) TILs from WT mice bearing B16F10 melanoma were stimulated with PMA and Ionomycin. Cytokine production in Procr+ or Procr- CD8+ TILs is shown. Thy1.1-IL-10 reporter mice were used for IL-10 expression analysis. Data are from biologically independent animals. mean + s.e.m is shown. *p < 0.05; **p < 0.01, paired t-test. d) 5×10⁵ CD8+ T cells from wild type or Procrd/d mice were transferred along with 1×10⁶ wild type CD4+ T cells to Rag1 KO mice (N=5). On day 2, 5×10⁵ B16F10 cells were implanted. Mean tumor size + s.e.m is shown. *P<0.05, repeated measures ANOVA, Sidak’s multiple comparisons test. e) TILs were obtained from WT and Pdpn cKO mice bearing B16F10 melanoma and stained for the expression of IL-7Ra. Representative flow cytometry data from 3 independent animals. f) Summary data of IL-7Ra expression are from biologically independent animals. mean + s.e.m is shown. *p < 0.05, one-sided t-test.
