

Abstract
Targeting mRNAs via seed region pairing is the canonical mechanism by which microRNAs (miRNAs) regulate cellular functions and disease processes. Emerging evidence suggests miRNAs might also act through other mechanisms. miRNA isomers that contain identical seed region sequences, such as miR-29a and miR-29b, provide naturally occurring, informative models for identifying those miRNA effects that are independent of seed region pairing. miR-29a and miR-29b are both expressed in HeLa cells, and miR-29b has been reported to localize to the nucleus in early mitosis because of unique nucleotide sequences on its 3′ end. Here, we sought to better understand the mechanism of miR-29b nuclear localization and its function in cell division. We hypothesized that its nuclear localization may be facilitated by protein–miRNA interactions unique to miR-29b. Specific blockade of miR-29b resulted in striking nuclear irregularities not observed following miR-29a blockade. We also observed that miR-29b, but not miR-29a, is enriched in the nucleus and perinuclear clusters during mitosis. Targeted proteomic analysis of affinity-purified samples identified several proteins interacting with synthetic oligonucleotides mimicking miR-29b, but these proteins did not interact with miR-29a. One of these proteins, ADP/ATP translocase 2 (ANT2), known to be involved in mitotic spindle formation, colocalized with miR-29b in perinuclear clusters independently of Argonaute 2. Of note, ANT2 knockdown resulted in nuclear irregularities similar to those observed following miR-29b blockade and prevented nuclear uptake of endogenous miR-29b. Our findings reveal that miR-29 regulates nuclear morphology during mitosis and that this critical function is unique to the miR-29b isoform.
Keywords: microRNA (miRNA), microRNA mechanism, proteomics, mitosis, nuclear organization, ADP/ATP translocase 2, nuclei, ribonucleoprotein
Introduction
MicroRNAs (miRNAs)3 regulate numerous cellular functions and disease processes. The most well-established mechanism mediating the action of miRNAs is that miRNAs reduce target mRNA stability or repress protein translation via interactions with argonautes and other microribonucleoproteins (miRNPs) within the miRNA-induced silencing complex (1–3). The binding of miRNAs to target mRNAs depends on base pairing of the seed region, which includes nucleotides 2–7 or 2–8 at the 5′ end of miRNA.
Emerging evidence suggests that miRNAs might act through unconventional mechanisms independent of seed region pairing with mRNA in some cases. For example, some miRNAs may be involved in the regulation of transcriptional activity or have been found in the nucleus (4–6). Application of cross-linking and loop formation techniques identified many possible miRNA–mRNA interactions that are independent of seed region pairing (7).
miRNA isomers that contain identical seed region sequences, such as miR-29a and miR-29b, provide natural, informative models for identifying miRNA effects independent of seed region pairing. The seed region sequences of miR-29a and miR-29b are identical, and thus predicted mRNA targets are shared (Targetscan) (8), yet miR-29b expression was correlated with expression of genes related to DNA transcription and RNA metabolism in a study of leukemia, whereas miR-29a was not (9). Moreover, miR-29a, similar to most miRNAs, is enriched in the cytoplasm, whereas a significant amount of mature miR-29b is found in the nucleus based on imaging and biochemical studies (4).
In the present study, we identified an effect of miR-29b on nuclear morphology during cell division that was not shared by miR-29a. Further, we identified a protein that interacted with miR-29b, but not miR-29a, and is involved with both nuclear morphology in cell division and nuclear localization of miR-29b.
Results
Suppression of miR-29b causes irregularities in nuclear morphology
We examined the effect of blocking miR-29a or miR-29b on nuclear morphology in HeLa cells 24 h after release from a double synchronization. The sequences of miR-29a and miR-29b differ by five nucleotides outside of the seed region, which allowed the design of anti-miRs specific for each isomer. Anti–miR-29b transfection induced large irregularly shaped nuclei, including multinucleated cells, nuclear lobulation, or rings of small amounts of nuclear material (Fig. 1A), in nearly 12% of the cells (Fig. 1B). Remarkably, the nuclear irregularities occurred far more frequently in cells transfected with anti–miR-29b than in cells transfected with anti–miR-29a or a scrambled control anti-miR (Fig. 1, A and B). It is unlikely that all cells were in cell cycle stages that permit the manifestation of irregular nuclei. The percentage of cells in appropriate cell cycle stages that exhibit the observed nuclear irregularities, therefore, was likely greater than 12%.
Figure 1.

Blockade of miR-29b, but not miR-29a, resulted in irregular nuclear morphology. HeLa cells were transfected with scrambled anti-miR (anti–miR-ctrl), anti–miR-29a, or anti–miR-29b during a double synchronization protocol. The cells were fixed and stained 24 h after release from the second thymidine block. A, knockdown of miR-29b, but not miR-29a, induced irregular nuclear morphology. The cells with enlarged nuclei from the anti–miR-29b group included large multinucleate cells (Multi), as well as cells with lobulated (Lob.) or ringed (Ring) nuclear material. Scale bars are 50 μm in length for images with multiple cells and 25 μm in length for single cell images showing nuclear morphology phenotypes. B, percentage of cells with irregular nuclei in the anti–miR-29b group was much larger in the anti–miR-29a or anti–miR-Ctrl group (n = 3/group). *, p < 0.05 versus scrambled anti–miR-Ctrl. C, miR-29b clusters (green) were observed around a perinuclear cluster of γ-tubulin in a cell in early mitosis. D, miR-29a was present throughout the cell and was not colocalized with the perinuclear cluster of γ-tubulin. In situ hybridization for miR-29b or miR-29a was performed in combination with immunocytochemistry for γ-tubulin in fixed HeLa cells. Scale bars represent 10 μm for Fig. 1 (C and D). Quantification of miR-29b clustering in a population of HeLa cells is presented in Fig. 3. Ctrl, control.
The distinct effects of miR-29a and miR-29b on nuclear morphology were associated with distinct subcellular localization of the isomers. miR-29b was colocalized with centrosomal protein γ-tubulin when γ-tubulin formed a single cluster just outside of the nucleus at a phase of the cell cycle when the nucleus is still intact (Fig. 1C). Controls demonstrating anti-miR and probe specificity for in situ hybridization experiments are displayed in Fig. S1.
The perinuclear cluster could be the microtubule-organizing center (reviewed in Ref. 10). In contrast, miR-29a was detected throughout the cell as one would expect for a typical miRNA. It did not form distinct clusters and was not colocalized with γ-tubulin in perinuclear clusters (Fig. 1D).
Biotinylated miR-29 duplexes retained the function of miR-29
We developed an approach that utilized tagged, synthetic miRNA duplexes, rapid cryopreservation, and proteomics to identify miRNPs that interacted specifically with miR-29a or miR-29b in HeLa cells. Synthetic miR-29a or miR-29b duplexes tagged with biotin at their 3′ end (Fig. S2) retained some ability to knock down known target mRNAs of miR-29 (7, 11, 12) and pull out argonaute 2, although the pullout of argonaute 2 was not efficient (Fig. S3), similar to previous findings with 3′-biotinylated miRNA duplexes (13–15). The inefficiency of the interaction of the tagged duplexes with argonaute 2 was not important for the present study because the goal was to identify novel proteins interacting specifically with miR-29b that do not participate in conventional seed region pairing and mRNA silencing.
Several proteins interacted with miR-29b, but not miR-29a
Proteins interacting with biotinylated miR-29a, miR-29b, or a scrambled oligonucleotide were affinity-purified from HeLa cells following rapid cryopreservation and identified by label-free MS analysis (see “Experimental procedures”). Stringent analysis criteria applied to the list of identified proteins revealed 21 proteins uniquely interacting with biotinylated miR-29b (Table 1), 135 proteins uniquely interacting with biotinylated miR-29a, and 38 proteins interacting with both oligonucleotides. A complete list of all identified proteins with links to Uniprot and the KEGG (http://www.genome.jp/kegg)4 pathways they fall within can be found in the supporting data set, and their relationship to argonaute-interacting proteins are shown in Figs. S4–S6.
Table 1.
Proteins interacting with miR-29b, but not miR-29a, in HeLa cells
The criteria for protein identification are described in the “Methods” section in the supporting information. Additional information for each of these proteins is available in the data set in the supporting information.
| Uniprot Name | Uniprot Accession | HGNC gene symbol | HGNC gene name | Scan count (mean of n = 3) |
|---|---|---|---|---|
| ADT2 (ANT2) | P05141 | SLC25A5 | Solute carrier family 25 (mitochondrial carrier; adenine nucleotide translocator), member 5 | 10 |
| ADT3 | P12236 | SLC25A6 | Solute carrier family 25 (mitochondrial carrier; adenine nucleotide translocator), member 6 | 6 |
| CAPZB | P47756 | CAPZB | Capping protein (actin filament) muscle Z-line, β | 3 |
| CAZA2 | P47755 | CAPZA2 | Capping protein (actin filament) muscle Z-line, α2 | 5 |
| CBX1 | P83916 | CBX1 | Chromobox homolog 1 | 8 |
| CI114 | Q5T280 | C9orf114 | Chromosome 9 open reading frame 114 | 4 |
| DNJA3 | Q96EY1 | DNAJ3 | DnaJ (Hsp40) homolog, subfamily A, member 3 | 5 |
| EBP2 | Q99848 | EBNA1BP2 | EBNA1-binding protein 2 | 9 |
| H1X | Q92522 | H1FX | H1 histone family, member X | 3 |
| NUP37 | Q8NFH4 | NUP37 | Nucleoporin 37 kDa | 3 |
| PRP8 | Q6P2Q9 | PRPF8 | PRP8 pre-mRNA processing factor 8 homolog | 4 |
| RAB7A | P51149 | RAB7a | RAB7A, member RAS oncogene family | 4 |
| RL21 | P46778 | RPL21 | Ribosomal protein L21 | 7 |
| ROAA | Q99729 | HNRNPAB | Heterogeneous nuclear ribonucleoprotein A/B | 6 |
| RPAC2 | Q9Y2S0 | POLR1D | Polymerase (RNA) I polypeptide D, 16 kDa | 7 |
| RPB3 | P19387 | POLR2C | Polymerase (RNA) II (DNA directed) polypeptide C, 33 kDa | 3 |
| RS17 | P08708 | RPS17 | Ribosomal protein S17 | 4 |
| SSRP1 | Q08945 | SSRP1 | Structure specific recognition protein 1 | 3 |
| TAF6 | P49848 | TAF6 | TAF6 RNA polymerase II, TATA box-binding protein (TBP)-associated factor, 80 kDa | 2 |
| TBP | P20226 | TBP | TATA box-binding protein | 3 |
| TRRAP | Q9Y4A5 | TRRAP | Transformation/transcription domain-associated protein | 3 |
miR-29b interaction with ADT2 protein
ADP/ATP translocase 2 (ANT2 or ADT2, encoded by the gene SLC25A5) was one of the most abundant proteins uniquely interacting with biotinylated miR-29b (Table 1). ANT2 is known to interact with the MMS19–MIP18–XPD (MMXD) complex involved in the formation of mitotic spindles (4, 16). We therefore focused subsequent studies on testing whether ANT2 was a viable candidate for explaining the effect of miR-29b on nuclear morphology.
Two biochemical approaches and an imaging approach were employed to validate ANT2 and miR-29b were parts of a molecular complex. miR-29a was used as a stringent control for miR-29b. First, Western blotting analysis confirmed the presence of ANT2 in protein samples affinity-purified from cells transfected with biotinylated miR-29b, but not biotinylated miR-29a or scrambled miR-29b oligonucleotides (Fig. 2A). Second, ANT2 and its interacting partners were isolated from untransfected HeLa cells by immunoprecipitation using an ANT2 antibody. The immunoprecipitated complexes obtained contained an enrichment of endogenous, native miR-29b relative to miR-29a, compared with whole cell lysate or immunoprecipitated complexes obtained using an IgG isotype control antibody (Fig. 2B). Third, colocalization between endogenous, native miR-29b and ANT2 was observed in intact cells. Although nuclear localization of miR-29b was observed in many cells, clustering of ANT2 just outside the nucleus was only observed when ANT2 was colocalized with miR-29b (Fig. 2C) in early mitosis when the nucleus is still intact in HeLa cells (∼9 h after release from a double thymidine block). Perinuclear clusters of colocalized miR-29b and ANT2 were also observed in NIH-3T3 cells (Fig. 2D). When cells were released from the double thymidine block into nocodazole, a compound that induces depolymerization of centrosomal microtubules, one large cluster of miR-29b/ANT2 was no longer observed. Rather, the smaller aggregates of colocalized fluorophores were observed scattered throughout the cytoplasm (Fig. 2E), suggesting the perinuclear colocalization of miR-29b and ANT2 was associated with microtubule organization at the centrosome. Where ANT2 was not colocalized with miR-29b, a low level of ANT2 was observed throughout the cytoplasm, consistent with the known presence of ANT2 in mitochondria.
Figure 2.

miR-29b interacted and colocalized with ANT2. A, Western blotting confirmed the presence of ANT2 in protein samples affinity-purified (AP) from HeLa cells transfected with biotinylated miR-29b only. B, immunoprecipitation (IP) of ANT2 (anti-ANT2) and its interacting molecules showed an enrichment of endogenous, native miR-29b relative to miR-29a (n = 10 for cell lysate; n = 5 for each IP group). *, p < 0.05 versus cell lysate or IgG isotype control. C, endogenous miR-29b was enriched in the nucleus and a dense cluster near the nucleus in premitotic HeLa cells. ANT2 is prominently colocalized with the dense cluster of miR-29b near the nucleus in addition to diffuse presence in the cytoplasm. 3D images (60.88 × 60.88 × 9.60 μm) of a representative cell are shown to provide a detailed view of the spatial relationships. The scale bar represents 20 μm. Quantification of the clustered colocalization of miR-29b and ANT2 in a population of cells will be shown in Fig. 3. Validation of probe specificity, as well as appropriate controls, can be found in Fig. S1. D, miR-29b and ANT2 were colocalized in a cluster (yellow) just outside of the nucleus (blue) in early mitosis in NIH-3T3 cells. E, cells that were released into nocodazole, which disrupts mitotic spindles, following the last thymidine synchronization still exhibited nuclear localization of miR-29b (green). However, the treatment resulted in the loss of large perinuclear clusters of miR-29b and ANT2 colocalization. The colocalization (yellow) was instead observed in smaller punctate clusters throughout the cytoplasm. The scale bars in D and E are 25 μm in length. F, synchronized cells were transfected with either ant-scr or anti–miR-29b and pre-scr, pre-miR-29a, or pre-miR-29b and collected 24 h after a second thymidine release (as in Fig. 1A). Anti-scr cells had normal nuclear morphology and normal distribution of miR-29a (cytoplasmic) and miR-29b (nuclear). The scale bar is 50 μm. G, quantification of nuclear morphology revealed that knockdown of miR-29b led to a significant increase in the percentage of abnormally shaped nuclei per field, in pre-scr–treated (+ pre-scr) and pre-miR-29a–treated (+ pre-miR-29a) cells without impacting miR-29a expression (F). Concurrent overexpression of miR-29b (+ miR-29b) prevented irregular nuclear morphology from developing. *, p < 0.05 versus anti-scr + pre-scr scrambled (n = 3); #, p < 0.05 versus anti–miR-29b + pre-scr (n = 7) or pre-miR-29a (n = 6); one-way analysis of variance; anti–miR-29b + pre-miR-29b (n = 8). DAPI, 4′,6′-diamino-2-phenylindole.
Rescue experiments were used to verify the specificity of the anti-miR oligonucleotides, as well as the in situ hybridization probes used in these experiments (Fig. 2F). Probes for both miR-29a and miR-29b produced unique, highly specific signals in response to transfection with pre–miR-29a and pre–miR-29b, respectively. Further, these experiments demonstrate that delivery of synthetic miR-29b, but not miR-29a, rescues the abnormal nuclear phenotype induced by anti–miR-29b transfection (Fig. 2, F and G).
miR-29b colocalization with ANT2 is EIF2C2 independent
We then determined whether the perinuclear clustering of miR-29b with ANT2 required argonaute 2 (EIF2C2). We found, again, that nearly all of the clusters of miR-29b and ANT2 were colocalized just outside of the nucleus in cells transfected with a scrambled siRNA (Fig. 3, A and B). Knockdown of EIF2C2 with siRNA did not have any effect on the colocalization of ANT2 and miR-29b clusters (Fig. 3, A and B). Interestingly, we found that when EIF2C2 was knocked down, most nuclei no longer stained positive for miR-29b (Fig. 3, A and B). These data suggest that nuclear translocation of miR-29b is an EIF2C2-dependent process, whereas colocalization of miR-29b and ANT2 in clusters just outside of the nucleus is independent of EIF2C2.
Figure 3.
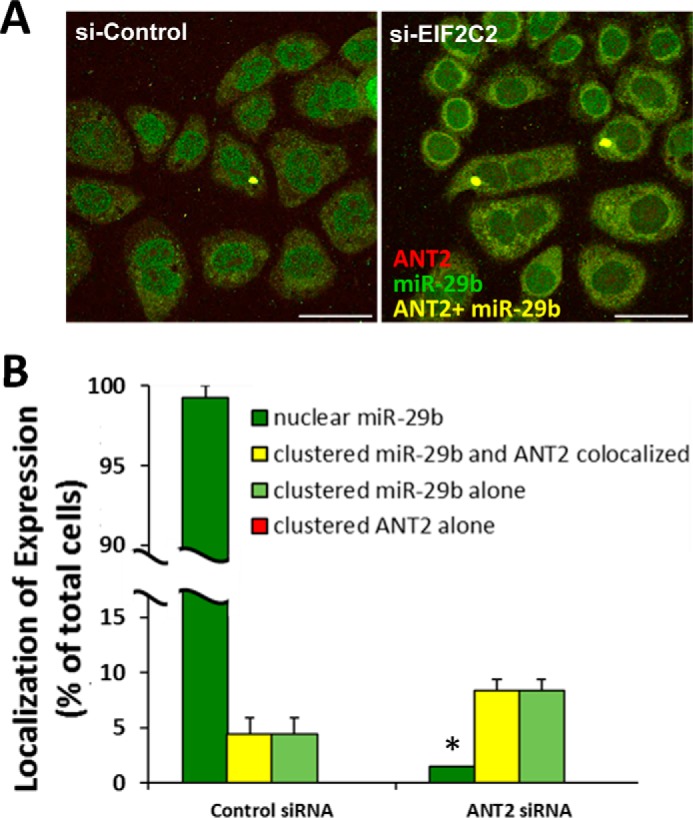
Perinuclear clustering of ANT2 and miR-29b is independent of argonaute 2. Double synchronized HeLa cells were released into nocodazole for 9 h following transfection with control siRNA (si-Control) or argonaute 2 siRNA (si-EIF2C2). A, colocalization of ANT2 with miR-29b (yellow) was still evident despite EIF2C2 knockdown. Nuclear localization of miR-29b (green) in early mitosis, however, was largely lost after EIF2C2 knockdown. B, quantified distribution of miR-29b, ANT2, and their colocalization, as a percentage of total cells per field. si-EIF2C2 (AGO2 siRNA) treatment did not alter colocalization of ANT2 and miR-29b. There were no ANT2-stained clusters (indicated by lack of red bars) that were not also colocalized with miR-29b (yellow bar). si-EIF2C2 substantially reduced the number of cells stained positive for miR-29b in the nucleus (n = 3/group). *, p < 0.05 versus control siRNA. All scale bars are 50 μm in length.
Suppression of ANT2 causes irregularities in nuclear morphology
We tested the effect of ANT2 on nuclear morphology, reasoning that knockdown of ANT2 should cause nuclear irregularities similar to those observed following miR-29b blockade if the association with ANT2 was important for the observed effect of miR-29b. Indeed, knockdown of ANT2 by two different siRNAs resulted in nuclear morphological changes that are strikingly similar to those observed in cells treated with anti–miR-29b but distinct from cells treated with anti–miR-29a (Fig. 4A). Many multinucleate cells were observed, as well as cells with lobulated and ringed nuclear material. The cells with large, irregularly shaped nuclei accounted for ∼8% of all cells in culture following ANT2 knockdown (Fig. 4B), similar to what was observed in the anti–miR-29b–treated cells (Fig. 1, A and B). We also observed similar abnormalities in centrosomal organization in mitotic cells treated with anti–miR-29b or siRNA targeting ANT2 (Fig. S7). Knockdown of other components of the MMXD complex, with which ANT2 interacts, was previously reported to result in similar chromosomal and nuclear derangements (10). Western blotting analysis reveals that the ANT2 levels remained significantly lower in si-ANT2 treated cells 24 h after the second thymidine release (Fig. 4C), the time point when the cells in Fig. 5 (A and B) were isolated. This was accompanied by an increase in the abundance of miR-29b in HeLa cells (Fig. 4C).
Figure 4.
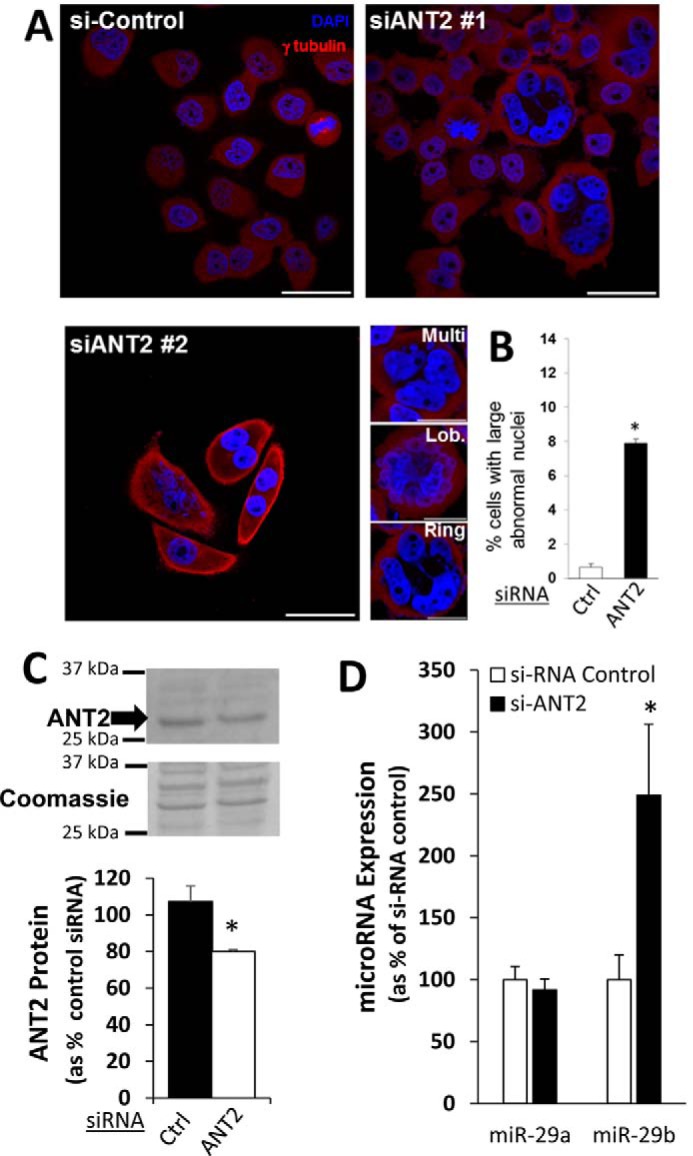
Knockdown of ANT2 resulted in irregular nuclear morphology similar to that observed following miR-29b blockade. The cells were transfected with control siRNA (si-Control) or two different ANT2 siRNA (siANT2 #1 and #2) during a double synchronization protocol. The cells were studied 24 h after release from the second thymidine block. A, knockdown of ANT2 induced large irregular nuclear morphology similar to that observed with blockade of miR-29b (see Fig. 1). The cells with irregular nuclei from the siANT2 groups included large multinucleate cells (Multi), as well as cells with lobulated (Lob.) or ringed (Ring) nuclear material. The image in the panel labeled siANT2 #1 is used again in Fig. 5 with the overlay of an additional marker. Scale bars are 50 μm in length for images with multiple cells and 25 μm in length for single cell images showing nuclear morphology phenotypes. B, percentage of cells with irregular nuclei was much higher in the siANT2 group. C, ANT-2 protein abundance in siANT2 transfected cells remained significantly suppressed 24 h after the second release. D, siANT2 treatment led to a significant increase in the abundance of miR-29b, but not miR-29a (the siANT2 #1 group was used for quantification) compared with the si-Control group (n = 3–5/group). *, p < 0.05 versus control siRNA.
Figure 5.

siANT2 blocks nuclear localization of miR-29b in early mitosis. In situ hybridization was used to detect miR-29b in si-Control (left) or siANT2 (right) transfected HeLa cells 24 h after release from the second thymidine block. This analysis revealed that knockdown of ANT2 with siRNA (right) prevented the nuclear uptake of miR-29b observed in both irregularly shaped and normal nuclei. This suggests that ANT2 is essential for the nuclear localization of miR-29b. The image from the ANT2 siRNA treatment group in the far left panel, also used in Fig. 4A, is shown here with an overlay of the signal from the miR-29b probe (green). This example demonstrates that suppression of ANT2 leads to both irregular nuclear morphology and concentration of miR-29b outside of the nucleus. The areas indicated by white squares in the upper panels are magnified in zoomed images in the lower panels to show cellular distribution of miR-29b. Scale bars indicate 50 μm in the upper row and 25 μm in the lower row.
Suppression of ANT2 prevents nuclear uptake of miR-29b
We found that knockdown of ANT2 inhibited the nuclear uptake of miR-29b early in mitosis (Fig. 5). The ANT2 siRNA did not appear to attenuate the previously observed increase in miR-29b at this time point, but rather than being localized to the nucleus, the miR-29b is observed diffusely aggregated outside of the nuclear envelope following the ANT2 siRNA treatment. The amount of miR-29b appeared proportional to the amount of nuclear material within each cell, where cells with multiple and ringed nuclei exhibited miR-29b over a larger cellular area (Fig. 5).
Suppression of miR-29b inhibits mitotic progression in nuclei that appear normal
In addition to the large number of cells with abnormally shaped nuclei that result from miR-29b or ANT2 knockdown, there were several cells with nuclei that appeared normal in morphology. We performed a cell proliferation assay to determine whether cells that had apparently normal nuclei following anti–miR-29b treatment simply underwent normal mitosis, which would suggest that miR-29b only affected a fraction of the cell population functionally. The EdU reagent was added to the medium at the time of release from the second thymidine block, allowing incorporation of the regent into the DNA during the S phase. The cells were imaged 19 h later, allowing cells enough time to undergo at least one cycle of cell division. When compared with anti-scrambled miR transfected cells, anti–miR-29b transfected cells had universally higher EdU in each cell (Fig. 6) at the end of this period. These findings suggest that miR-29b suppression permits DNA synthesis but has inhibited cell cycle progression and cell division following EdU incorporation.
Figure 6.

miR-29b knockdown inhibits cells division. A cell proliferation assay was performed to evaluate impairment in cell replication in response to miR-29b suppression. EdU was added to culture medium following transfection with anti–miR-Ctrl or anti–miR-29b and subsequent release from the second thymidine block. EdU is incorporated into DNA during the S phase, and signal within the nucleus would be expected to be reduced by half with each cell division. The cells were collected and processed for imaging 19 h after EdU treatment, providing enough time for a full cell division without reentering a second S phase in a normal cell. An EdU antibody revealed higher EdU signal in anti–miR-29b transfected cells (representative images on right) when compared with anti–miR-Ctrl transfected HeLa cell (representative images on left), suggesting that DNA synthesis is facilitated with miR-29b knockdown, despite normal cell division being impaired. Scale bar, 50 μm.
Discussion
Previous attempts to discover new miRNPs have relied on using known miRNA-induced silencing complex components such as argonaute 2 (AGO2 or EIF2C2) and trinucleotide repeat containing 6A (GW182 or TNRC6A) to pull out miRNP complexes (17–19). This approach allows identification of proteins that interact with known miRNPs. However, it does not identify miRNPs interacting with a specific miRNA or distinguish protein complexes that contain miRNAs from those that do not.
The results of the present study suggest that miR-29b might regulate nuclear morphology through a unique interaction with ANT2, a protein important for microtubule organization. Predicted mRNA targets of miR-29b are shared with miR-29a because the isoforms have identical seed sequences. If miR-29b regulates nuclear morphology via the mRNA targeting mechanism, one would expect miR-29a and miR-29b to have similar effects, which is not the case. miR-29b has also been previously reported to be suppressed in several types of cancer, most notably in some forms of leukemia that include nuclear lobulation or “flower cell” morphology (20–22).
ANT2 is a component of the MMXD complex (16). The MMXD complex is important for appropriate chromosomal segregation during mitosis. The MMXD component XPD is a known component of the microtubule organization complex (23) and was shown to interact directly with ANT2 (16).
We found that early in mitosis ANT2 and miR-29b colocalized in the microtubule organization complex. Additionally, the lobulated nuclear morphology that we observed following the knockdown of either ANT2 or miR-29b was very similar to that observed by Ito et al. (16) when other ANT2-interacting proteins within the MMXD complex (XPD, and especially MMS19) were suppressed by siRNAs. This suggests that miR-29b contributes importantly to normal chromosomal segregation through its interaction with ANT2.
Further, our data suggest that ANT2 is necessary for the nuclear uptake of miR-29b. In the absence of miR-29b, abnormal cell division is observed. miR-29b suppression appears to functionally influence nearly all cells, resulting in abnormally shaped nuclei in some cells and the inability of the nuclei to divide in others.
Together, the findings of the present study indicate that basal miR-29b contributes to normal nuclear morphology during mitosis, probably via unconventional mechanisms independent of seed region pairing and possibly involving molecular complexes that include ANT2 (Fig. S8) either through direct or indirect interaction. It would be important to investigate in future studies whether other miRNAs act through mechanisms independent of seed region pairing and how miRNAs interact with proteins other than argonautes. In the case of miR-29b and ANT2, the 3′ end sequence of miR-29b may be crucial because miR-29a and miR-29b sequences differ primarily at the 3′ end (Fig. S2). Although the present study focused on ANT2, other proteins uniquely interacting with miR-29b may contribute to additional unconventional actions of miR-29b (Table 1, Fig. S4, and supporting data set). For example, miR-29b interacted with several proteins important for gene transcription, suggesting possible effects of miR-29b on transcriptional regulation (6). Also of interest is that of the 135 proteins specifically interacting with the miR-29a duplex, over 25% were components of spliceosomes (supporting data set).
Experimental procedures
Cell culture and knockdown of miR-29 and ANT2
HeLa cells were cultured in high glucose Dulbecco's modified Eagle's medium (Invitrogen) with 10% fetal bovine serum (Sigma). HeLa cells at 30% confluency underwent a double block in 2 mm thymidine, as previously described (4). Following the first release (17 h), the cells were transfected with in vitro power inhibitors (anti–miR-scramble, anti–miR-29b, or anti–miR-29a) (Exiqon, sequences in Fig. S9) at a 133 nm final concentration, or siRNA (control siRNA, siEIF2C2, or one of two different siANT2; Life Technologies) at a 40 nm final concentration using Lipofectamine 2000 (Life Technologies) (24). The anti–miR-29b and anti–miR-29a were complementary to 19 or 20 nucleotides of miR-29b and miR-29a, respectively, including several nucleotides that are different between miR-29b and miR-29a. The anti-miRs contained locked nucleic acid modifications and a phosphorothioate backbone. Pre-miR-29a, pre-miR-29b, or scrambled miR control oligonucleotides (Thermo Fisher) were delivered at the time of anti-miR transfection at concentration of 133 nm. The medium was replaced 5 h later, and the cells were again blocked in thymidine for 14 h. The cells were released into 100 μm nocodazole or Click-iT EdU (Thermo Fisher Scientific) substrate where indicated.
In situ hybridization and immunocytochemistry
At indicated time points, cells were rinsed with PBS and fixed in 10% formalin. In situ hybridization was performed as previously described (25). The 5′ digoxigenin-labeled miR-29b probe (Exiqon), as well as positive (U6, snRNA) and negative (scrambled) controls, were hybridized overnight at 51 °C. The cells were then incubated with a fluorescein-labeled anti-digoxigenin antibody (1:100, Roche) followed by an Alexa 488 anti-fluorescein antibody to detect the miRNA probes. Immunocytochemistry was performed simultaneously with primary antibodies to ANT2 (1:100, Abcam), EIF2C2 (1:100, Santa Cruz Biotechnology), or γ-tubulin (1:100, Abcam), followed by secondary antibodies (1:100 Texas Red–labeled goat anti-rabbit and 1:100 Texas Red–labeled goat anti-mouse, respectively). Click-iT EDU-treated samples were prepared for visualization following manufacture guidelines (Thermo Fisher Scientific). Coverslips were mounted in VECTASHIELD (Vector Labs) containing 4′,6′-diamino-2-phenylindole for visualization of nuclei. All images were acquired using a Nikon A1-R laser scanning confocal microscope.
Biotinylated miRNA duplexes
Oligonucleotide sequences mimicking miR-29b, miR-29a, or scrambled miR-29b with a biotin tag at the 3′ end (13, 14) and an unbiotinylated miR-29b (Fig. S2) were synthesized by Dharmacon. The duplex strands were annealed by heating at 60 °C for 5 min, pulse centrifugation, and 30 min of cooling at room temperature.
Affinity purification of miRNA-specific miRNPs and proteomic analysis
Complete details of each of the following steps, from cell preparation to protein categorization, are provided in the supplemental information. HeLa cells at 70% confluence in 10-cm dishes were transfected with biotinylated miR-29a, miR-29b, or scrambled miR-29b or unbiotinylated miR-29b mimetic oligonucleotide duplexes at a final concentration of 133 nm using Lipofectamine 2000 (Invitrogen) (n = 3 per group). The medium was replaced after 5 h. The cells were collected 48 h later, lysed in a solution containing 0.5% Nonidet P-40, and centrifuged at 1,000 × g. The supernatant was frozen immediately in liquid nitrogen, whereas the pelleted fraction was resuspended, frozen in liquid nitrogen as spherical pellets (26, 27), and pulverized by six cycles of cryogenic grinding on a TissueLyser (Qiagen) at 30 Hz for 1 min.
The resulting powder and the frozen supernatant fraction from each plate of cells were resuspended in 1 ml of lysis buffer (20 mm K-HEPES, pH 7.4, 110 mm potassium acetate, 2 mm MgCl2, 0.1% v/v Tween 20, 1 μm ZnCl2, 1 μm CaCl2, 0.255 Triton, 150 mm NaCl, 1:100 v/v protease inhibitor), and cellular debris was removed by centrifugation at 400 × g for 10 min at 4 °C. The supernatant from each fraction was incubated with 0.8 mg of streptavidin-coated magnetic Dynabeads (Life Technologies) on a rotor at 4 °C for 3 h. Streptavidin-coated Dynabeads were isolated by magnets and washed in lysis buffer six times. Isolated proteins were eluted (0.5 n NH4OH, 0.5 mm EDTA) over 20 min on a Tomy shaker and dried down by speed vacuum.
Proteins were resuspended in 20 μl of homogenization buffer (20 mm HEPES, pH 7.5, 1 mm EDTA, 1:100 protease inhibitor) and 20 μl of Laemlli buffer (with β-mercaptoethanol) and run out one-quarter of the length of a 10% SDS-PAGE gel (Bio-Rad). The gel was fixed in 10% acetic acid and 16% MeOH, rinsed, and stained using Coomassie Blue. Proteins from each sample were excised from the gel in two equally sized subfractions that were minced, destained, prepared, and analyzed in duplicate by LC–MS/MS using a Surveyor NanoLC interfaced to an LTQ linear ion trap mass spectrometer with nanoelectrospray ionization (Thermo Scientific). In total, eight runs of LC-MS/MS analysis were performed for each biological replicate sample.
Visualize software designed by Dr. Brian Halligan at the Medical College of Wisconsin (open access, http://proteomics.mcw.edu/visualize.html)4 was used to evaluate and analyze the proteomic data. By comparing the lists of miR-29b– and miR-29a–interacting proteins resulting from our stringent criteria for inclusion, we categorized identified proteins as miR-29b–specific, miR-29a–specific, or common to both miR29a and miR-29b (supporting data set).
Western blots
For EIF2C2 and ANT2 Western blots, the cells were suspended in polyvinylpyrrolidone buffer. Prior to affinity purification, one-third of each sample of whole cell lysate was saved. Western blots were performed as previously described (12, 23) using antibodies for EIF2C2 (Santa Cruz) and ANT2 (AbCam). The membrane was stripped (47 mm Tris-HCl, pH 6.7, 15% v/v 10% SDS, 0.7% v/v β-mercaptoethanol for 30 min at 50 °C) and reblotted to obtain both Western blots.
Immunoprecipitation of ANT2–miRNA complexes
HeLa cells harvested at confluence were cryogenically ground as described in the affinity purification protocol. The cells were lysed in lysis buffer and cleared of debris. The cell lysate was precleared in Dynabeads protein A for 1 h, while separate portions of the beads were incubated with ANT2 rabbit IgG antibody or an IgG isotype control. The beads coated with anti-ANT2 or control IgG were rinsed with lysis buffer and added to the precleared cell lysate (n = 3/group). Following a 1-h incubation, the beads were rinsed as described above, and TRIzol was added directly to the beads for RNA extraction.
RNA extraction and quantitative real-time PCR
RNA was extracted using the TRIzol method and quantitative real-time PCR analysis of collagen family members was performed as previously described (12, 23) using primers listed in the “Methods” in the supporting information. Expression of miR-29a and miR-29b was measured by quantitative real-time PCR using TaqMan miRNA assays (Life Technologies) and normalized to 5s rRNA expression, as previously described (12, 23).
Statistical analysis
The data were analyzed using the Student's t test and multiple-group analysis of variance. p < 0.05 was considered significant. The criteria used for analyzing proteomic data are described in the supporting information. The data are shown as means ± S.E.
Author contributions
A. J. K., K. R. N., and M. S. P. data curation; A. J. K., S. S. T., A. S. G., K. R. N., M. S. P., and M. L. formal analysis; A. J. K. and M. L. funding acquisition; A. J. K., S. S. T., and A. S. G. investigation; A. J. K., S. S. T., A. S. G., and M. L. methodology; A. J. K. and M. L. writing-original draft; A. J. K. and M. L. project administration; A. J. K., A. S. G., K. R. N., and M. L. writing-review and editing; A. S. G. resources; K. R. N. validation; M. L. conceptualization; M. L. supervision.
Supplementary Material
Acknowledgments
We are grateful to Justin Reitsma and Tarin Bigley for sharing reagents and knowledge of the protein isolation technique, Glenn Slocum for help with the confocal microscopy, and Bonnie Freudinger for technical assistance.
This work was supported by National Institutes of Health Grants HL111580 (to M. L. and A. J. K.); HL082798, HL121233, and HL125409 (to M. L.); and HL128332 (to A. J. K.) and by a grant from the Biotechnology and Bioengineering Center at Medical College of Wisconsin (to M. L. and A. J. K.). The authors declare that they have no conflicts of interest with the contents of this article. The content is solely the responsibility of the authors and does not necessarily represent the official views of the National Institutes of Health.
This article contains supporting Methods, a supporting data set, and Figs. S1–S9.
Please note that the JBC is not responsible for the long-term archiving and maintenance of this site or any other third party hosted site.
- miRNA
- microRNA
- miRNP
- microribonucleoproteins
- XPD
- xermoderma pigmentosum group D
- MMXD
- MMS19–MIP18–XPD.
References
- 1. Bartel D. P. (2009) MicroRNAs: target recognition and regulatory functions. Cell 136, 215–233 10.1016/j.cell.2009.01.002 [DOI] [PMC free article] [PubMed] [Google Scholar]
- 2. Fabian M. R., Sonenberg N., and Filipowicz W. (2010) Regulation of mRNA translation and stability by microRNAs. Annu. Rev. Biochem. 79, 351–379 10.1146/annurev-biochem-060308-103103 [DOI] [PubMed] [Google Scholar]
- 3. Krol J., Loedige I., and Filipowicz W. (2010) The widespread regulation of microRNA biogenesis, function and decay. Nat. Rev. Genet. 11, 597–610 10.1038/nrg2843 [DOI] [PubMed] [Google Scholar]
- 4. Hwang H. W., Wentzel E. A., and Mendell J. T. (2007) A hexanucleotide element directs microRNA nuclear import. Science 315, 97–100 10.1126/science.1136235 [DOI] [PubMed] [Google Scholar]
- 5. Liao J. Y., Ma L. M., Guo Y. H., Zhang Y. C., Zhou H., Shao P., Chen Y. Q., and Qu L. H. (2010) Deep sequencing of human nuclear and cytoplasmic small RNAs reveals an unexpectedly complex subcellular distribution of miRNAs and tRNA 3′ trailers. PLoS One 5, e10563 10.1371/journal.pone.0010563 [DOI] [PMC free article] [PubMed] [Google Scholar]
- 6. Kim D. H., Saetrom P., Snøve O. Jr, and Rossi J. J. (2008) MicroRNA-directed transcriptional gene silencing in mammalian cells. Proc. Natl. Acad. Sci. U.S.A. 105, 16230–16235 10.1073/pnas.0808830105 [DOI] [PMC free article] [PubMed] [Google Scholar]
- 7. Helwak A., Kudla G., Dudnakova T., and Tollervey D. (2013) Mapping the human miRNA interactome by CLASH reveals frequent noncanonical binding. Cell 153, 654–665 10.1016/j.cell.2013.03.043 [DOI] [PMC free article] [PubMed] [Google Scholar]
- 8. Kriegel A. J., Liu Y., Fang Y., Ding X., and Liang M. (2012) The miR-29 family: genomics, cell biology, and relevance to renal and cardiovascular injury. Physiol. Genomics 44, 237–244 10.1152/physiolgenomics.00141.2011 [DOI] [PMC free article] [PubMed] [Google Scholar]
- 9. Garzon R., Heaphy C. E., Havelange V., Fabbri M., Volinia S., Tsao T., Zanesi N., Kornblau S. M., Marcucci G., Calin G. A., Andreeff M., and Croce C. M. (2009) MicroRNA 29b functions in acute myeloid leukemia. Blood 114, 5331–5341 10.1182/blood-2009-03-211938 [DOI] [PMC free article] [PubMed] [Google Scholar]
- 10. Hinchcliffe E. H. (2014) Centrosomes and the art of mitotic spindle maintenance. Int. Rev. Cell Mol. Biol. 313, 179–217 10.1016/B978-0-12-800177-6.00006-2 [DOI] [PubMed] [Google Scholar]
- 11. van Rooij E., Sutherland L. B., Thatcher J. E., DiMaio J. M., Naseem R. H., Marshall W. S., Hill J. A., and Olson E. N. (2008) Dysregulation of microRNAs after myocardial infarction reveals a role of miR-29 in cardiac fibrosis. Proc. Natl. Acad. Sci. U.S.A. 105, 13027–13032 10.1073/pnas.0805038105 [DOI] [PMC free article] [PubMed] [Google Scholar]
- 12. Liu Y., Taylor N. E., Lu L., Usa K., Cowley A. W. Jr, Ferreri N. R., Yeo N. C., and Liang M. (2010) Renal medullary microRNAs in Dahl salt-sensitive rats: miR-29b regulates several collagens and related genes. Hypertension 55, 974–982 10.1161/HYPERTENSIONAHA.109.144428 [DOI] [PMC free article] [PubMed] [Google Scholar]
- 13. Ørom U. A., and Lund A. H. (2007) Isolation of microRNA targets using biotinylated synthetic microRNAs. Methods 43, 162–165 10.1016/j.ymeth.2007.04.007 [DOI] [PubMed] [Google Scholar]
- 14. Ørom U. A., Nielsen F. C., and Lund A. H. (2008) MicroRNA-10a binds the 5′UTR of ribosomal protein mRNAs and enhances their translation. Mol. Cell 30, 460–471 10.1016/j.molcel.2008.05.001 [DOI] [PubMed] [Google Scholar]
- 15. Guo Y. E., and Steitz J. A. (2014) 3′-Biotin-tagged microRNA-27 does not associate with Argonaute protein in cells. RNA 20, 985–988 10.1261/rna.045054.114 [DOI] [PMC free article] [PubMed] [Google Scholar]
- 16. Ito S., Tan L. J., Andoh D., Narita T., Seki M., Hirano Y., Narita K., Kuraoka I., Hiraoka Y., and Tanaka K. (2010) MMXD, a TFIIH-independent XPD-MMS19 protein complex involved in chromosome segregation. Mol. Cell 39, 632–640 10.1016/j.molcel.2010.07.029 [DOI] [PubMed] [Google Scholar]
- 17. Nelson P. T., Hatzigeorgiou A. G., and Mourelatos Z. (2004) miRNP:mRNA association in polyribosomes in a human neuronal cell line. RNA 10, 387–394 10.1261/rna.5181104 [DOI] [PMC free article] [PubMed] [Google Scholar]
- 18. Meister G., Landthaler M., Peters L., Chen P. Y., Urlaub H., Lührmann R., and Tuschl T. (2005) Identification of novel argonaute-associated proteins. Curr. Biol. 15, 2149–2155 10.1016/j.cub.2005.10.048 [DOI] [PubMed] [Google Scholar]
- 19. Landthaler M., Gaidatzis D., Rothballer A., Chen P. Y., Soll S. J., Dinic L., Ojo T., Hafner M., Zavolan M., and Tuschl T. (2008) Molecular characterization of human Argonaute-containing ribonucleoprotein complexes and their bound target mRNAs. RNA 14, 2580–2596 10.1261/rna.1351608 [DOI] [PMC free article] [PubMed] [Google Scholar]
- 20. Pearson E. C. (1986) Correlations between nuclear morphology and bundles of cytoplasmic fibrils in 50 cases of acute myeloid leukaemia. J. Clin. Pathol. 39, 99–104 10.1136/jcp.39.1.99 [DOI] [PMC free article] [PubMed] [Google Scholar]
- 21. Fukuda R., Hayashi A., Utsunomiya A., Nukada Y., Fukui R., Itoh K., Tezuka K., Ohashi K., Mizuno K., Sakamoto M., Hamanoue M., and Tsuji T. (2005) Alteration of phosphatidylinositol 3-kinase cascade in the multilobulated nuclear formation of adult T cell leukemia/lymphoma (ATLL). Proc. Natl. Acad. Sci. U.S.A. 102, 15213–15218 10.1073/pnas.0507184102 [DOI] [PMC free article] [PubMed] [Google Scholar]
- 22. Huang J., Sweet P., Slater L. M., Sartorelli A. C., and Leung M. F. (1996) Microtubule-dependent multilobular organization of the nucleus in sensitive and multidrug-resistant L0 leukemia cells. Cancer Lett. 106, 29–41 10.1016/0304-3835(96)04293-0 [DOI] [PubMed] [Google Scholar]
- 23. Weber A., Chung H. J., Springer E., Heitzmann D., and Warth R. (2010) The TFIIH subunit p89 (XPB) localizes to the centrosome during mitosis. Cell Oncol. 32, 121–130 [DOI] [PMC free article] [PubMed] [Google Scholar]
- 24. Kriegel A. J., Fang Y., Liu Y., Tian Z., Mladinov D., Matus I. R., Ding X., Greene A. S., and Liang M. (2010) MicroRNA-target pairs in human renal epithelial cells treated with transforming growth factor β1: a novel role of miR-382. Nucleic Acids Res. 38, 8338–8347 10.1093/nar/gkq718 [DOI] [PMC free article] [PubMed] [Google Scholar]
- 25. Kriegel A. J., Liu Y., Cohen B., Usa K., Liu Y., and Liang M. (2012) MiR-382 targeting of kallikrein 5 contributes to renal inner medullary interstitial fibrosis. Physiol. Genomics 44, 259–267 10.1152/physiolgenomics.00173.2011 [DOI] [PMC free article] [PubMed] [Google Scholar]
- 26. Moorman N. J., Cristea I. M., Terhune S. S., Rout M. P., Chait B. T., and Shenk T. (2008) Human cytomegalovirus protein UL38 inhibits host cell stress responses by antagonizing the tuberous sclerosis protein complex. Cell Host Microbe 3, 253–262 10.1016/j.chom.2008.03.002 [DOI] [PMC free article] [PubMed] [Google Scholar]
- 27. Cristea I. M., Carroll J. W., Rout M. P., Rice C. M., Chait B. T., and MacDonald M. R. (2006) Tracking and elucidating alphavirus-host protein interactions. J. Biol. Chem. 281, 30269–30278 10.1074/jbc.M603980200 [DOI] [PubMed] [Google Scholar]
Associated Data
This section collects any data citations, data availability statements, or supplementary materials included in this article.