

Summary
Brown cotton fibres are the most widely used naturally coloured raw materials for the eco‐friendly textile industry. Previous studies have indicated that brown fibre pigments belong to proanthocyanidins (PAs) or their derivatives, and fibre coloration is negatively associated with cotton productivity and fibre quality. To date, the molecular basis controlling the biosynthesis and accumulation of brown pigments in cotton fibres is largely unknown. In this study, based on expressional and transgenic analyses of cotton homologs of Arabidopsis PA regulator TRANSPARENT TESTA 2 (TT2) and fine‐mapping of the cotton dark‐brown fibre gene (Lc1), we show that a TT2 homolog, GhTT2‐3A, controls PA biosynthesis and brown pigmentation in cotton fibres. We observed that GhTT2‐3A activated GhbHLH130D, a homolog of Arabidopsis TT8, which in turn synergistically acted with GhTT2‐3A to activate downstream PA structural genes and PA synthesis and accumulation in cotton fibres. Furthermore, the up‐regulation of GhTT2‐3A in fibres at the secondary wall‐thickening stage resulted in brown mature fibres, and fibre quality and lint percentage were comparable to that of the white‐fibre control. The findings of this study reveal the regulatory mechanism controlling brown pigmentation in cotton fibres and demonstrate a promising biotechnological strategy to break the negative linkage between coloration and fibre quality and/or productivity.
Keywords: Gossypium, TT2, proanthocyanidin, brown fibre, transgenic cotton
Introduction
Naturally coloured cotton (NCC) undergoes pigmentation in the field by synthesizing and accumulating natural pigments in developing fibres. Compared to white cotton and chemical fibres, NCC bypasses dyeing and bleaching during textile processing, which significantly reduces the release of toxic pollutants and energy and water costs, as well as effectively eliminates harmful chemical residuals in fabrics (Efe et al., 2009; Hua et al., 2009; Kimmel and Day, 2001). With the increasing demand for green products, environmental protection and human health in modern society, NCCs have attracted interest in terms of their potential use in the textile industry. However, only two types of NCCs (brown and green) are currently commercialized, as green fibres generally fade upon exposure to sunlight (Ma et al., 2016). Furthermore, NCC fibres are negatively correlated with fibre quality and productivity (Efe et al., 2009; Feng et al., 2015; Hua et al., 2009; Zhang et al., 2009). Consequently, NCCs fail to satisfy the requirements of major consumers and producers and only occupy a small niche in the cotton and textile market. To improve the colour, productivity and/or fibre quality of NCCs and to broaden their applications, it is essential to elucidate the biochemical and molecular bases of pigmentation in NCC fibres and its participation in fibre development.
Brown cotton fibres are the most commonly used NCCs. Extensive efforts have been devoted to characterizing the biochemical properties and the biosynthetic pathway for brown pigments in cotton fibres (Feng et al., 2013, 2014; Gong et al., 2014; Hinchliffe et al., 2016; Hua et al., 2007; Li et al., 2013; Murthy, 2001; Xiao et al., 2007, 2014). Earlier biochemical analyses suggested that flavonoids were involved in the brown coloration of cotton fibres (Hua et al., 2009; Murthy, 2001). Transcriptomic and proteomic analyses indicated that a series of structural genes of phenylpropanoid and flavonoid pathways, including those encoding two proanthocyanidin (PA)‐specific enzymes [leucoanthocyanidin reductase (LAR) and anthocyanidin reductase (ANR)], were up‐regulated in brown fibres (Feng et al., 2013, 2014; Gong et al., 2014; Hinchliffe et al., 2016; Li et al., 2013; Xiao et al., 2007, 2014). Furthermore, the up‐regulation of PA structural genes co‐segregated with brown fibre in a recombinant inbred line (RIL) population (Xiao et al., 2007, 2014), suggesting that PA biosynthesis and accumulation were responsible for the brown coloration in cotton fibres. Similarly, dimethylaminocinnamaldehyde (DMACA) and vanillin staining showed that high amounts of PAs accumulated in brown fibres but not in white fibres (Feng et al., 2014; Hinchliffe et al., 2016; Xiao et al., 2007). Biochemical analyses by mass spectrometry (MS) revealed that the main PA monomers in brown cotton fibres contained three hydroxyls on the B ring (gallocatechin or epigallocatechin) (Feng et al., 2014; Xiao et al., 2014). Feng et al. (2014) have demonstrated that PA accumulation in brown fibres starts at an early stage (5 days postanthesis, DPA) and peaks at 30 DPA, whereas in mature brown fibres, PAs are converted to oxidized derivatives (quinones). Because developing brown fibres do not exhibit distinct coloration until maturation, it has been proposed that quinones, instead of their PA precursors, directly contribute to brown pigmentation in cotton fibres (Feng et al., 2014). Besides natural coloration, brown NCC fibres also have enhanced flame retardancy (FR) compared to traditional white fibres, rendering them suitable for specific end‐use applications, such as automobile interiors (Hinchliffe et al., 2015, 2016; Nam et al., 2016; Parmar and Chakraborty, 2001). A recent study has demonstrated that the greater FR in brown NCCs may be the result of increased inorganic salts, such as sodium and potassium, which are possibly sequestered by PAs or PA precursors via metal‐flavonoid complexes (Hinchliffe et al., 2016; Nam et al., 2016). Therefore, PA biosynthesis plays a key role in conferring brown pigmentation and natural FR to cotton fibres, although PAs may not be the direct source of the brown coloration and/or enhanced FR.
Proanthocyanidins (PAs), also known as condensed tannins, are an important class of flavonoids that are ubiquitously distributed in plants (He et al., 2008; Winkel‐Shirley, 2001). Chemically, PAs are oligomers or polymers of flavan‐3‐ol units, which include a large number of compounds differing in monomeric composition, polymerization degree and linkage patterns between units (He et al., 2008). Based on genetic and molecular studies in Arabidopsis, the regulatory mechanism of PA biosynthesis and accumulation has been elucidated (Appelhagen et al., 2014; He et al., 2008; Lepiniec et al., 2006; Winkel‐Shirley, 2001; Zhao et al., 2010). It is proposed that the structural genes encoding PA synthases or transporters are transcriptionally activated by a tripartite complex that is composed of R2R3‐MYB (TT2), bHLH (TT8) and WD‐repeat (TTG1) proteins (Baudry et al., 2004, 2006; He et al., 2008; Koes et al., 2005; Nesi et al., 2001). Among these, TT2 is the unique transcriptional regulator of PA biosynthesis, whereas TT8 and TTG1 are involved in a wider scope of processes, including anthocyanin biosynthesis and trichome differentiation (Koes et al., 2005). Furthermore, TT2 homologs have been demonstrated to enhance PA biosynthesis in a variety of species, including poplar, grapevine, apple, cacao, persimmon, strawberry and Lotus japonicus (Akagi et al., 2009; Bogs et al., 2007; Gesell et al., 2014; Koyama et al., 2014; Liu et al., 2014, 2015; Mellway et al., 2009; Schaart et al., 2013; Terrier et al., 2009; Wang et al., 2017; Yoshida et al., 2008), suggesting that the key role of TT2 in PA regulation is highly conserved in higher plants.
Traditional genetic analyses have revealed six loci (Lc1–Lc6) controlling brown fibre that are incompletely dominant to white fibre (Kohel, 1985). Using simple sequence repeat (SSR) markers, Lc1 was mapped to the long arm of chromosome A07 of Gossypium hirsutum, and Lc2 was mapped to the short arm of chromosome A06 (Hinchliffe et al., 2016; Li et al., 2012; Wang et al., 2014; Zhang et al., 2005, 2009). Recently, Lc1 has been linked to a 1.4‐Mb inversion upstream of a TT2 homologous gene (GhTT2_A07) on chromosome A07 (Hinchliffe et al., 2016). Although expression analyses have indicated a correlation between high‐level expression of GhTT2_A07 with PA accumulation, pigmentation and enhanced FR in brown cotton fibres, genetic evidence elucidating the biological functions of this gene is limited. Furthermore, the Lc1 completely linked fragment contained over 100 annotated genes in G. raimondii (Gorai.001G009900–00G020500), including two other TT2 homologs (Gorai.001G020400 and Gorai.001G020500) that were tandemly linked to the GhTT2_A07 paralog (Gorai.001G020600). To identify the determinant regulator for brown fibre, this study performed functional analysis of cotton TT2 homologs, fine‐mapping of the Lc1 gene, and generated transgenic brown fibre cottons by up‐regulating GhTT2‐3A (GhTT2_A07), particularly in fibres at the secondary wall‐thickening stage.
Results
Identification, expression and functional analysis of TT2 homologs in cotton
Previous studies have indicated that PAs or PA derivatives play essential roles in coloration in brown NCC fibres (Feng et al., 2014; Hinchliffe et al., 2016; Xiao et al., 2007, 2014). Considering that brown fibre is genetically characterized as a qualitative trait that is controlled by a single gene (Lc1) in upland cotton T586 (Kohel, 1985; Zhang et al., 2009), we envisage that Lc1 encodes a PA regulator that activates the PA pathway in brown cotton fibres (Xiao et al., 2007). Recently, Hinchliffe et al. (2016) have reported that a cotton TT2 homolog (GhTT2_A07) is linked to brown fibre coloration and high‐level expression of GhTT2_A07 results in up‐regulation of the PA pathway. In an attempt to characterize the gene responsible for the brown coloration in cotton fibres, we conducted a comprehensive identification and functional analysis of TT2 homologs in cotton.
As shown in Figure S1, a total of 47 G. raimondii R2R3‐MYB proteins were annotated as TT2 homologs in the Phytozome collections (https://phytozome.jgi.doe.gov) (Goodstein et al., 2012). Phylogenetic reconstruction indicated that five proteins were clustered with TT2 and were thus regarded as putative TT2 homologs (Figures S1 and S2), hereby designated as GrTT2‐1–GrTT2‐5 (Table 1). Their homologous genes were further identified in the assembled G. arboreum and G. hirsutum genomes (Table 1). For each G. raimondii gene, a single homologous sequence was identified in G. arboreum and G. hirsutum At1 and Dt1 subgenomes, respectively. All these identified sequences were regarded as TT2 homologs and named according to the reference genes plus species abbreviations and subgenome (A or D) in the tetraploid cotton (Table 1). All these TT2 homologs in G. raimondii, G. arboreum and G. hirsutum were then amplified from their respective genomic DNAs. Sequence analyses indicated that the sequences and gene structures of the homologous genes were highly conserved in different subgenomes of upland cotton and the extant diploid progenitors (Figure S3).
Table 1.
TT2 homologous genes identified in assembled cotton genomes
| References | D5 | A2 | Dt1 | At1 |
|---|---|---|---|---|
| GoTT2‐1 |
GrTT2‐1Gorai.001G020400 Chr01:1923027–1924079 |
GaTT2‐1Cotton_A_05642 Ca1:2638844–2639991 |
GhTT2‐1DGohir.D07G019700 D07: 2130059–2131117 |
GhTT2‐1AGohir.A07G019900 A07: 2229796–2230862 |
| GoTT2‐2 |
GrTT2‐2Gorai.001G020500 Chr01:1941820–1942904 |
GaTT2‐2 Ca1:2667878–2668980 |
GhTT2‐2DGohir.D07G019800 D07: 2143037–2144078 |
GhTT2‐2AGohir.A07G020000 A07: 2262733–2263774 |
| GoTT2‐3 |
GrTT2‐3Gorai.001G020600 Chr01:1968735–1969655 |
GaTT2‐3Cotton_A_05641 Ca1:2686427–2687402 |
GhTT2‐3DGohir.D07G019900 D07: 2167905–2168921 |
GhTT2‐3AGohir.A07G020200 A07: 2296049–2297025 |
| GoTT2‐4 |
GrTT2‐4Gorai.001G015200 Chr01:1427526–1429468 |
GaTT2‐4Cotton_A_05698 Ca1:2068904–2070858 |
GhTT2‐4DGohir.D07G014400 D07: 1603363–1605336 |
GhTT2‐4AGohir.A07G014700 A07: 1685671–1687623 |
| GoTT2‐5 |
GrTT2‐5Gorai.010G087200 Chr10:13355170–13356235 |
GaTT2‐5Cotton_A_25175 Ca3:76125284–76126349 |
GhTT2‐5DGohir.D06G074700 D06: 14592783–14593848 |
GhTT2‐5AGohir.A06G075700 A06: 19978299–19979364 |
Gene names are indicated with annotated protein‐coding genes and corresponding locations (in bp) annotated in the genome sequencing projects for allotetraploid G. hirsutum (Dt1 and At1, https://phytozome.jgi.doe.gov/pz/portal.html#!info?alias=Org_Ghirsutum_er) and its extant diploid progenitors G. raimondii (D5) (Paterson et al., 2012) and G. arboreum (A2) (Li et al., 2014). GaTT2‐2 is not annotated in the original genome sequencing project.
To determine whether cotton TT2 homologs are involved in regulating PA biosynthesis and brown pigmentation in fibres, their transcript and PA levels in developing brown and white fibres are compared. Figure 1 shows that only GhTT2‐3A (Gohir.A07G020200), which was recently reported as GhTT2_A07 (Hinchliffe et al., 2016), is highly expressed in brown fibres, and the high‐level expression of GhTT2‐3A co‐segregated with PA accumulation and brown fibre coloration in the RIL population (Figure 1b,c). Moreover, the high‐level expression of GhTT2‐3A coincided with PA accumulation in developing brown fibres, whereas none of the nine other G. hirsutum TT2 homologs exhibited significant increased expression in brown fibres compared to white fibres (Figures S4 and S5).
Figure 1.
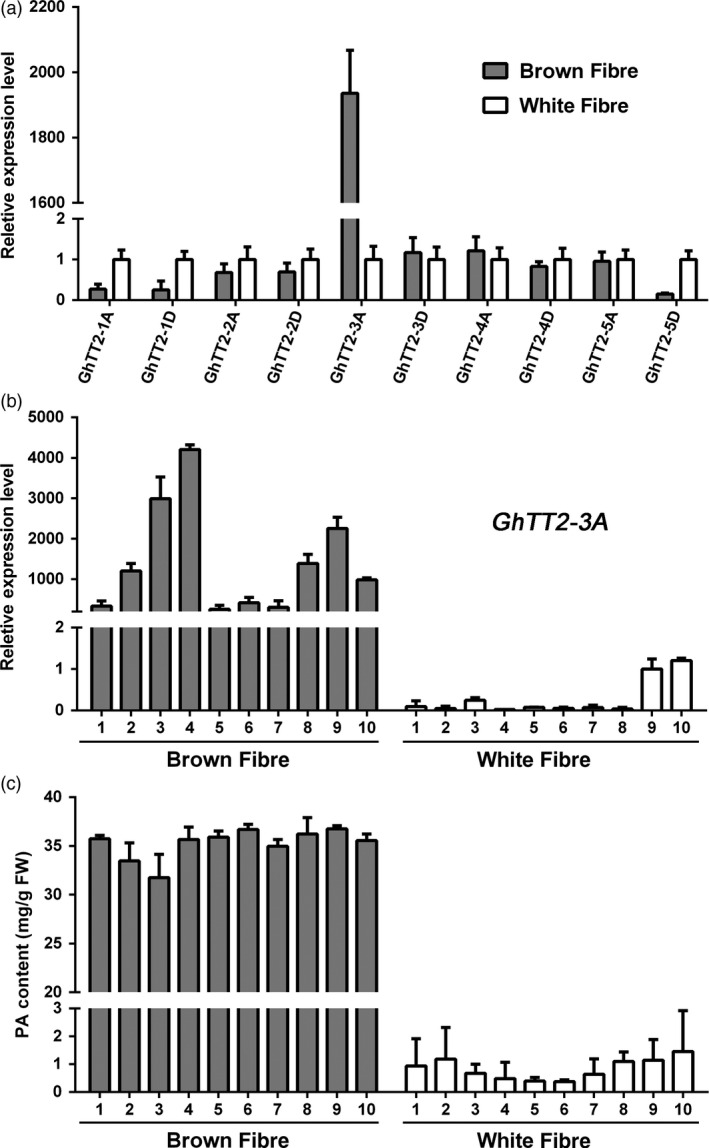
Expression of TT2 homologous genes and PA accumulation in brown and white fibres of RILs. Fibres of 20 DPA of each 10 brown‐ and white‐fibre RILs derived from T586 × Yumian No. 1 were harvested for RNA and PA extraction. (a) qRT–PCR analysis of five pairs of TT2 homologous genes using two bulks generated by equally mixing RNAs from each 10 brown‐ and white‐fibre RILs. The white‐fibre bulk was used as control. (b and c) qRT–PCR analysis of GhTT2‐3A expression and PA contents in brown and white fibres from various RILs.
To elucidate the biological functions of cotton TT2 homologs, we first transformed CaMV35S‐driven GhTT2‐3A into white‐fibre cotton Jimian No. 14 (J14). No transgenic plant overexpressing GhTT2‐3A was obtained, but PAs were up‐regulated in transgenic calli (Figure 2a,b). GhTT2‐3A and downstream PA structural genes were significantly up‐regulated in those PA‐accumulating calli (Figure 2c), indicating that GhTT2‐3A activates the entire PA pathway by activating PA structural genes in cotton calli. Furthermore, overexpressing four other G. hirsutum TT2 homologous genes (GhTT2‐1D, GhTT2‐2D, GhTT2‐4D and GhTT2‐5D) also induced PA accumulation in transgenic calli (Figure S6). Considering that the sequence similarities between homologous genes from different (sub) genomes are higher compared to those between paralogs (Table 1 and Figure S3), these results demonstrate that the TT2 homologs identified in this study are probably all active transcription factors that promote PA biosynthesis and accumulation in cotton.
Figure 2.
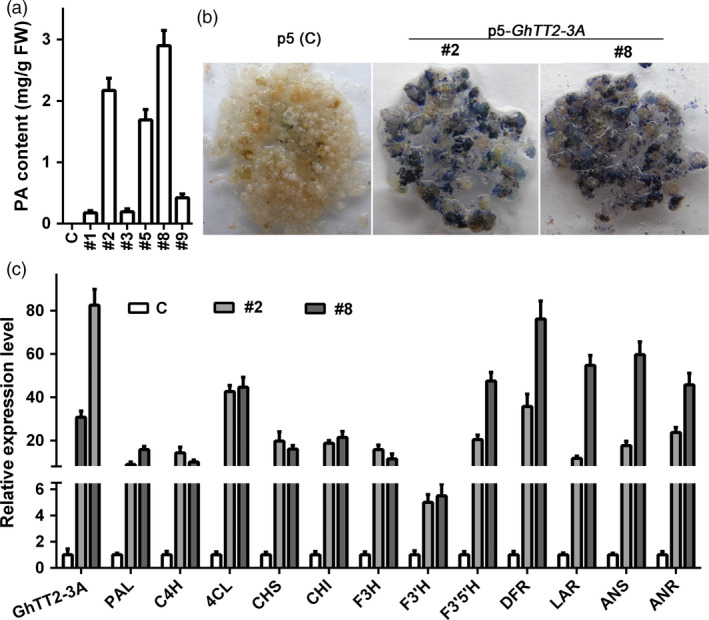
GhTT2‐3A promotes PA biosynthesis and accumulation in transgenic cotton calli. Control (c) is the empty vector (p5)‐transformed calli. (a) PA contents in the control and GhTT2‐3A‐transformed calli. (b) PA detection using DMACA staining. (c) qRT–PCR analysis of the expression of GhTT2‐3A and PA structural genes. Both homologous PA structural genes from At and Dt subgenomes are amplified as indicated in Figure S8. 4CL, 4‐coumarate:CoA ligase; ANR, anthocyanidin reductase; ANS, anthocyanidin synthase; C4H, cinnamate 4‐hydroxylase; CHI, chalcone isomerase; CHS, chalcone synthase; DFR, dihydroflavonol 4‐reductase; F3H, flavone 3‐hydroxylase; F3′H, flavonoid 3′‐hydroxylase; F3′5′H, flavonoid 3′5′‐hydroxylase; LAR, leucoanthocyanidin reductase; PAL, phenylalanine ammonia lyase.
Fine‐mapping of Lc1 in upland cotton
Along with the transcriptomic and biochemical analyses of brown‐fibre (Lc1) cottons (Xiao et al., 2007, 2014), the Lc1 gene was mapped to chromosome A07 and linked to SSR markers NAU3181 and CIR238 using a RIL population of upland cottons T586 × Yumian No. 1 (Zhang et al., 2009). Here, we employed fine‐mapping to clarify the relationship between Lc1 and TT2 homologs, particularly GhTT2‐3A (GhTT2_A07), which is highly expressed in brown cotton fibres. To this end, seven markers in the GhTT2‐3A region were explored on the basis of comparative cloning between T586 and Yumian No. 1 (Table S1). Using the T586 × Yumian No. 1 RIL population, Lc1 was mapped between markers Pec53L and MSIC10A and co‐segregated with three markers, namely TT2‐1A, INB and TT2‐3A (Figure 3a). These loci were further separated on the linkage map derived from an enlarged F2 population comprising 1698 individuals. Consequently, the Lc1 gene co‐segregated with INB and was mapped to a region between TT2‐1A and TT2‐3A (Figure 3b). In the assembled G. hirsutum genome, this interval of approximately 67 kb contained three protein‐coding genes (Figure 3c; Table S2), including a ribosomal protein L9 gene and two TT2 homologs (GhTT2‐2A and GhTT2‐3A). Because only GhTT2‐3A is significantly expressed in brown fibres and its up‐regulation promotes PA biosynthesis and accumulation in cotton (Figures 1, 2, S4 and S5), it is possible that GhTT2‐3A is the determinant gene of cotton brown fibres, as previously reported by Hinchliffe et al. (2016).
Figure 3.
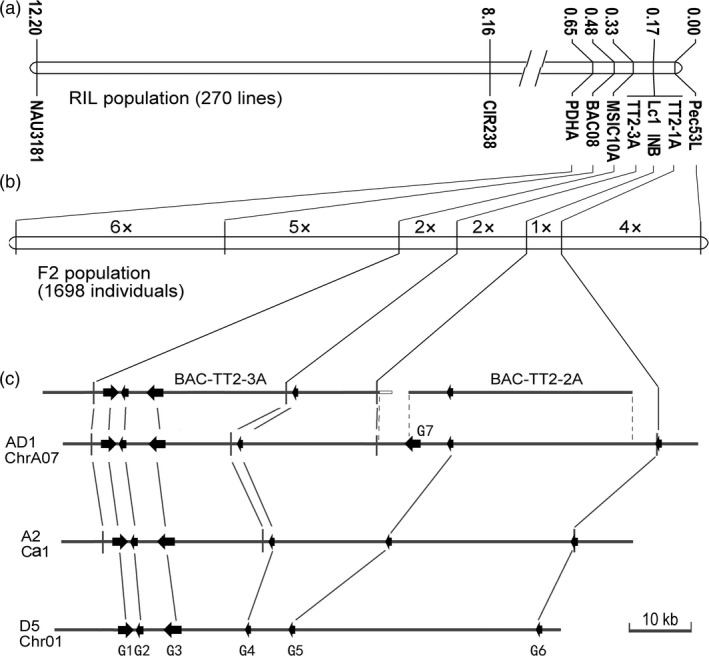
Fine‐mapping of the Lc1 gene. (a and b) the genetic map of Lc1 region constructed using RIL and enlarged F2 population, respectively. Markers in A are indicated along with the genetic distance calculated according to recombinant frequency. The map in B is drawn to scale to the genetic distance, with the number of recombination events indicated in the intervals between markers. (c) Contig analysis of Lc1 region in G. hirsutum (AD1) and collinearity with G. arboreum (A2) and G. raimondii (D5). Two BACs and the corresponding region from G. hirsutum genome sequence (JGI v1.1) are aligned. The BACs (BAC‐TT2‐2‐3A and BAC‐TT2‐2A) are screened from the BAC libraries of T586 and Yumian No. 1 using gene‐specific primers (Table S5). The borders of overlapped sequences are indicated by dashed lines. Identical or homologous loci are represented by solid lines. Arrows show annotated protein‐coding genes (Table S2). G1–G6 represent the annotated genes Gorai.001G020900–001G020400 in G. raimondii, respectively. G2 in AD1 and A2, and G5 in A2, which are not annotated in the original genome sequencing projects, are validated according to sequence similarity to G. raimondii genes. G7 may be a recently amplified gene, for only one copy was detected in G. arboreum (Cotton_A_32686) and G. raimondii (Gorai.009G304100), whereas a total of 16 copies, including the collinear homologs (Gohir.A05G287800 and Gohir.D05G289000), are identified in the assembled G. hirsutum genome (Table S2). The open bar at the end of BAC‐TT2‐3A indicates the inversed fragment that is homologous to Gorai.001G009800 in G. raimondii.
Specific up‐regulation of GhTT2‐3A in cotton fibres
As earlier mentioned, no GhTT2‐3A overexpressing cotton plant was obtained, presumably because high levels of PAs inhibited cotton regeneration (Akagi et al., 2009). To verify the function of GhTT2‐3A in the brown pigmentation of cotton fibres, we employed a fibre‐specific promoter of the secondary wall‐thickening stage (FbL2A) (Rinehart et al., 1996) to direct the expression of GhTT2‐3A in transgenic cottons. Consequently, three independent FbL2A:GhTT2‐3A transgenic lines with moderately brown mature fibres were obtained (Figures 4a and S7). As expected, GhTT2‐3A was up‐regulated in the transgenic fibres preferentially after 16 DPA, and PAs significantly accumulated at 27 DPA, but not at 11 DPA (Figure 4b–e). These results indicate that up‐regulation of GhTT2‐3A in the fibres of the secondary wall‐thickening stage was effective and sufficient to induce PA biosynthesis and accumulation in fibres and to confer brown pigmentation to mature cotton fibres.
Figure 4.
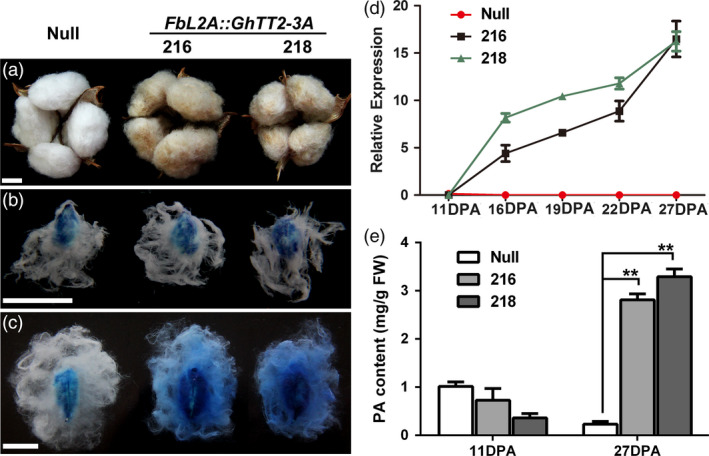
Up‐regulation of GhTT2‐3A in transgenic cotton fibres at the secondary wall‐thickening stage. (a) Opened bolls with mature fibres; (b and c) DMACA staining of 11‐ and 27‐DPA ovules and fibres, respectively; (d) qRT–PCR analysis of GhTT2‐3A transcription during fibre development; (e) levels of soluble PAs in 11‐ and 27‐DPA fibres. **Indicates significant increase (t‐test, P < 0.01) in PA content in transgenic fibres compared to the null segregant. Bars = 1 cm.
GhTT2‐3A is capable of activating the whole PA pathway in cotton fibres
To further clarify the molecular mechanism underlying the activation of PA biosynthesis and accumulation in cotton fibres by GhTT2‐3A, we first investigated the transcriptional changes in PA structural genes in the transgenic fibres. In the developing fibres of FbL2A:GhTT2‐3A cottons, all the investigated genes are significantly up‐regulated in the 22‐DPA fibres compared with the null segregant (Figure S8), whereas their expressions are relatively very low in the 11‐DPA fibres, which coincides with the levels of GhTT2‐3A transcripts and soluble PAs. This result is in agreement with that of GhTT2‐3A overexpressing calli, confirming that the up‐regulation of GhTT2‐3A activates PA structural genes and promotes PA biosynthesis and brown pigmentation in cotton fibres.
Next, transcriptomic changes in 22‐DPA fibres from FbL2A:GhTT2‐3A cotton and its null segregant were analysed by RNA‐seq. Besides those PA synthase genes previously mentioned, a total of 170 significantly differentially expressed genes were identified, including 149 up‐regulated and 21 down‐regulated in FbL2A:GhTT2‐3A fibres compared to the control (Table S3). At least 62 up‐regulated genes are probably involved in PA biosynthesis and accumulation. These genes could be divided into four classes. The first class comprises 32 genes that encode PA synthases, including phenylalanine ammonia lyase to anthocyanidin reductase (He et al., 2008; Hinchliffe et al., 2016; Xiao et al., 2014). The second gene class encodes assistant proteins or enzymes that are essential to flavonoid synthases, including NADPH‐cytochrome P450 reductase, which is required in the oxidative reaction catalysed by C4H (Sundin et al., 2014), glutamine synthetase, which presumably functions in the recycling or relief from NH4+ toxicity caused by PAL (Guan et al., 2016) and CHI‐like proteins (Jiang et al., 2015). The third class includes transporters such as MATE protein TT12 (Zhao and Dixon, 2009), glutathione S‐transferase (TT19) (Pérez‐Díaz et al., 2016) and autoinhibited H(+)‐ATPase (TT13) (Appelhagen et al., 2015), which are involved in the transportation of PA monomers into vacuoles. The last class contains enzymes in pathways that lead to the generation of precursors of PA biosynthesis, that is the shikimate pathway to produce phenylalanine and enzymes to form malonate‐CoA (Chypre et al., 2012; Hinchliffe et al., 2016). Notably, among these differentially expressed genes, the flavonoid structural genes generally have highest expression levels in the FbL2A:GhTT2‐3A fibres and highest change folds of expression level compared to the control (Table S3), implying that these genes may be directly related to GhTT2‐3A and PA biosynthesis and accumulation.
In addition to GhTT2‐3A (Gh_A07G2341), RNA‐seq also showed that Gh_D11G1273 (GhbHLH130D), a homolog of Arabidopsis PA regulator TT8, was significantly up‐regulated in FbL2A:GhTT2‐3A fibres (>4.5‐fold). To verify the functions of GhTT2‐3A and GhbHLH130D in regulating PA structural genes, dual‐luciferase assays were employed to detect their effects on the promoter activities of two PA‐specific synthase genes (GhANR, Gh_A05G1424, and GhLAR, Gh_D12G1686). Figure 5 shows that both GhTT2‐3A and GhbHLH130D individually activate the promoters of the GhANR and GhLAR genes to a moderate level (around fivefold), whereas co‐expression of these two genes dramatically increase the activation effects (around 50‐fold). These findings indicate that the regulation of the PA pathway in brown cotton fibres is similar to that in Arabidopsis seed coat; that is, R2R3‐MYB (GhTT2‐3A) and bHLH (GhbHLH130D) proteins activate downstream structural genes synergistically (Baudry et al., 2004; Koes et al., 2005) and consequently promote PA biosynthesis and accumulation in developing fibres.
Figure 5.
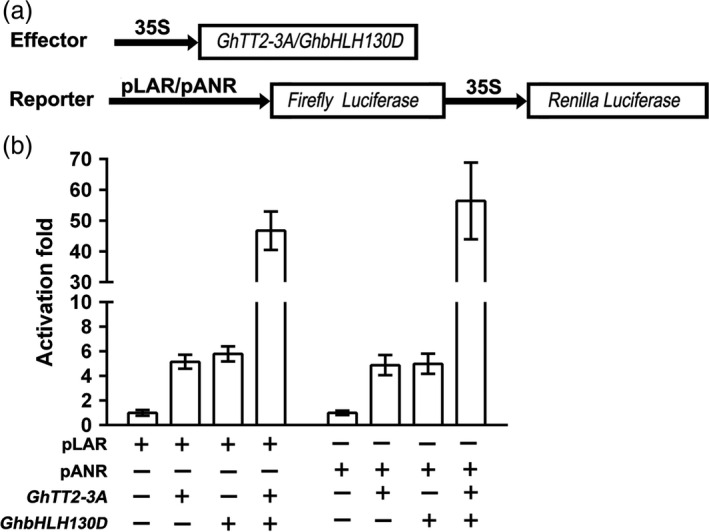
Synergistic activation of cotton LAR and ANR promoters by GhTT2‐3A and GhbHLH130D. (a) Schematic of the expression cassettes of effector and reporter vectors. (b) the activation effects on the promoters of LAR and ANR genes. The activator and Renilla luciferase genes are driven by CaMV35S promoter (35S). The promoter activities are presented as the activity ratio of firefly to Renilla luciferases.
Characterization of mature FbL2A:GhTT2‐3A transgenic fibres
Brown coloration in mature fibres is generally linked to lower yield and inferior fibre quality (Efe et al., 2009; Feng et al., 2015; Hua et al., 2009; Zhang et al., 2009). To elucidate the influence of brown coloration in FblA2:GhTT2‐3A fibres on productivity and fibre quality, a randomized complete block experiment was performed to compare lint percentage and several fibre quality traits of FbL2A:GhTT2‐3A transformants to that of the white‐ and brown‐fibre controls. ANOVA and multiple comparisons demonstrate that FbL2A:GhTT2‐3A transgenic cottons (216 and 218) have no significant changes in lint percentage, fibre length, uniformity and strength compared to the white‐fibre null segregant, which exhibits superior traits relative to the Lc1 brown‐fibre control (Tables 2 and S4). Microscopic observations indicate that, compared with Lc1 control, FbL2A:GhTT2‐3A transgenic cottons and the null segregant have significantly increased fibre numbers per seed, and their mature fibres have significantly thinner walls and smaller transverse perimeters, while these parameters do not vary significantly between FbL2A:GhTT2‐3A transgenic cottons and the null segregant (Figure 6). These data indicate that specific up‐regulation of GhTT2‐3A in the secondary wall‐thickening fibres confers brown coloration to mature fibres, but without affecting fibre quality and lint percentage.
Table 2.
Lint percentage and fibre quality of FbL2A:GhTT2‐3A cottons (216 and 218), white‐ (null)‐ and brown‐fibre (Z82) controls
| Genotypes | Lint percentage (%) | Fibre length (mm) | Fibre uniformity (%) | Fibre strength (cN.tex−1) |
|---|---|---|---|---|
| Null (WF) | 38.51 ± 1.32A | 30.31 ± 0.67A | 86.08 ± 0.68A | 30.62 ± 0.81A |
| 216 (BF) | 36.39 ± 0.96A | 30.31 ± 0.66A | 85.76 ± 1.12A | 30.82 ± 1.45A |
| 218 (BF) | 36.13 ± 0.81A | 30.40 ± 1.14A | 85.76 ± 1.22A | 30.13 ± 2.03A |
| Z82 (BF) | 28.62 ± 1.89B | 22.97 ± 0.94B | 79.54 ± 0.95B | 24.08 ± 0.60B |
The averages ± SD of six plot values (three replicates and two harvest times) are indicated. For each trait, the identical and different upper‐case letters show nonsignificant and significant differences (LSD, P < 0.01) between materials, respectively.
Figure 6.
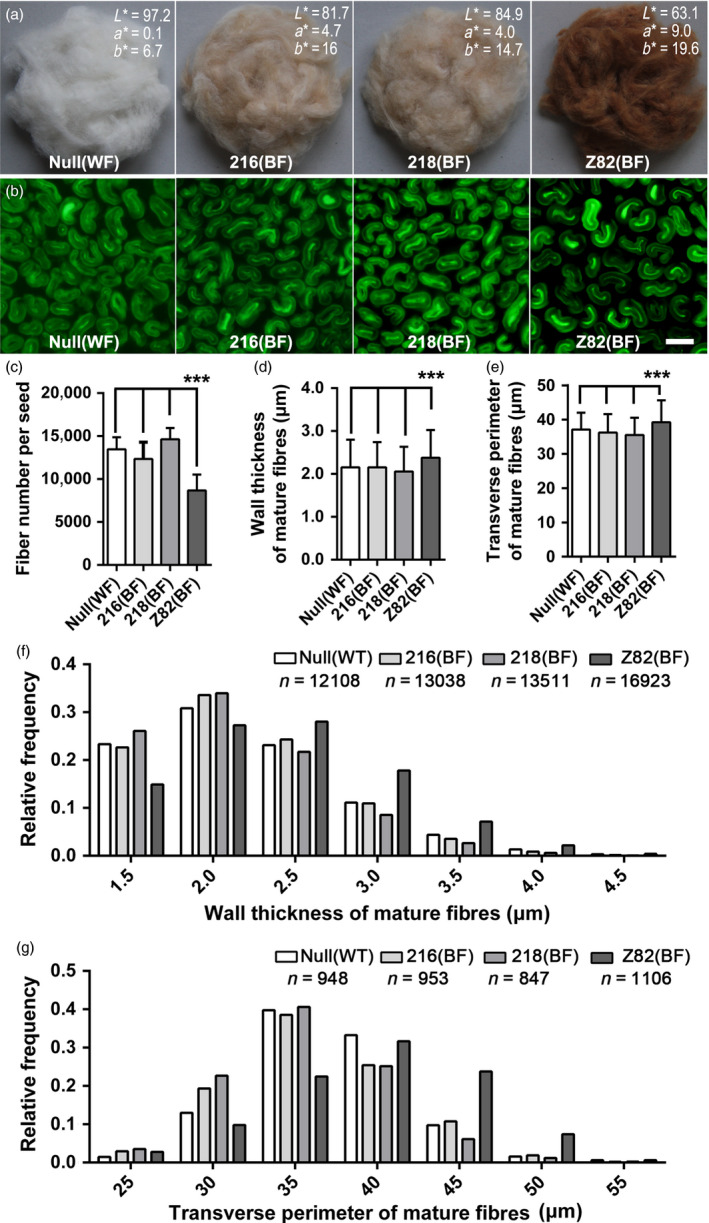
Characterization of mature FbL2A:GhTT2‐3A transgenic fibres. (a) The ginned mature fibres with the average CIE colour space values of 10 measurements (L*a*b*) indicated. L* indicates whiteness (0 = black; 100 = white); a* indicates colours from greenish (negative values) to reddish (positive values); and b* represents colours from bluish (negative values) to yellowish (positive values). (b) The micrographs of transverse sections of mature fibres. Bar = 20 μm. (c) Number of fibres per seed. (d) Wall thickness of mature fibres. (e) Transverse perimeter of mature fibres. (f and g) Frequency distributions of data in d and e, respectively. Error bars represent standard deviations, and ***indicates significant difference (P < 0.0001), compared with Lc1 control (Z82).
Discussion
GhTT2‐3A is the gene that controls brown coloration in cotton fibres
The major objective of this study was to identify the gene that controls brown coloration in cotton fibres and to determine its potential for improving transgenic NCCs. On the basis of previous reports (Hinchliffe et al., 2016; Wang et al., 2014; Zhang et al., 2009), the brown fibre gene (Lc1) was mapped to a region of around 67 kb in length that included three protein‐coding genes (Figure 3), among which only GhTT2‐3A was significantly expressed in developing brown fibres but not in white fibres (Figures S4 and S5). Moreover, up‐regulation of GhTT2‐3A rescued PA synthesis and accumulation in FbL2A:GhTT2‐3A transgenic fibres and resulted in brown pigmentation in mature cotton fibres (Figures 4 and S7). These findings collectively indicate that GhTT2‐3A is the gene controlling brown coloration in Lc1 cotton fibres. Considering that the brown‐ and white‐fibre materials (T586 and Yumian No. 1) have identical coding regions for GhTT2‐3A, the Lc1 phenotypes should be attributed the up‐regulation of GhTT2‐3A in developing fibres (Figures S3 and S4) (Hinchliffe et al., 2016).
Several reports have suggested that brown pigments belong to PAs or their derivatives (Feng et al., 2014; Hinchliffe et al., 2016; Xiao et al., 2007, 2014). In Arabidopsis, the PA pathway is transcriptionally regulated by a tripartite complex consisting of TT2, TT8 and TTG1, where TT8 is transcriptionally activated by TT2 and acts synergistically with TT2 to enhance the transcription of PA structural genes (Baudry et al., 2004, 2006; He et al., 2008; Koes et al., 2005; Xu et al., 2014). Similarly, the results of the present study show that up‐regulation of GhTT2‐3A significantly promotes the expression of GhbHLH130D (a TT8 homolog) (Yan et al., 2015), and these two transcription factors synergistically activate the promoters of two PA structural genes (GhANR and GhLAR; Figure 5). Based on the transcriptional regulation of the PA pathway in model plants, we propose that elevated expression of GhTT2‐3A in Lc1 fibres enhances GhbHLH130D expression and dramatically promotes PA synthesis and accumulation and brown pigmentation by up‐regulating PA structural genes by the synergistic action of GhTT2‐3A and GhbHLH130D (Figure 7). Notably, the synergism with GhbHLH130D further enhances the transcriptional activation effects of GhTT2‐3A on PA structural gene expression, and the extent of up‐regulation of PA structural genes is generally higher than that of GhbHLH130D in brown cotton fibres (Table S3).
Figure 7.
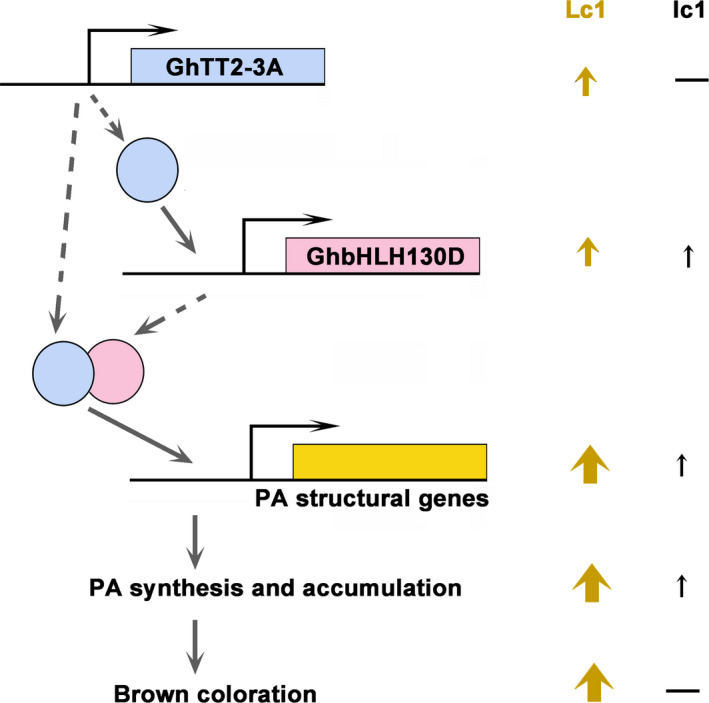
The regulatory model controlling brown coloration in cotton fibres by GhTT2‐3A. Coding genes are depicted as bars with line and arrow showing promoter and transcription direction, respectively. Proteins are represented with circles filled with identical colour as coding genes, which linked by dashed arrows. Solid arrows suggest activation or promotion effects on the next events. Upright arrows and dashes (—) indicate the presence and absence of certain event, respectively, and arrow sizes indicate approximately the levels of gene transcription, PA accumulation or brown coloration in the brown (Lc1) and white (lc1) fibres.
Dark‐brown fibre (Lc1) is a traditional genetic marker in cotton (Kohel, 1985; Zhang et al., 2005). Recently, Hinchliffe et al. (2016) reported the up‐regulation of GhTT2_A07 (GhTT2‐3A) in Lc1 fibres and suggested that a co‐segregated genomic inversion of a 1.4‐Mb segment upstream of this gene is the causative mutation of Lc1. Similarly, we identified a 2110‐bp inverted fragment in the GhTT2‐3A BAC clone (BAC‐TT2‐3A), which was 13 086 bp upstream of the initial ATG of GhTT2‐3A. Besides the genomic inversion, we identified two differentially inserted retrotransposons by comparing the upstream sequences of GhTT2‐3A of T586 and TM‐1 (Figures 3 and S9a). Further investigation using different brown‐ and white‐fibre materials showed that none of these three sequence divergences co‐segregated with fibre coloration (Figure S9b), suggesting that these sequence variations may not be directly related to the Lc1 phenotype and the causative factor leading to the high‐level expression of GhTT2‐3A in Lc1 fibres remains unknown.
Biotechnological strategies to improve NCCs
Limited colour diversity and inferior yield and fibre quality have been the major obstacles to the development of the NCC industry (Efe et al., 2009; Feng et al., 2015; Hua et al., 2009; Kimmel and Day, 2001; Zhang et al., 2009). Although numerous efforts have been taken to introduce new colour to cotton fibres, to our knowledge, no successful attempts to introduce brown mature fibres into white‐fibre acceptors have been reported to date. Furthermore, our results indicate that the negative effects of coloration on fibre development could be largely eliminated by specifically activating PA synthesis and accumulation in the fibres of the secondary wall‐thickening stage. Notably, the brown colour of transgenic FbL2A:GhTT2‐3A cotton fibres is not as dark as that of Lc1 cottons. We attribute the light fibre coloration to the lower PA contents in the transgenic fibres compared to that in Lc1 fibres (Figures 4 and S5). In an attempt to obtain darker fibre colours, we plan to co‐express GhbHLH130D and GhTT2‐3A in fibres during secondary wall thickening (Figures 5 and 7).
Proanthocyanidin is generally synthesized and accumulated in a tissue‐specific or inducible manner (Akagi et al., 2009; Debeaujon et al., 2003; Li et al., 2016a; Liu et al., 2014; Mellway et al., 2009). The constitutively activated PA pathway inhibits plant growth and development (Akagi et al., 2009). Previously, an intermediate of PA biosynthesis (naringenin) was reported to retard cotton fibre cell elongation (Tan et al., 2013), which partially explained the negative correlation between brown coloration and fibre quality and yield. The findings of the present study did not observe any significant changes in the structure and quality of FbL2A:GhTT2‐3A fibres compared to the wild‐type control (Table 2 and Figure 6), suggesting that up‐regulation of the PA pathway and PA accumulation in the fibres of secondary wall‐thickening stage might have a lesser effect, if any, on cotton fibre development and final quality. This implied that the secondary wall‐thickening stage might be an appropriate period to manipulate cotton colour via the biosynthesis and accumulation of PAs and other flavonoids. Moreover, when considering strategies to biotechnologically improve NCCs via other natural pigments, it is essential to elucidate their physiological influence on fibres at different developmental stages.
Experimental procedures
Cloning and sequence analysis of TT2 homologous genes
A total of 47 putative homologs of Arabidopsis TT2 in the G. raimondii genome were downloaded from Phytozome 12.1 (http://www.phytozome.net/cotton.php) (Goodstein et al., 2012). These sequences and TT2 were employed to construct a neighbour‐joining (NJ) tree with 1000 replicates for bootstrap analysis in MEGA 6.0 (Tamura et al., 2013). The proteins clustered with TT2 were regarded as TT2 homologs, and their homologous genes were further identified by tBLASTN searching the assembled G. arboreum (http://www.cottongen.org) and G. hirsutum (https://phytozome.jgi.doe.gov/pz/portal.html#!info?alias=Org_Ghirsutum_er) genomes using a stand‐alone software. Multiple alignments were all performed with ClustalW method in MEGA 6.0 (Tamura et al., 2013).
The coding regions of cotton TT2 homologs in G. raimondii, G. arboreum and G. hirsutum (brown‐fibre line T586 and white‐fibre line Yumian No. 1) were then amplified using primers designed according to the G. raimondii homologs (Table S5). PCRs were performed using PrimeSTAR® Max DNA polymerase (TaKaRa, Dalian, China) according to the manufacturer's instructions. All PCR products were cloned into pGEM‐T Easy vectors (Promega) and sequenced in BGI (Shenzhen, China). All these sequences were deposited in GenBank as Accession Nos. MG431343–MG431368.
RNA extraction and quantitative RT–PCR analyses
Total RNAs were extracted from various cotton tissues using a rapid plant RNA extraction kit (Aidlab, Beijing, China), and genomic DNA degradation and first‐strand cDNA synthesis were performed using a PrimeScript™ RT reagent kit with gDNA eraser (TaKaRa, Dalian, China). Quantitative PCRs were performed in a CFX96 real‐time PCR system (Bio‐Rad, CA) using SYBR Green Supermix. The thermocycling parameters were as follows: 95 °C for 2 min, followed by 40 cycles of 95 °C for 10 s, 57 °C for 20 s and a standard melting curve to monitor PCR specificity. GhACT4 and GhUBQ14 were used as reference to normalize the transcript levels of target genes (Artico et al., 2010). The PCR results were analysed using Bio‐Rad CFX Manager 2.0 provided by the manufacturer (Bio‐Rad). Primers used for quantitative PCRs are listed in Table S6.
Vector construction and cotton transformation
A modified pBI121 vector p5 (pBI121‐GN) containing selection marker NPTII and GUS genes was used to construct plant expression vectors (Luo et al., 2007). The cDNA sequences of GhTT2s (GhTT2‐1D, GhTT2‐2D, GhTT2‐3A, GhTT2‐4D and GhTT2‐5D) ORFs were amplified from the appropriate T586 tissues. After cloning in the pGEM‐T Easy vector (Promega) and sequencing, the ORFs were excised using BamHI and EcoRI, and inserted downstream to a CaMV35S promoter in the p5 vector that was restricted by the same enzymes, resulting in the overexpression vectors of GhTT2s. To construct fibre‐specific expression vectors, the promoter of FbL2A gene that was specifically expressed in fibres of the secondary wall‐thickening stage (Rinehart et al., 1996) was amplified from sea island cotton. The promoter was constructed upstream to GhTT2‐3A by replacing the CaMV35S promoter in the GhTT2‐3A overexpression vector using HindIII and BamHI sites that were introduced by PCR (Table S5). All these expression vectors were transferred into Agrobacterium tumefaciens strains (LBA4404), and the resulting Agrobacterium strains were used to transform a white‐fibre cultivar Jimian No. 14 (J14) as previously described (Luo et al., 2007).
Southern blot of the T0 generation of FbL2A:GhTT2‐3A transformants was performed as previously described (Zhang et al., 2011), using a GUS fragment amplified from the vector p5 as probe. The genomic DNAs were restricted by HindIII, and a DIG‐High Prime DNA Labeling and Detection Starter Kit (Roche) was employed in preparing DIG‐labelled probes and to detect hybridization signals. The presence and expression of transgenes in all generations were monitored by GUS staining and quantitative RT–PCR.
Genetic mapping of Lc1
The BAC libraries of brown‐fibre cotton line T586 and white‐fibre line Yumian No. 1 were constructed using the pIndigoBAC‐5 vector (Epicentre Inc., Madison, WI) by Cosete Technology (Jinan, China). Two BAC clones containing GhTT2‐2A and GhTT2‐3A (GenBank Accession Nos. MG431369 and MG431370, respectively) were screened with gene‐specific primers via a PCR‐based method (Yim et al., 2007) and sequenced by shotgun strategy at BGI (Shenzhen, China). According to these BACs and their surrounding sequences in G. raimondii genome (Paterson et al., 2012), over 20 fragments were amplified from T586 and white‐fibre variety Yumian No. 1 and compared. Polymorphic loci were then further amplified with subgenome‐specific primers (Table S1). SSR and Indel loci were amplified and detected as described elsewhere (Zhang et al., 2005, 2009). SNPs were genotyped via high resolution melting (HRM) method, which was performed in a CFX96 real‐time PCR system using a Precision Melt Supermix (Bio‐Rad). The HRM data were analysed using Precision Melt Analysis Software 1.2 (Bio‐Rad).
Two segregation populations were used to map the Lc1 gene. The RIL population, including 270 F2:7 lines, was derived from T586 × Yumian No. 1 as previously reported (Zhang et al., 2005, 2009). The enlarged F2 population, derived from the hybrid between a brown‐fibre RIL (RIL152) and white‐fibre parent Yumian No. 1, contained 1698 individuals. The populations were grown in the field, and fibre colour phenotype of each individual was scored by DMACA staining at 20 DPA and visual inspection at maturation. Genomic DNAs were extracted using a plant DNA extraction kit (Aidlab, Beijing, China). Linkage analysis and graphic presentation of linkage groups were conducted as described elsewhere (Zhang et al., 2009).
Detection and quantification of PAs
DMACA staining was employed to visualize PAs in various cotton tissues (Xiao et al., 2007). The soluble PAs in cotton tissues were extracted and quantified as described elsewhere (Pang et al., 2008). Briefly, approximately 0.5 g of fresh cotton tissues was ground to a fine powder in liquid nitrogen with a mortar and pestle and extracted twice in 1 mL of 80% acetone containing 1% ascorbate. The soluble PAs in the supernatants were detected spectrophotometrically at the wavelength of 640 nm after reacting with DMACA, and PA content was calculated with (+)‐catechin as standard. The extractions were performed in triplicate.
Transcriptomic analysis
Total RNAs were extracted from 22‐DPA fibres of FbL2A::GhTT2‐3A cotton (Line 216), and its null segregant was used for transcriptomic analysis. RNA detection, sequencing and routine data analysis were performed by Novogene (Beijing, China). Raw data were deposited in GenBank (SAR: PRJNA416219). Paired‐end clean reads of 125 nt in size (over 3.3 Gb) were aligned to the annotated genome of G. hirsutum (Zhang et al., 2015) using TopHat v2.0.12 (Trapnell et al., 2009). HTSeq v0.6.1 was used to count the reads mapped to each gene, and then, number of fragments per kilobase of transcript sequence per million base pairs sequenced (FPKM) of each gene was calculated (Anders and Huber, 2010). After the read counts were adjusted by the edgeR program package using a scaling normalized factor (Robinson et al., 2010), differential expression analysis of FbL2A::GhTT2‐3A and wild‐type fibres was performed using the DEGSeq R package (1.20.0). A corrected P‐value of 0.005 and log2 (fold change) of 1 were set as the threshold for significant differential expression.
Dual‐luciferase assay
Promoter sequences of approximately 2 kb upstream of the initial ATGs of GhANR (Gh_A05G1424) and GhLAR (Gh_D12G1686) were amplified from T586 and inserted into the HindIII and BamHI sites of pGreen 0800‐LUC (Espley et al., 2007) to generate reporter vectors. To construct the overexpression vector for GhbHLH130D, the ORF was amplified from cDNAs of 20‐DPA brown fibres and constructed into the BamHI and EcoRI sites of p5. These constructs, along with the empty p5 vector, were transformed into A. tumefaciens strain GV3101. A. tumefaciens cells harbouring the effector and reporter vectors were infiltrated into Nicotana benthamiana leaves as described elsewhere (Shan et al., 2014). Leaf discs of approximately 1.5 cm2 in size were sampled by punching and homogenized in 200 μL of an extraction buffer (1 mm dithiothreitol, 0.1 m phosphate buffer, pH 8.0). The luciferase activity of 50 μL supernatants was assayed in an automatic microplate reader (Infinite M200 Pro, Tecan, Switzerland) using a Dual‐Glo Luciferase Assay System (Promega). For each treatment, two technical repeats of three biological replicates were detected. The activation effects were expressed as the ratio of firefly to Renilla luciferase activity.
Fibre analysis
A randomized complete block experiment was performed to compare fibre traits of homozygous T4 generation FblA2:GhTT2‐3A cottons (216 and 218), a null segregant and an Lc1 line Z82, which was a homozygous brown‐fibre BC5 line derived from a cross of T586 × J14 with J14 as the recurring parent. The experiment using three replicates was conducted in the experimental farm of Southwest University (Chongqing, China) in 2016. Each plot contained 30 plants grown in three rows with 1‐m spacing as described elsewhere (Zhang et al., 2011). For each plot, mature seed fibres were collected from naturally opened bolls at two time points (1 September 2016 and 21 September 2016). After drying and ginning using a roller gin (SY‐20, Jianghe Machinery Plant, Xinxiang, Henan, China), fibres and cottonseeds were separately weighed to determine lint percentages. Fibres from each plot at specified harvest time were randomly sampled for three duplicates and subjected to fibre quality measurements at a HVI system (HFT 9000, Uster Technologies, Swiss) in the Center of Cotton Fiber Quality Inspection and Testing, Chinese Ministry of Agriculture (Anyang, Henan, China). The plot values for fibre quality traits (fibre length, fibre uniformity and fibre strength) at certain harvest time were the average of three duplicates and used in statistical analysis. The final data included the values for lint percentage and three fibre quality traits from three replicates of four lines and two harvest times. For each trait, two‐way ANOVA and subsequent multiple comparison were performed using intrinsic programs in GraphPad Prism software (v6.01, http://www.graphpad.com/scientific-software/prism/).
Microscopic observation of mature fibres
For microscopic observation of the mature fibres, FblA2:GhTT2‐3A lines (216 and 218), a null segregant and the Lc1 line Z82 were grown side by side in the field. Naturally opened bolls were harvested from the first nodes on the third to fifth fruit branches on the same day. Only the six cottonseeds in the middle of locule were collected for microscopic analysis. The fibres from the middle of cottonseed were fixed for transverse sectioning as described elsewhere (Li et al., 2016b). The sections were observed and imaged on a phase‐contrast microscope (OLYMPUS IX81). Wall thickness and perimeter of fibre transverse sections were measured in the collected images using ImageJ (http://imagej.net/Fiji). For each line, at least 100 fibre bundles from 10 different plants were observed, and over 6000 and 800 fibre sections were measured independently for fibre wall thickness and transverse perimeter, respectively. Lint number per seed was determined as previously described (Zhang et al., 2011). Briefly, fibres from 20 random cottonseeds were separated by hand and weighed (W1) on an analytical balance (XS105 Dual Range, METTLER). Six bundles of fibres (each around 1–2 mg) were randomly selected, teased and weighed (W2). The fibre bundles were fixed in a microcentrifuge tube and treated in boiling water for 10 min. Three segments were cut from the middle region of fibre bundles (the cutting length: ~1–2 mm). Each segment was separated in six drops of 45% (v/v) acetic acid, and the fibre snippet number was counted under a stereomicroscope (MVX‐10, OLYMPUS). The average of snippet numbers of the 18 segments (three segments × six bundles) was recorded as fibre number in a bundle (N2). The number of fibres per seed (N1) was calculated using the equation: N1 = (W1/20)/(W2/N2). For each line, the measurement was repeated for six times using the selected cottonseeds earlier described. Statistical analyses of these data, including one‐way ANOVA, multiple comparisons and frequency distribution, were performed with GraphPad Prism (v6.01, http://www.graphpad.com/scientific-software/prism/).
Fibres ginned using a roller gin (SY‐20, Jianghe Machinery Plant, Xinxiang, Henan, China) were randomly sampled for colour space measurement as described elsewhere (Hinchliffe et al., 2016).
Supporting information
Figure S1 Phylogenetic analysis of G. raimondii proteins similar to TT2.
Figure S2 Alignment of TT2 and its homologs identified in G. raimondii.
Figure S3 Structures of TT2 homologous genes from G. arboreum, G. raimondii and G. hirsutum.
Figure S4 qRT‐PCR analyses of the expression of cotton TT2 homologous genes in brown‐ and white‐fiber cottons.
Figure S5 Transcript levels of TT2 homologous genes and PA contents in brown and white fibers of different developmental stages.
Figure S6 TT2 homologs promote PA biosynthesis and accumulation in transgenic cotton calli.
Figure S7 Characterization of FbL2A:GhTT2‐3A transgenic cottons.
Figure S8 qRT‐PCR analysis of PA structural genes in FbL2A:GhTT2‐3A transgenic fibers.
Figure S9 Divergence of GhTT2‐3A upstream sequence between brown‐ and white‐fiber materials.
Table S1 Markers used for fine mapping of Lc1.
Table S2 Protein‐coding genes annotated in Lc1 region.
Table S4 Two‐way ANOVA in lint percentage and fiber quality traits of FbL2A:GhTT2‐3A fibers and controls from two harvest times.
Table S5 Primers used in cloning.
Table S6 Primers used in qRT‐PCR analysis.
Table S3 Differentially expressed genes in 22‐DPA FbL2A:GhTT2‐3A fibers compared to the null segregant.
Acknowledgements
This work was partially supported by the National Natural Science Foundation of China (30971713 and 31571582 to Y.H.X.), the Genetically Modified Organisms Breeding Major Project of China (2016ZX08005005‐001 to Y.H.X.) and the Special Project of Regional Collaborative Innovation in the Xinjiang Uygur Autonomous Region (2016E02001 to W.S.). The authors declare that Dr. Wu Song and Dr. Haifeng Liu are employees of the China Colored Cotton (Group) Company and that there are no conflict of interests. We would like to thank LetPub (www.letpub.com) for providing linguistic assistance during the preparation of this manuscript.
References
- Akagi, T. , Ikegami, A. , Tsujimoto, T. , Kobayashi, S. , Sato, A. , Kono, A. and Yonemori, K. (2009) DkMyb4 is a Myb transcription factor involved in proanthocyanidin biosynthesis in persimmon fruit. Plant Physiol. 151, 2028–2045. [DOI] [PMC free article] [PubMed] [Google Scholar]
- Anders, S. and Huber, W. (2010) Differential expression analysis for sequence count data. Genome Biol. 11, R106. [DOI] [PMC free article] [PubMed] [Google Scholar]
- Appelhagen, I. , Thiedig, K. , Nordholt, N. , Schmidt, N. , Huep, G. , Sagasser, M. and Weisshaar, B. (2014) Update on transparent testa mutants from Arabidopsis thaliana: characterisation of new alleles from an isogenic collection. Planta, 240, 955–970. [DOI] [PubMed] [Google Scholar]
- Appelhagen, I. , Nordholt, N. , Seidel, T. , Spelt, K. , Koes, R. , Quattrochio, F. , Sagasser, M. et al. (2015) TRANSPARENT TESTA 13 is a tonoplast P3A ‐ATPase required for vacuolar deposition of proanthocyanidins in Arabidopsis thaliana seeds. Plant J. 82, 840–849. [DOI] [PubMed] [Google Scholar]
- Artico, S. , Nardeli, S.M. , Brilhante, O. , Grossi‐de‐Sa, M.F. and Alves‐Ferreira, M. (2010) Identification and evaluation of new reference genes in Gossypium hirsutum for accurate normalization of real‐time quantitative RT‐PCR data. BMC Plant Boil. 10, 49. [DOI] [PMC free article] [PubMed] [Google Scholar]
- Baudry, A. , Heim, M.A. , Dubreucq, B. , Caboche, M. , Weisshaar, B. and Lepiniec, L. (2004) TT2, TT8, and TTG1 synergistically specify the expression of BANYULS and proanthocyanidin biosynthesis in Arabidopsis thaliana . Plant J. 39, 366–380. [DOI] [PubMed] [Google Scholar]
- Baudry, A. , Caboche, M. and Lepiniec, L. (2006) TT8 controls its own expression in a feedback regulation involving TTG1 and homologous MYB and bHLH factors, allowing a strong and cell‐specific accumulation of flavonoids in Arabidopsis thaliana . Plant J. 46, 768–779. [DOI] [PubMed] [Google Scholar]
- Bogs, J. , Jaffe, F.W. , Takos, A.M. , Walker, A.R. and Robinson, S.P. (2007) The grapevine transcription factor VvMYBPA1 regulates proanthocyanidin synthesis during fruit development. Plant Physiol. 143, 1347–1361. [DOI] [PMC free article] [PubMed] [Google Scholar]
- Chypre, M. , Zaidi, N. and Smans, K. (2012) ATP‐citrate lyase: a mini‐review. Biochem. Biophys. Res. Commun. 422, 1–4. [DOI] [PubMed] [Google Scholar]
- Debeaujon, I. , Nesi, N. , Perez, P. , Devic, M. , Grandjean, O. , Caboche, M. and Lepiniec, L. (2003) Proanthocyanidin‐accumulating cells in Arabidopsis testa: regulation of differentiation and role in seed development. Plant Cell, 15, 2514–2531. [DOI] [PMC free article] [PubMed] [Google Scholar]
- Efe, L. , Killi, F. and Mustafayev, S.A. (2009) An evaluation of eco‐friendly naturally coloured cottons regarding seed cotton yield, yield components and major lint quality traits under conditions of East Mediterranean region of Turkey. Pak. J. Biol. Sci. 12, 1346–1352. [DOI] [PubMed] [Google Scholar]
- Espley, R.V. , Hellens, R.P. , Putterill, J. , Stevenson, D.E. , Kutty‐Amma, S. and Allan, A.C. (2007) Red colouration in apple fruit is due to the activity of the MYB transcription factor, MdMYB10. Plant J. 49, 414–427. [DOI] [PMC free article] [PubMed] [Google Scholar]
- Feng, H. , Tian, X. , Liu, Y. , Li, Y. , Zhang, X. , Jones, B.J. , Sun, Y. et al. (2013) Analysis of flavonoids and the flavonoid structural genes in brown fiber of upland cotton. PLoS ONE, 8, e58820. [DOI] [PMC free article] [PubMed] [Google Scholar]
- Feng, H. , Li, Y. , Wang, S. , Zhang, L. , Liu, Y. , Xue, F. , Sun, Y. et al. (2014) Molecular analysis of proanthocyanidins related to pigmentation in brown cotton fibre (Gossypium hirsutum L.). J. Exp. Bot. 65, 5759–5769. [DOI] [PubMed] [Google Scholar]
- Feng, H. , Guo, L. , Wang, G. , Sun, J. , Pan, Z. , He, S. , Zhu, H. et al. (2015) The negative correlation between fiber color and quality traits revealed by QTL analysis. PLoS ONE, 10, e0129490. [DOI] [PMC free article] [PubMed] [Google Scholar]
- Gesell, A. , Yoshida, K. , Tran, L.T. and Constabel, C.P. (2014) Characterization of an apple TT2‐type R2R3 MYB transcription factor functionally similar to the poplar proanthocyanidin regulator PtMYB134. Planta, 240, 497–511. [DOI] [PubMed] [Google Scholar]
- Gong, W. , He, S. , Tian, J. , Sun, J. , Pan, Z. , Jia, Y. , Sun, G. et al. (2014) Comparison of the transcriptome between two cotton lines of different fiber color and quality. PLoS ONE, 9, e112966. [DOI] [PMC free article] [PubMed] [Google Scholar]
- Goodstein, D.M. , Shu, S. , Howson, R. , Neupane, R. , Hayes, R.D. , Fazo, J. , Mitros, T. et al. (2012) Phytozome: a comparative platform for green plant genomics. Nucleic Acids Res. 40, D1178–D1186. [DOI] [PMC free article] [PubMed] [Google Scholar]
- Guan, M. , de Bang, T.C. , Pedersen, C. and Schjoerring, J.K. (2016) Cytosolic glutamine synthetase Gln1;2 Is the main isozyme contributing to GS1 activity and can be up‐regulated to relieve ammonium toxicity. Plant Physiol. 171, 1921–1933. [DOI] [PMC free article] [PubMed] [Google Scholar]
- He, F. , Pan, Q.‐H. , Shi, Y. and Duan, C.‐Q. (2008) Biosynthesis and genetic regulation of proanthocyanidins in plants. Molecules, 13, 2674–2703. [DOI] [PMC free article] [PubMed] [Google Scholar]
- Hinchliffe, D. , Condon, B. , Delhom, C.D. , Chang, S. , Montalvo, J. , Madison, C. , Reynolds, M. et al. (2015) Physical and combustion properties of nonwoven fabrics produced from conventional and naturally colored cottons. Text. Res. J. 85, 1666–1680. [Google Scholar]
- Hinchliffe, D.J. , Condon, B.D. , Thyssen, G. , Naoumkina, M. , Madison, C.A. , Reynolds, M. , Delhom, C.D. et al. (2016) The GhTT2_A07 gene is linked to the brown colour and natural flame retardancy phenotypes of Lc1 cotton (Gossypium hirsutum L.) fibres. J. Exp. Bot. 67, 5461–5471. [DOI] [PMC free article] [PubMed] [Google Scholar]
- Hua, S. , Wang, X. , Yuan, S. , Shao, M. , Zhao, X. , Zhu, S. and Jiang, L. (2007) Characterization of pigmentation and cellulose synthesis in colored cotton fibers. Crop Sci. 47, 1540–1546. [Google Scholar]
- Hua, S. , Yuan, S. , Shamsi, I.H. , Zhao, X. , Zhang, X. , Liu, Y. , Wen, G. et al. (2009) A comparison of three isolines of cotton differing in fiber color for yield, quality, and photosynthesis. Crop Sci. 49, 983. [Google Scholar]
- Jiang, W. , Yin, Q. , Wu, R. , Zheng, G. , Liu, J. , Dixon, R.A. and Pang, Y. (2015) Role of a chalcone isomerase‐like protein in flavonoid biosynthesis in Arabidopsis thaliana . J. Exp. Bot. 66, 7165–7179. [DOI] [PMC free article] [PubMed] [Google Scholar]
- Kimmel, L.B. and Day, M.P. (2001) New life for an old fiber: attributes and advantages of naturally colored cotton. AATCC Rev. 1, 32–36. [Google Scholar]
- Koes, R. , Verweij, W. and Quattrocchio, F. (2005) Flavonoids: a colorful model for the regulation and evolution of biochemical pathways. Trends Plant Sci. 10, 236–242. [DOI] [PubMed] [Google Scholar]
- Kohel, R.J. (1985) Genetic analysis of fiber color variants in cotton. Crop Sci. 25, 793–797. [Google Scholar]
- Koyama, K. , Numata, M. , Nakajima, I. , Goto‐Yamamoto, N. , Matsumura, H. and Tanaka, N. (2014) Functional characterization of a new grapevine MYB transcription factor and regulation of proanthocyanidin biosynthesis in grapes. J. Exp. Bot. 65, 4433–4449. [DOI] [PubMed] [Google Scholar]
- Lepiniec, L. , Debeaujon, I. , Routaboul, J.M. , Baudry, A. , Pourcel, L. , Nesi, N. and Caboche, M. (2006) Genetics and biochemistry of seed flavonoids. Annu. Rev. Plant Biol. 57, 405–430. [DOI] [PubMed] [Google Scholar]
- Li, F.‐Z. , Ning, X.‐M. , Qiu, X.‐M. , Su, C.‐F. , Yao, J.‐Q. and Tian, L.‐W. (2012) Genetic mapping of the dark brown fiber Lc1 gene in tetraploid cotton. Sci. Agric. Sin. 45, 6. [Google Scholar]
- Li, Y.‐J. , Zhang, X.‐Y. , Wang, F.‐X. , Yang, C.‐L. , Liu, F. , Xia, G.‐X. and Sun, J. (2013) A comparative proteomic analysis provides insights into pigment biosynthesis in brown color fiber. J. Proteomics. 78, 374–388. [DOI] [PubMed] [Google Scholar]
- Li, F. , Fan, G. , Wang, K. , Sun, F. , Yuan, Y. , Song, G. , Li, Q. et al. (2014) Genome sequence of the cultivated cotton Gossypium arboreum . Nat. Genet. 46, 567–572. [DOI] [PubMed] [Google Scholar]
- Li, P. , Chen, B. , Zhang, G. , Chen, L. , Dong, Q. , Wen, J. , Mysore, K.S. et al. (2016a) Regulation of anthocyanin and proanthocyanidin biosynthesis by Medicago truncatula bHLH transcription factor MtTT8. New Phytol. 210, 905–921. [DOI] [PubMed] [Google Scholar]
- Li, Y. , Tu, L. , Pettolino, F.A. , Ji, S. , Hao, J. , Yuan, D. , Deng, F. et al. (2016b) GbEXPATR, a species‐specific expansion, enhances cotton fibre elongation through cell wall restructuring. Plant Biotechnol. J. 14, 951–963. [DOI] [PMC free article] [PubMed] [Google Scholar]
- Liu, C. , Jun, J.H. and Dixon, R.A. (2014) MYB5 and MYB14 play pivotal roles in seed coat polymer biosynthesis in Medicago truncatula . Plant Physiol. 165, 1424–1439. [DOI] [PMC free article] [PubMed] [Google Scholar]
- Liu, Y. , Shi, Z. , Maximova, S.N. , Payne, M.J. and Guiltinan, M.J. (2015) Tc‐MYBPA an Arabidopsis TT2‐like transcription factor and functions in the regulation of proanthocyanidin synthesis in Theobroma cacao . BMC Plant Boil. 15, 160. [DOI] [PMC free article] [PubMed] [Google Scholar]
- Luo, M. , Xiao, Y. , Li, X. , Lu, X. , Deng, W. , Li, D. , Hou, L. et al. (2007) GhDET2, a steroid 5α‐reductase, plays an important role in cotton fiber cell initiation and elongation. Plant J. 51, 419–430. [DOI] [PubMed] [Google Scholar]
- Ma, M. , Hussain, M. , Memon, H. and Zhou, W. (2016) Structure of pigment compositions and radical scavenging activity of naturally green‐colored cotton fiber. Cellulose, 23, 955–963. [Google Scholar]
- Mellway, R.D. , Tran, L.T. , Prouse, M.B. , Campbell, M.M. and Constabel, C.P. (2009) The wound‐, pathogen‐, and ultraviolet B‐responsive MYB134 gene encodes an R2R3 MYB transcription factor that regulates proanthocyanidin synthesis in poplar. Plant Physiol. 150, 924–941. [DOI] [PMC free article] [PubMed] [Google Scholar]
- Murthy, M.S.S. (2001) Never say dye: the story of coloured cotton. Resonance, 6, 29–35. [Google Scholar]
- Nam, S. , Kim, H.J. , Condon, B.D. , Hinchliffe, D.J. , Chang, S. , McCarty, J.C. and Madison, C.A. (2016) High resistance to thermal decomposition in brown cotton is linked to tannins and sodium content. Cellulose, 23, 1137–1152. [Google Scholar]
- Nesi, N. , Jond, C. , Debeaujon, I. , Caboche, M. and Lepiniec, L. (2001) The Arabidopsis TT2 gene encodes an R2R3 MYB domain protein that acts as a key determinant for proanthocyanidin accumulation in developing seed. Plant Cell, 13, 2099–2114. [DOI] [PMC free article] [PubMed] [Google Scholar]
- Pang, Y. , Peel, G.J. , Sharma, S.B. , Tang, Y. and Dixon, R.A. (2008) A transcript profiling approach reveals an epicatechin‐specific glucosyltransferase expressed in the seed coat of Medicago truncatula . Proc. Natl Acad. Sci. USA, 105, 14210–14215. [DOI] [PMC free article] [PubMed] [Google Scholar]
- Parmar, M.S. and Chakraborty, M. (2001) Thermal and burning behavior of naturally colored cotton. Text. Res. J. 71, 1099–1102. [Google Scholar]
- Paterson, A.H. , Wendel, J.F. , Gundlach, H. , Guo, H. , Jenkins, J. , Jin, D. and Llewellyn, D. (2012) Repeated polyploidization of Gossypium genomes and the evolution of spinnable cotton fibres. Nature, 492, 423–427. [DOI] [PubMed] [Google Scholar]
- Pérez‐Díaz, R. , Madrid‐Espinoza, J. , Salinas‐Cornejo, J. , González‐Villanueva, E. and Ruiz‐Lara, S. (2016) Differential roles for VviGST1, VviGST3, and VviGST4 in proanthocyanidin and anthocyanin transport in Vitis vinífera . Front. Plant Sci. 7, 1166. [DOI] [PMC free article] [PubMed] [Google Scholar]
- Rinehart, J.A. , Petersen, M.W. and John, M.E. (1996) Tissue‐specific and developmental regulation of cotton gene FbL2A. Demonstration of promoter activity in transgenic plants. Plant Physiol. 112, 1331–1341. [DOI] [PMC free article] [PubMed] [Google Scholar]
- Robinson, M.D. , McCarthy, D.J. and Smyth, G.K. (2010) edgeR: a Bioconductor package for differential expression analysis of digital gene expression data. Bioinformatics, 26, 139–140. [DOI] [PMC free article] [PubMed] [Google Scholar]
- Schaart, J.G. , Dubos, C. , Romero De La Fuente, I. , van Houwelingen, A.M. , de Vos, R.C. , Jonker, H.H. , Xu, W. et al. (2013) Identification and characterization of MYB‐bHLH‐WD40 regulatory complexes controlling proanthocyanidin biosynthesis in strawberry (Fragaria x ananassa) fruits. New Phytol. 197, 454–467. [DOI] [PubMed] [Google Scholar]
- Shan, C.M. , Shangguan, X.X. , Zhao, B. , Zhang, X.F. , Chao, L.M. , Yang, C.Q. , Wang, L.J. et al. (2014) Control of cotton fibre elongation by a homeodomain transcription factor GhHOX3. Nat. Commun. 5, 5519. [DOI] [PMC free article] [PubMed] [Google Scholar]
- Sundin, L. , Vanholme, R. , Geerinck, J. , Goeminne, G. , Hofer, R. , Kim, H. , Ralph, J. et al. (2014) Mutation of the inducible Arabidopsis thaliana CYTOCHROME P450 REDUCTASE 2 alters lignin composition and improves saccharification. Plant Physiol. 166, 1956–1971. [DOI] [PMC free article] [PubMed] [Google Scholar]
- Tamura, K. , Stecher, G. , Peterson, D. , Filipski, A. and Kumar, S. (2013) MEGA6: molecular evolutionary genetics analysis version 6.0. Mol. Biol. Evol. 30, 2725–2729. [DOI] [PMC free article] [PubMed] [Google Scholar]
- Tan, J. , Tu, L. , Deng, F. , Hu, H. , Nie, Y. and Zhang, X. (2013) A genetic and metabolic analysis revealed that cotton fiber cell development was retarded by flavonoid naringenin. Plant Physiol. 162, 86–95. [DOI] [PMC free article] [PubMed] [Google Scholar]
- Terrier, N. , Torregrosa, L. , Ageorges, A. , Vialet, S. , Verries, C. , Cheynier, V. and Romieu, C. (2009) Ectopic expression of VvMybPA2 promotes proanthocyanidin biosynthesis in grapevine and suggests additional targets in the pathway. Plant Physiol. 149, 1028–1041. [DOI] [PMC free article] [PubMed] [Google Scholar]
- Trapnell, C. , Pachter, L. and Salzberg, S.L. (2009) TopHat: discovering splice junctions with RNA‐Seq. Bioinformatics, 25, 1105–1111. [DOI] [PMC free article] [PubMed] [Google Scholar]
- Wang, L. , Liu, H. , Li, X. , Xiao, X. , Ai, X. , Luo, C. , Zhu, L. et al. (2014) Genetic mapping of fiber color genes on two brown cotton cultivars in Xinjiang. SpringerPlus, 3, 480. [DOI] [PMC free article] [PubMed] [Google Scholar]
- Wang, N. , Xu, H. , Jiang, S. , Zhang, Z. , Lu, N. , Qiu, H. , Qu, C. et al. (2017) MYB12 and MYB22 play essential roles in proanthocyanidin and flavonol synthesis in red‐fleshed apple (Malus sieversii f. niedzwetzkyana). Plant J. 90, 276–292. [DOI] [PubMed] [Google Scholar]
- Winkel‐Shirley, B. (2001) Flavonoid biosynthesis. A colorful model for genetics, biochemistry, cell biology, and biotechnology. Plant Physiol. 126, 485–493. [DOI] [PMC free article] [PubMed] [Google Scholar]
- Xiao, Y.‐H. , Zhang, Z.‐S. , Yin, M.‐H. , Luo, M. , Li, X.‐B. , Hou, L. and Pei, Y. (2007) Cotton flavonoid structural genes related to the pigmentation in brown fibers. Biochem. Biophys. Res. Commun. 358, 73–78. [DOI] [PubMed] [Google Scholar]
- Xiao, Y.‐H. , Yan, Q. , Ding, H. , Luo, M. , Hou, L. , Zhang, M. , Yao, D. et al. (2014) Transcriptome and biochemical analyses revealed a detailed proanthocyanidin biosynthesis pathway in brown cotton fiber. PLoS ONE, 9, e86344. [DOI] [PMC free article] [PubMed] [Google Scholar]
- Xu, W. , Grain, D. , Bobet, S. , Le Gourrierec, J. , Thévenin, J. , Kelemen, Z. , Lepiniec, L. et al. (2014) Complexity and robustness of the flavonoid transcriptional regulatory network revealed by comprehensive analyses of MYB–bHLH–WDR complexes and their targets in Arabidopsis seed. New Phytol. 202, 132–144. [DOI] [PubMed] [Google Scholar]
- Yan, Q. , Liu, H.‐S. , Yao, D. , Li, X. , Chen, H. , Dou, Y. , Wang, Y. et al. (2015) The basic/Helix‐Loop‐Helix protein family in Gossypium: reference genes and their evolution during tetraploidization. PLoS ONE, 10, e0126558. [DOI] [PMC free article] [PubMed] [Google Scholar]
- Yim, Y.‐S. , Moak, P. , Sanchez‐Villeda, H. , Musket, T.A. , Close, P. , Klein, P.E. , Mullet, J.E. et al. (2007) A BAC pooling strategy combined with PCR‐based screenings in a large, highly repetitive genome enables integration of the maize genetic and physical maps. BMC Genom. 8, 47. [DOI] [PMC free article] [PubMed] [Google Scholar]
- Yoshida, K. , Iwasaka, R. , Kaneko, T. , Sato, S. , Tabata, S. and Sakuta, M. (2008) Functional differentiation of Lotus japonicus TT2s, R2R3‐MYB transcription factors comprising a multigene family. Plant Cell Physiol. 49, 157–169. [DOI] [PubMed] [Google Scholar]
- Zhang, Z.‐S. , Xiao, Y.‐H. , Luo, M. , Li, X.‐B. , Luo, X.‐Y. , Hou, L. , Li, D.‐M. et al. (2005) Construction of a genetic linkage map and QTL analysis of fiber‐related traits in upland cotton (Gossypium hirsutum L.). Euphytica, 144, 91–99. [Google Scholar]
- Zhang, Z.‐S. , Hu, M.‐C. , Zhang, J. , Liu, D.‐J. , Zheng, J. , Zhang, K. , Wang, W. et al. (2009) Construction of a comprehensive PCR‐based marker linkage map and QTL mapping for fiber quality traits in upland cotton (Gossypium hirsutum L.). Mol. Breed. 24, 49–61. [Google Scholar]
- Zhang, M. , Zheng, X. , Song, S. , Zeng, Q. , Hou, L. , Li, D. , Zhao, J. et al. (2011) Spatiotemporal manipulation of auxin biosynthesis in cotton ovule epidermal cells enhances fiber yield and quality. Nat. Biotechnol. 29, 453–458. [DOI] [PubMed] [Google Scholar]
- Zhang, T. , Hu, Y. , Jiang, W. , Fang, L. , Guan, X. , Chen, J. , Zhang, J. et al. (2015) Sequencing of allotetraploid cotton (Gossypium hirsutum L. acc. TM‐1) provides a resource for fiber improvement. Nat. Biotechnol. 33, 531–537. [DOI] [PubMed] [Google Scholar]
- Zhao, J. and Dixon, R.A. (2009) MATE transporters facilitate vacuolar uptake of epicatechin 3'‐O‐glucoside for proanthocyanidin biosynthesis in Medicago truncatula and Arabidopsis. Plant Cell, 21, 2323–2340. [DOI] [PMC free article] [PubMed] [Google Scholar]
- Zhao, J. , Pang, Y. and Dixon, R.A. (2010) The mysteries of proanthocyanidin transport and polymerization. Plant Physiol. 153, 437–443. [DOI] [PMC free article] [PubMed] [Google Scholar]
Associated Data
This section collects any data citations, data availability statements, or supplementary materials included in this article.
Supplementary Materials
Figure S1 Phylogenetic analysis of G. raimondii proteins similar to TT2.
Figure S2 Alignment of TT2 and its homologs identified in G. raimondii.
Figure S3 Structures of TT2 homologous genes from G. arboreum, G. raimondii and G. hirsutum.
Figure S4 qRT‐PCR analyses of the expression of cotton TT2 homologous genes in brown‐ and white‐fiber cottons.
Figure S5 Transcript levels of TT2 homologous genes and PA contents in brown and white fibers of different developmental stages.
Figure S6 TT2 homologs promote PA biosynthesis and accumulation in transgenic cotton calli.
Figure S7 Characterization of FbL2A:GhTT2‐3A transgenic cottons.
Figure S8 qRT‐PCR analysis of PA structural genes in FbL2A:GhTT2‐3A transgenic fibers.
Figure S9 Divergence of GhTT2‐3A upstream sequence between brown‐ and white‐fiber materials.
Table S1 Markers used for fine mapping of Lc1.
Table S2 Protein‐coding genes annotated in Lc1 region.
Table S4 Two‐way ANOVA in lint percentage and fiber quality traits of FbL2A:GhTT2‐3A fibers and controls from two harvest times.
Table S5 Primers used in cloning.
Table S6 Primers used in qRT‐PCR analysis.
Table S3 Differentially expressed genes in 22‐DPA FbL2A:GhTT2‐3A fibers compared to the null segregant.