Abstract
Background
Existing methods for directly measuring photosynthetic capacity (Amax) have low throughput, which creates a key bottleneck for pre-breeding and ecological research. Currently available commercial leaf gas exchange systems are not designed to maximize throughput, on either a cost or time basis.
Results
We present a novel multiplexed semi-portable gas exchange system, OCTOflux, that can measure Amax with approximately 4–7 times the throughput of commercial devices, despite a lower capital cost. The main time efficiency arises from having eight leaves simultaneously acclimate to saturating CO2 and high light levels; the long acclimation periods for each leaf (13.8 min on average in this study) thus overlap to a large degree, rather than occurring sequentially. The cost efficiency arises partly from custom-building the system and thus avoiding commercial costs like distribution, marketing and profit, and partly from optimizing the system’s design for Amax throughput rather than flexibility for other types of measurements.
Conclusion
Throughput for Amax measurements can be increased greatly, on both a cost and time basis, by multiplexing gas streams from several leaf chambers connected to a single gas analyzer. This can help overcome the bottleneck in breeding and ecological research posed by limited phenotyping throughput for Amax.
Electronic supplementary material
The online version of this article (10.1186/s13007-018-0347-y) contains supplementary material, which is available to authorized users.
Keywords: Phenotyping, Photosynthesis, High-throughput, Gas-exchange, Photosynthetic capacity, Amax
Background
Leaf gas exchange traits are important in plant breeding, physiology and ecology research. The ability to measure such traits using mass produced, field portable gas exchange systems has made these systems a staple of many laboratories, and their impact on scientific progress cannot be overstated. However, these systems were designed to maximize portability and flexibility, and as a result, they are not optimized for maximal throughput in phenotyping studies. For example, because leaves can take around 12–15 min [1] to acclimate to saturating CO2 and light before measuring photosynthetic capacity (light-and CO2-saturated maximum net CO2 assimilation rate, Amax), throughput cannot exceed 4–5 measurements per hour with a single-chamber commercial system. Increasing throughput thus requires the purchase of a large number of units. These constraints on throughput are compensated by the flexibility and portability of commercial systems, which can rapidly change chamber conditions at the user’s command and can be carried by hand to measure plants in situ, even in difficult terrain. However, because that flexibility is expensive to engineer and implement, it is sub-optimal with respect to throughput and cost in phenotyping studies that do not require such flexibility.
Alternative high-throughput approaches for studying gas exchange, though highly promising, are typically indirect (e.g., NDVI, hyperspectral imaging, chlorophyll fluorescence, IR thermography), and nevertheless require calibration and validation against direct gas exchange measurements. Direct systems are often only practical for application to plants grown in small growth containers suitable for mechanized measurement (e.g., conveyor based systems, gravimetric systems) (for review of current high-throughput phenotyping technology see [2].
In this study, we describe a semi-portable gas exchange system, OCTOflux (Fig. 1), designed to maximize throughput of Amax measurements in field crops. Leaves are enclosed in eight chambers sequentially and exposed to saturating light and CO2 > 4000 ppm, as needed to ensure that variations in stomatal conductance do not influence measurements. Traditional CO2 response curves and modeling can be used in separate validation experiments to ensure that Amax is not substantially reduced by triose phosphate utilization at these high CO2 concentrations. Each chamber’s sample gas stream is channelled through an infrared gas analyzer for 60 s after acclimation is complete. CO2 is injected into a pressurized air stream from a tank using a mass flow controller, and reference gas composition is stabilized using a large buffer volume (~ 20 L). OCTOflux achieved an average throughput of 16.7 values of Amax per hour in a trial campaign using wheat; the total capital cost was ~ USD $31,000. Below, we describe the system in detail, present sample output data, and discuss modifications to further enhance throughput.
Fig. 1.
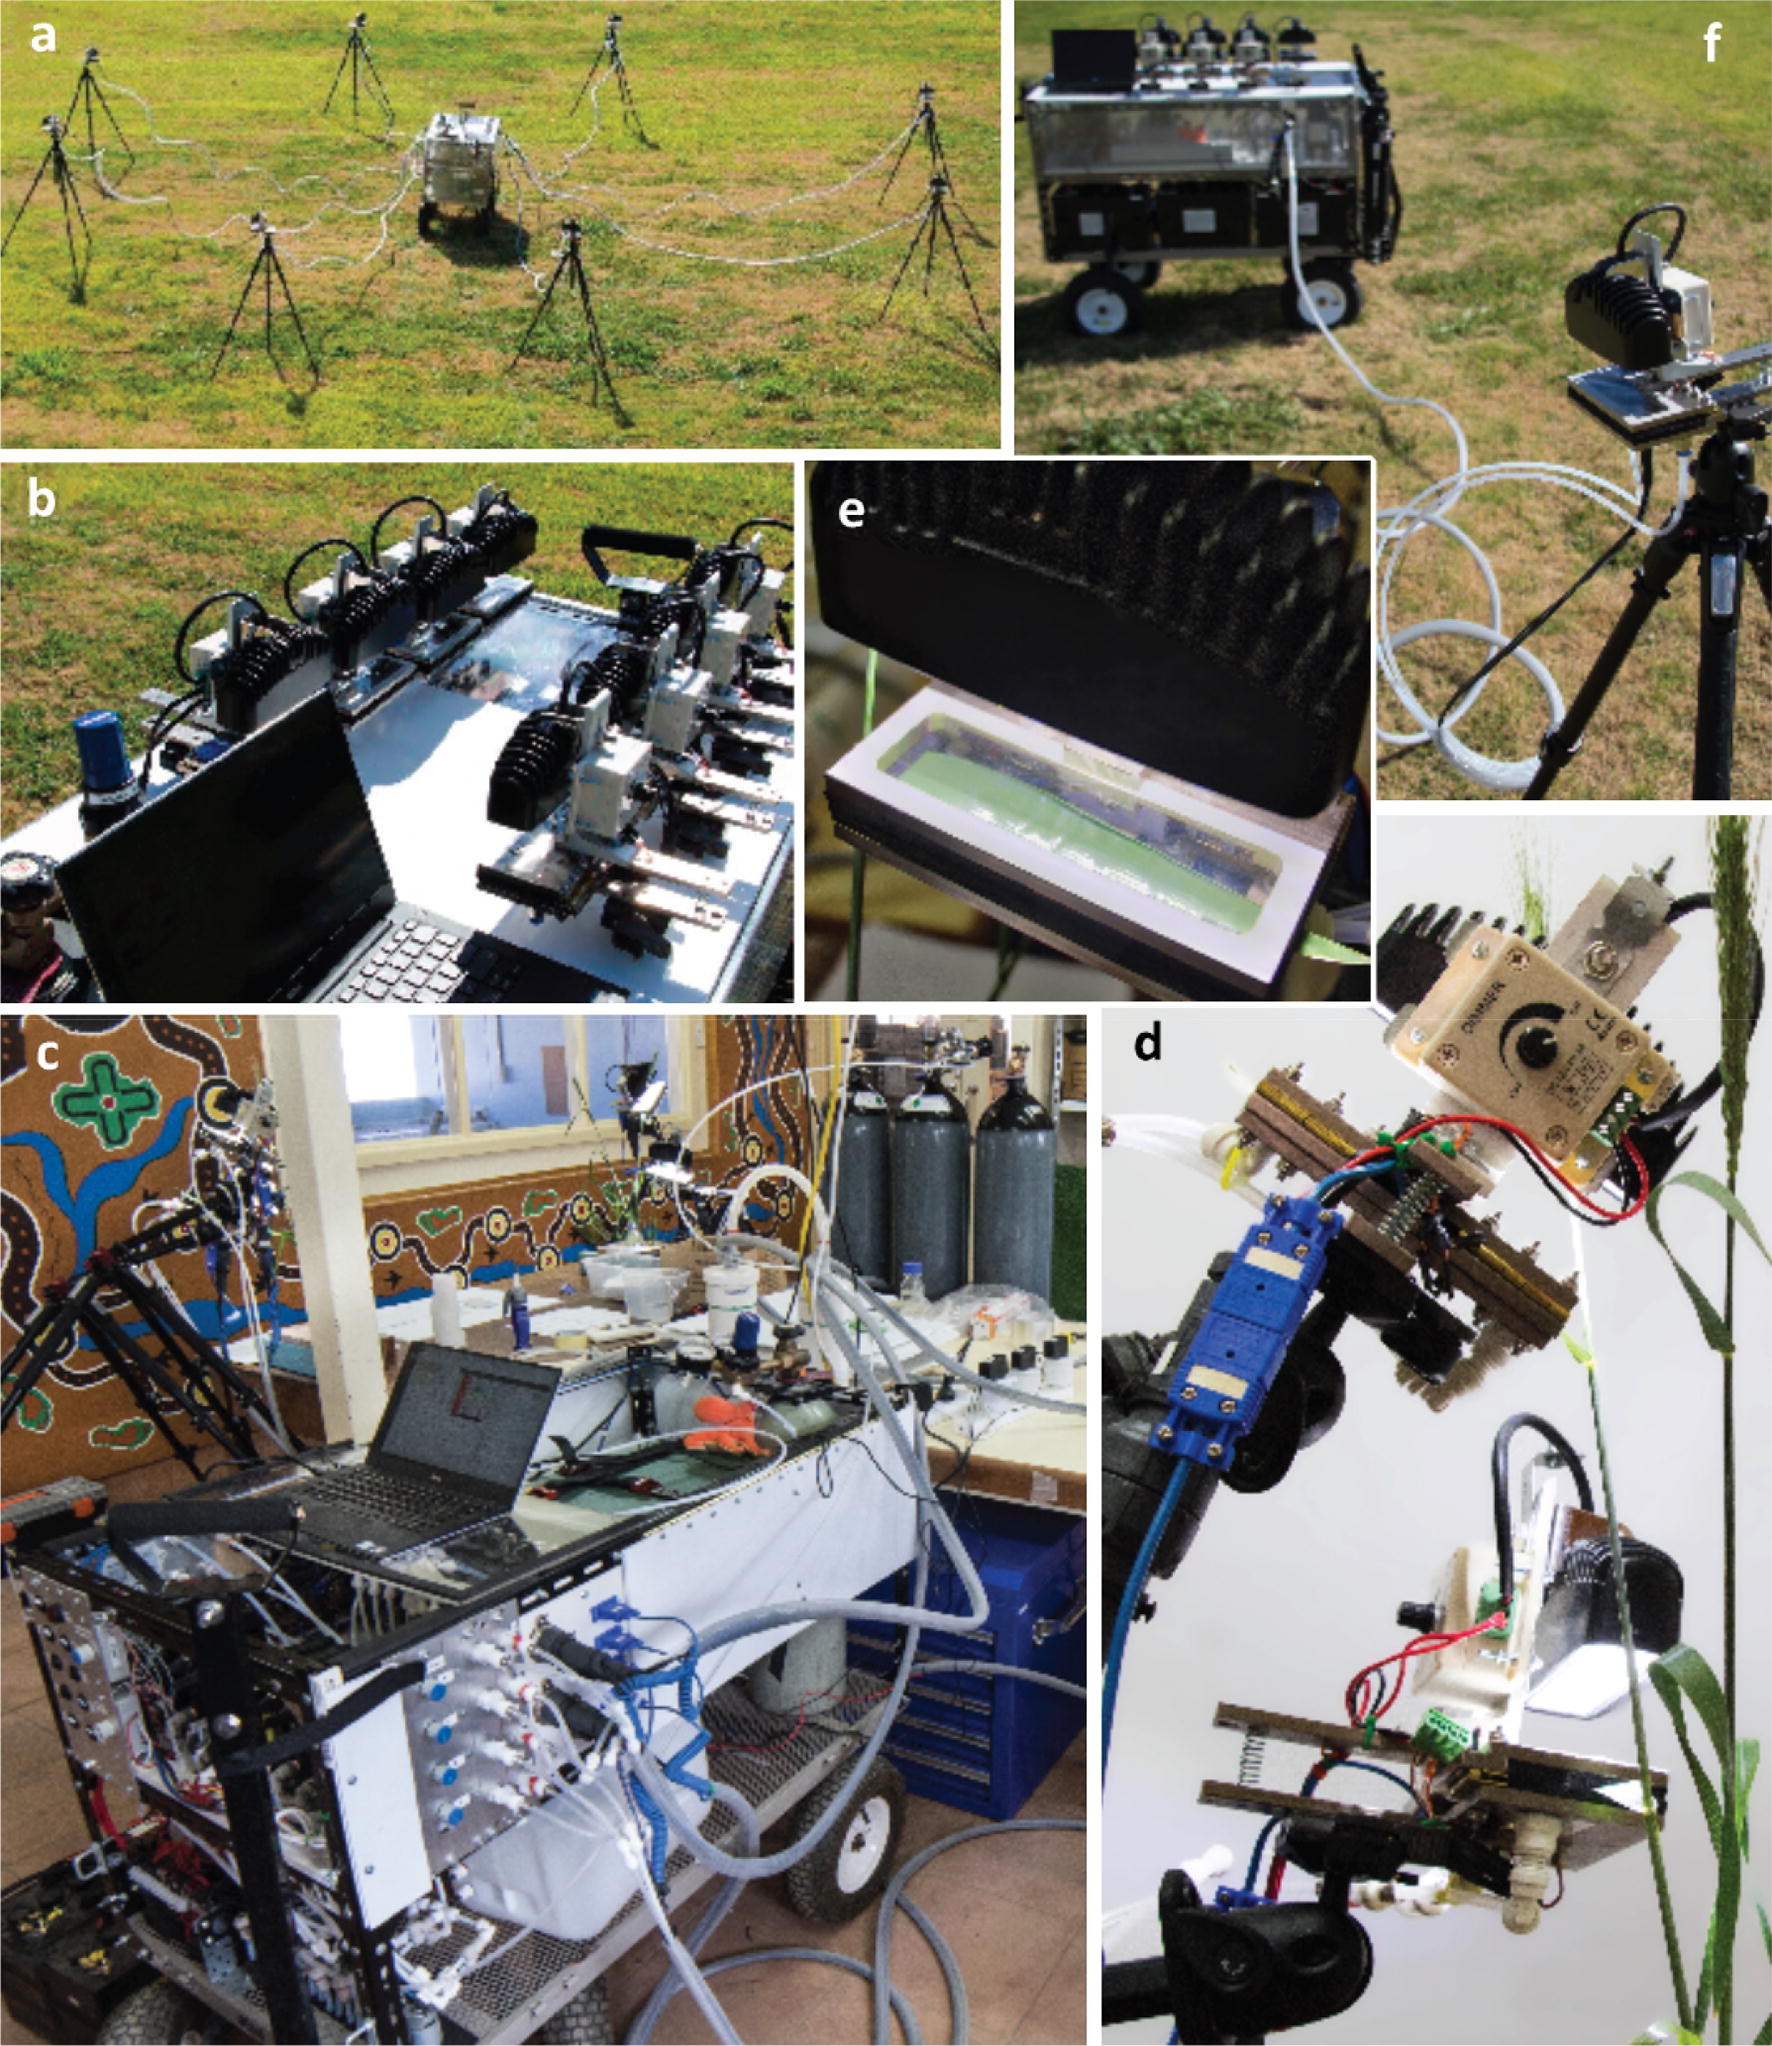
Photographs of OCTOflux. Clockwise from top left: a Mothership (center) connected to eight chambers on tripods. b Top deck of mothership, with chambers docked. CO2 regulator is visible at lower left. c OCTOflux in operation in the laboratory in Narrabri. Four chambers are visible at top left and top center, on tripods. Gas, power, data and thermocouple connections between chambers and the mothership are at lower center. d Two OCTOflux chambers measuring the flag leaf and second leaf of a single wheat tiller in the laboratory. e Wheat leaf in an OCTOflux chamber, below its LED light source (black object at top center). f An OCTOflux chamber connected to the mothership in the field (three truck batteries are visible on the lower level of the mothership)
Results
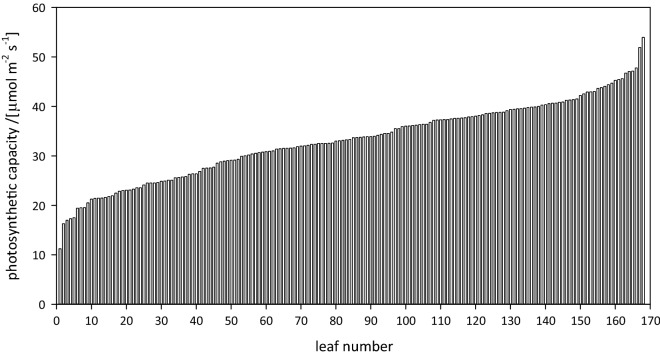
We completed 165 measurement cycles (1320 Amax measurements) over 12 days. Measurement cycle length averaged 28.7 ± 5.8 min (mean ± SD) and ranged from 17 to 50 min, with 90% of cycles taking between 21 and 40 min. Much of this variation arose from differences in photosynthetic acclimation time, and the rest resulted from logistical factors unrelated to OCTOflux. Sample data from a typical day (168 individual measurements of Amax) is shown in Fig. 2.
Fig. 2.
Processed output from 1 day of OCTOflux measurements: 168 measurements of photosynthetic capacity (Amax), each on a different leaf of wheat. These measurements were completed in approximately 7.5 h
Functional characteristics
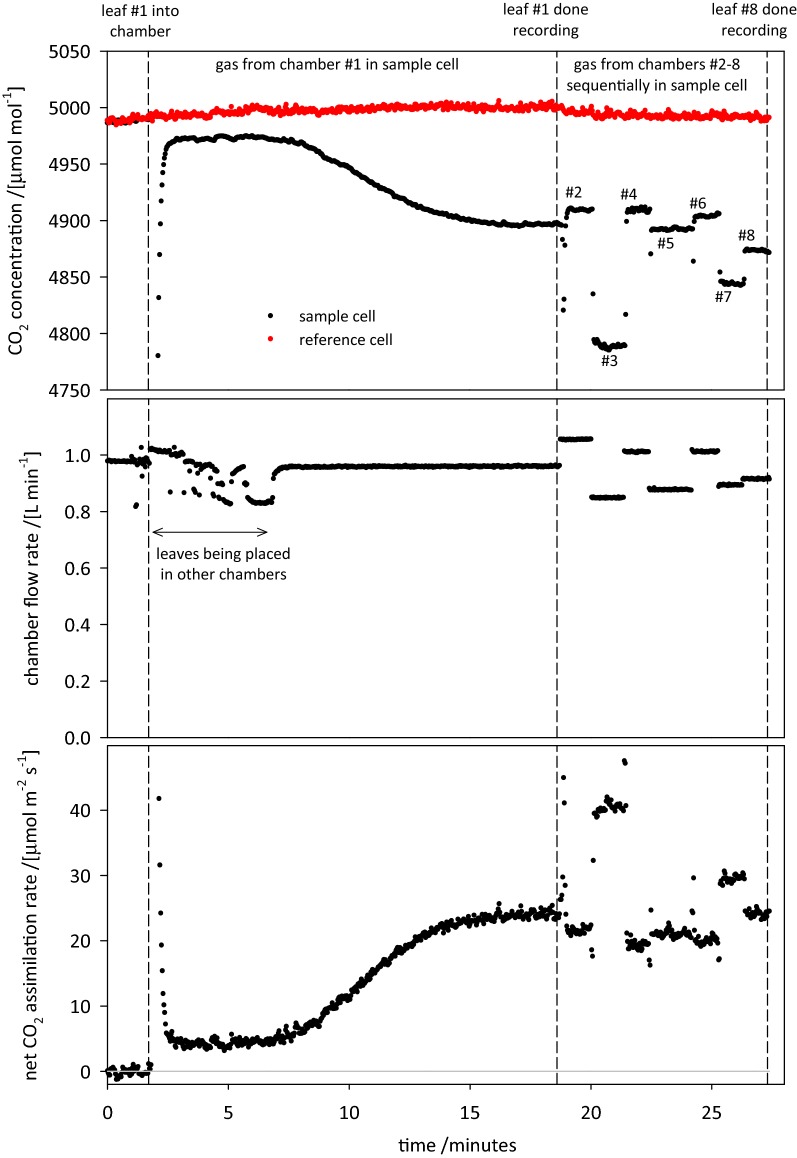
A typical measurement cycle is shown in Fig. 3. The trace for A begins with a mixing lag caused by small transient fluctuations in total system flow (and hence in the ratio of CO2 injection flow rate to total flow) while leaves are being placed in chambers. After 3 min, this mixing lag has passed. From the start of the recording until 18.6 min, gas from chamber #1 was flowing through the IRGA (infra-red gas analyser) sample cell, showing a typical sigmoidal acclimation response of A to saturating light. After that response stabilized, sample gas from each of the other seven chambers was sent through the analyzer sequentially, for 1 min each.
Fig. 3.
Sample OCTOflux measurement cycle. A leaf is placed in chamber #1 at the time indicated by the first dashed line; leaves are placed in the other seven chambers for the next several minutes (as evidenced by fluctuations in chamber flow rate (b). After around 16 min, the assimilation rate for leaf #1 has stabilized (second dashed line), and the solenoid valves are adjusted to direct sample gas from chamber #2 through the IRGA sample cell. This is repeated over the next 7 min for the remaining chambers. The cycle is complete when the 8th leaf is done recording
Chamber flow rates were set at approximately 1 L min−1 but varied among chambers due to minor differences in tubing length between the mothership and chambers. Flow rates also fluctuated while leaves #2–8 were being placed in chambers, due to the reduction in upstream gas pressure caused by temporarily opening each chamber to put a leaf into it (e.g., Fig. 3).
Empty chamber test
The value of A calculated with no leaf in the chamber, at a chamber [CO2] of 5140 ppm, averaged − 0.17 ± 0.06 μmol m−2 s−1 (mean ± SE) over 90 s (Fig. 4). Because we used a 40-s average of Amax in normal operating conditions, we computed the mean and standard error of Amax for every contiguous 40-s interval within the 90-s empty chamber test; the resulting mean and SE within these 40-s intervals varied between − 0.27 ± 0.10 to − 0.06 ± 0.09 μmol m−2 s−1 and averaged − 0.14 ± 0.10 μmol m−2 s−1. These results show that diffusion across the chamber gaskets was an insignificant component of measured A.
Fig. 4.
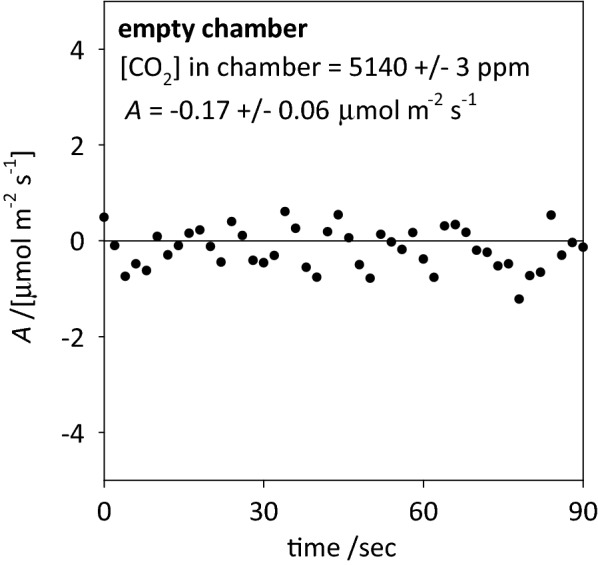
Net CO2 assimilation rate calculated for a chamber not containing a leaf, with [CO2] in the chamber of 5140 ppm and [CO2] outside the chamber at approximately 400 ppm
Leaks can also occur due to imperfect sealing around leaf midribs. We detected such leaks by noting when chamber flow rate was greater with leaves in the chamber than without, and in such cases we sealed the leak using clear silicone gap-filling compound. Leak sealing generally had no effect on calculated gas exchange rates, however, indicating that the leaks were predominantly advective and that the chamber air was thoroughly mixed (which together would ensure that leaked air had the same composition as air exiting the sample outlet, and thus did not affect gas exchange calculations).
Temperature responses
Amax relative to its value at 25 °C [Arel(T) = Amax(T)/Amax(25)] was exponentially related to leaf temperature: Arel(T) = 0.485977·exp(0.028831·[Tleaf/°C]) (residual df = 25, r2 = 0.963; Fig. 5).
Fig. 5.
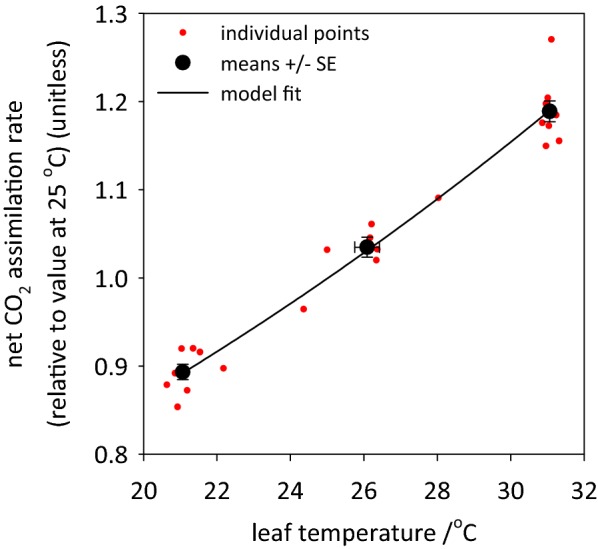
Temperature responses of Arel (Amax expressed relative to each leaf’s value at 25 °C). Red symbols = individual points (3 per leaf); solid black symbols = means ± SE within each temperature bracket; solid line = regression of Arel(T) versus Arel(25)·exp(bT)
Validation of TPU-limited Amax at high CO2 in relation to A versus ci parameters
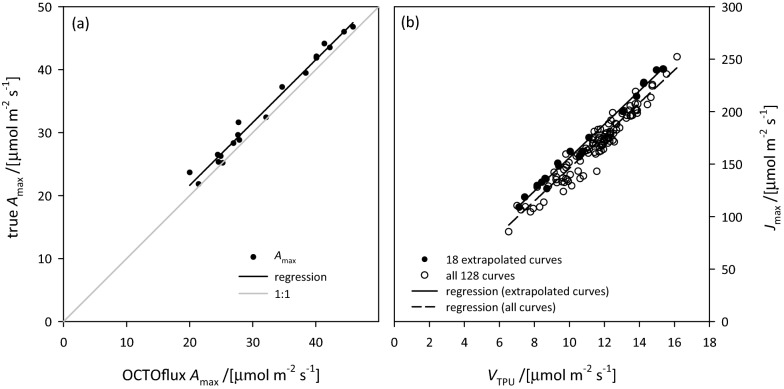
Because triose phosphate utilization (TPU) can limit Amax at high CO2, we investigated whether such an effect would have an influence on results measured at saturating CO2 in wheat. We obtained 19 A versus ci curves that had depressions in A at high CO2, and thus could be used for modelling the decline in A with increasing ci under TPU-limited conditions. Among these curves, the value of Amax projected at ci = 5000 ppm was proportional to the true Amax under electron transport limited conditions (Amax[OCTOflux] = 0.9968·Amax[e-tpt] + 1.7064; r2 = 0.9841, n = 18; Fig. 6a), and VTPU was proportional to Jmax (VTPU = 0.0622·Jmax + 0.298; r2 = 0.9911, n = 18; Fig. 6b, solid symbols). Among all A versus ci curves (including those for which TPU-limited points were inadequate to model the decline in A with increasing ci), VTPU was also proportional to Jmax, and with a slope similar to that found among the 18 curves described above (VTPU = 0.0597·Jmax + 1.3857, r2 = 0.9301, n = 128; Fig. 6b, open symbols).
Fig. 6.
Relationships between a true Amax (value under electron transport limited conditions) and OCTOflux Amax (value at high CO2 under TPU-limited conditions, estimated by extrapolating to high ci the Busch et al. [12] model for TPU-limited A fitted to A versus ci curve data for 18 A versus ci curves for which data were adequate for this purpose), and b VTPU and Jmax estimated from A versus ci curves for the 18 curves indicated in a (solid symbols) and for all 128 A versus ci curves measured (open symbols). In both a and b, regressions for the 18 curves are shown with solid lines (a: y = 0.9968x + 1.7064, r2 = 0.9841; b: y = 0.0622x + 0.298, r2 = 0.9911); in b, a regression for the open symbols is shown with a dashed line (y = 0.0597x + 1.3857, r2 = 0.9301)
Discussion
The OCTOflux system was able to measure Amax with far greater throughput than would have been possible using a single commercial system, and at far lower cost than possible using several commercial systems to match OCTOflux’s throughput. We achieved an average throughput of 16.7 measurements of Amax per hour—4.4 times greater than the 3.8 measurements per hour possible with a single-chamber commercial system, given the mean time for acclimation of Amax to saturating PPFD (13.8 ± 0.4 min to reach 95% of Amax; mean ± SE, n = 131 leaves; data not shown) and allowing 2 min per measurement to enclose a leaf in the chamber, then remove it and measure its area (in cases where the leaf does not completely fill the chamber of a commercial system). The acclimation delay could in theory be avoided by having many leaves acclimate under saturating PPFD in a system outside of the IRGA chamber for 15–20 min, although this would generate some expense and workload, and it would be necessary to ensure that the external PPFD was at least as great as the chamber PPFD to avoid any subsequent acclimation delay. Alternatively, one could operate four or five single-chamber systems concurrently, but this would increase the capital cost dramatically. For example, a Li-Cor Li-6800 costs ~ USD $50,000 at the time of writing, so achieving OCTOflux’s throughput would require at least $200,000 in capital expenditure. By comparison, OCTOflux cost approximately USD $31,000 to construct, giving roughly seven times greater throughput per unit capital cost.
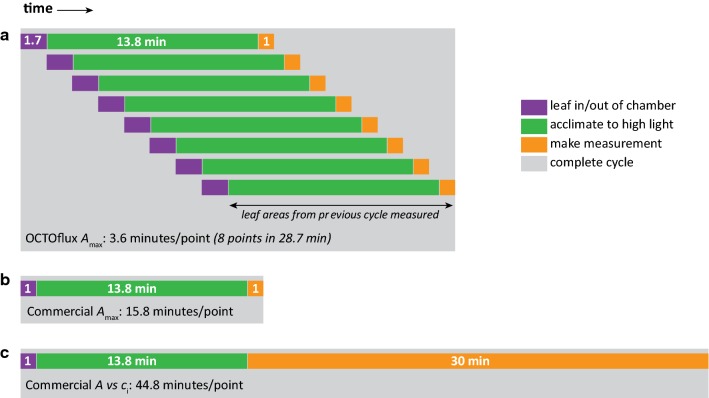
There are two main reasons for OCTOflux’s greater throughput. First, allowing multiple leaves to simultaneously acclimate to saturating light and CO2 reduces the IRGA’s downtime (Fig. 7). This efficiency could be further enhanced by adding more chambers. Throughput (t, measurements per unit time) is given by
| 1 |
where n = number of chambers, i = time required to put each leaf into a chamber, p = time to remove each leaf from the chamber, a = time for each leaf to acclimate to chamber conditions, and r = time allowed to record stable gas exchange for each leaf. Because Eq. 1 is a monotonically increasing function of n, adding chambers always increases throughput. For example, given the values for t, a, r in this study (16.7 leaves per hour, 13.8 and 1.0 min, respectively, giving i + p = 1.7 min), the throughput with 16 chambers would be 22.5 measurements per hour, or six times the throughput of a single-chamber system. Realistically, space constraints would eventually limit the number of chambers that can practically be operated. For measurements where acclimation time is short (e.g., 2 min) the eight chamber OCTOflux would still have a throughput advantage over commercial single chamber systems (on the order of twice the throughput). In short, although commercial gas exchange systems unquestionably have many advantages over OCTOflux (see Limitations of OCTOflux, and potential extensions and improvements, below), the OCTOflux approach—multiple chambers and a single IRGA—can greatly increase throughput per unit capital cost and per unit time in studies involving gas exchange measurements that require substantial in-chamber acclimation time.
Fig. 7.
Diagram of workflow for three methods of measuring photosynthetic capacity (Amax) by gas exchange (a Amax measured with OCTOflux; b Amax measured with a commercial single-chamber system; c Amax and other parameters inferred from A vs ci curves measured with a commercial single-chamber system), illustrating the reason for OCTOflux’s greater throughput per unit time: namely, in Amax measurements with single-chamber commercial systems b, the gas analyzer sits idle while the leaf acclimates to saturating light (which took an average of 13.8 min in the present study). Traditional A versus ci curves c take much longer still (approximately 30 min to complete measurements, vs ~ 1 min to complete a spot measurement of Amax), although they do provide much more information than Amax. Note in a that measurement of leaf areas from one OCTOflux measurement cycle can be completed during the idle time of the next cycle
Comparison to high-throughput methods for phenotyping photosynthetic traits
High throughput phenotyping platforms (HTPPs) have been heralded as the future of plant breeding and are already changing the nature of breeding research [3]. Most HTPPs are based on indirect canopy measurements such as thermal imagery, hyperspectral reflectance, NDVI, LIDAR and infrared thermography (for estimating transpiration), which offer orders of magnitude greater throughput than traditional methods. For example, a rotocopter drone fitted with imaging sensors could phenotype an entire field within 1 h [4]. HTPPs have also been established in glasshouses or controlled environment facilities, where sensors can be larger and more powerful and can continually monitor physiology, and where potted plants can be moved around using automated conveyor systems and weighed to monitor growth and water use.
Current HTPPs have two major limitations. First, some HTPP systems, notably automated systems, are prohibitively expensive, which limits their potential for widespread phenotyping in different environments. Second, and more generally, HTPPs measure indirect proxies for Amax, with calibrations that can vary across plant species, genotypes, developmental stages and field conditions [5]. Thus, such proxies require intensive validation against direct gas exchange measurements. Field validation has thus far been limited to small sets of genotypes/species with limited replication, due to throughput constraints of single-chamber gas exchange systems [6–8]. Traits measured using indoor HTPPs on potted plants may differ greatly from those measured in field conditions [9], which questions their applicability in agronomic or ecological contexts. OCTOflux can facilitate the validation of field-based HTPPs.
Comparison to measurements based on photosynthetic A versus ci curves
The standard method for measuring photosynthetic capacity in plant physiology has for many years been to measure the response of A to ci, fit a biochemical model [10] and extract the resulting parameters of photosynthetic capacity (Vcmax and Jmax). One value of that approach is that A vs ci curves are independent of stomatal effects (provided stomatal conductance is not spatially heterogeneous or “patchy”). By measuring A at very high ambient CO2 (> 4000 ppm), at which stomata no longer influence A, OCTOflux has the same benefit. However, OCTOflux provides less information than an A vs ci curve: in fact, the value of Amax measured by OCTOflux represents a value limited by the rate of triose phosphate utilization (VTPU) or RuBP-regeneration (Jmax). Our A versus ci curve data showed that VTPU is an excellent predictor of Jmax, and that the CO2-saturated value of Amax reported by OCTOflux is an excellent predictor of the “true” Amax, which occurs at the point of transition between electron transport limitation and TPU limitation: OCTOflux Amax was linearly related to true Amax with a slope of 0.9968 and an r2 of 0.9841 across 18 leaves ranging in Amax from 20 to 46 μmol m−2 s−1). Thus, OCTOflux provides a faithful estimate of photosynthetic capacity as estimated from A versus ci curves. Despite providing less information than A versus ci curves, OCTOflux-based Amax estimates have the advantage that they do not depend on estimation of ci (which is more uncertain than Amax because it depends on the ratio of A to stomatal conductance, and thus compounds errors in CO2 and H2O exchange and leaf temperature measurement), nor on estimation of mesophyll conductance, gm, which determines the relation of chloroplastic CO2 concentration (cc) to ci. We suggest that, in phenotyping studies in which the detailed information provided by A versus ci curves in conjunction with gm estimation is not needed, OCTOflux provides a sound and efficient alternative.
Limitations of OCTOflux, and potential extensions and improvements
Just as single-chamber systems are not optimized for throughput, OCTOflux is not optimized for many experimental situations. First, the system is too large for use in rough or remote terrain. Second, it has no humidity control, although this could be rectified by adding a high-capacity humidifier and a system for mixing dry and humid air. Third, it lacks leaf temperature control. Peltier temperature controllers could be added to each chamber, though this would greatly increase power demand, reducing the feasibility of operating the system under field conditions without AC power. Fourth, many commercial systems can measure chlorophyll fluorescence parameters, but adding such capacity to multiple chambers in an OCTOflux-type system would greatly increase cost and complexity. Finally, using a large buffering volume to stabilize reference gas composition prevents rapid changes in [CO2] needed for CO2 response curves. This could be partially rectified by eliminating the buffer volume and extending the recording time for measurements of Amax to average over the fluctuations in CO2 that would result.
As currently configured, use of OCTOflux in the field is limited mainly by power and gas supplies. The large air cylinders used in the lab would limit the system’s mobility in the field; they could be replaced by a pump and scrubbers to remove H2O and CO2 from ambient air. The current design has room for four 12-V truck batteries on the lower shelf, which was adequate for 6 h of field operation in an earlier, pump-driven prototype with a different IRGA (which consumed less power than the Li-7000). However, temperature control would be more important under field conditions, greatly increasing power requirements. Possible solutions include towing a second garden cart filled with truck batteries, or using a portable electric generator to power the system. Whether such solutions are feasible would depend on the particular field situation; for example, they would pose little challenge for phenotyping row crops on relatively level ground.
We plan to modify OCTOflux in several ways to improve its performance, control and throughput. Some of these improvements were described earlier, including adding Peltier temperature controllers to each chamber and adding humidity control. Adding more chambers and using shorter chamber-IRGA connections would increase throughput and reduce settling time. Using a pre-mixed air tank with the desired reference gas CO2 composition would reduce noise in the IRGA CO2 differential, improving resolution and reducing measurement averaging time.
Conclusion
Multiplexing gas streams from eight leaf chambers connected to a single IRGA increases the throughput for Amax measurements approximately four- to seven-fold on a time or capital cost basis, respectively, and further increases in throughput are possible using even more chambers. This approach can help overcome the bottleneck in breeding and ecological research posed by limited phenotyping throughput for physiological traits.
Methods
OCTOflux overview
The OCTOflux system consists of eight leaf chambers connected to a “mothership,” built on a 1.2 × 0.6 m garden cart modified with steel framing to produce three levels (Fig. 1). The mothership houses a differential CO2/H2O infrared gas analyzer (Li-7000, Li-Cor, Lincoln, NE), and numerous other components described below. The system is designed to be used either in the field or in the laboratory, although its utility in the field is limited by the lack of chamber temperature control in the current implementation. In this study, we operated the system in an air-conditioned laboratory to reduce variation in leaf temperature, increase operating time by using AC power for some components, and increase throughput by eliminating the need to move the system (including eight tripods and chambers) between plots in the field and to enable real-time processing of leaf images and measurement cycle metadata on a laboratory computer.
Leaf chambers
Each chamber is made from custom machined, nickel-plated aluminum parts, and includes four small mixing fans (UB3F3-500, SUNON, Kaohsiung City, Taiwan), a type-T fine-wire (36 gauge) thermocouple (TT-T-36-100, OMEGA Engineering, INC., Norwalk, CT, USA) and an LED light source (WL-18 W-O60, Super Bright LEDs, Inc., St. Louis, MO, USA) situated above a propafilm window. These chambers were designed for wheat leaves, enclosing an area of up to 11 × 5 cm, with an internal volume of approximately 90 cm3.
Flow pattern and operational principle
Compressed air is injected into a buffer volume through a dual-stage regulator and a mass flow controller (MFC; FMA5420, Omega Engineering, Inc.) (Fig. 8). CO2 is injected into the buffer through a regulator and MFC (FMA5412, Omega). Buffer air is mixed with a 12 V CPU fan (PF40281B1-000U-G99, Sunon, Brea, CA, USA). Air exits the buffer through nine separate 1/4″ o.d. tubes (one per leaf chamber + a reference line). Each chamber line goes through a mass flow meter (MFM; 822-13-0D1-PV1-V1 MFM, Sierra Instruments, Monterey, CA, USA) and then through 5 m of 1/4″ tubing to a leaf chamber and back (3/16″ i.d. for tubing going to the chambers, and 1/8″ i.d. for tubing returning from chambers), before splitting to two one-way direct acting solenoid valves (2ACK-1/4, WIC valve, San Jose, CA, USA), termed the “sample” and “null” valves. The null valves vent to the atmosphere and the sample valves lead to the IRGA sample cell. The reference stream splits three ways: one line goes to the IRGA reference cell and the other two form sample and null lines, like the chamber lines. Flow rates of 0.5–2.0 L min−1 were possible with this system, representing turnover times of approximately 7.5–30 s; a flow rate of 1 L min−1 (turnover time 15 s) was typical in operation.
Fig. 8.
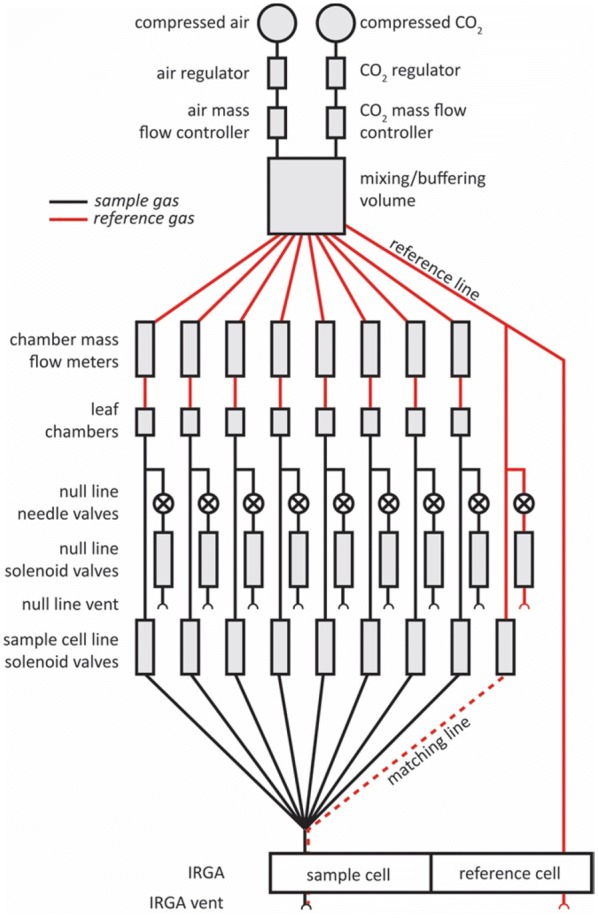
Functional schematic of OCTOflux system. Open semicircles represent atmospheric vent points. CO2 is injected into a stream of pressurized air, mixed in a buffering volume and distributed to eight chambers and a reference line. The return line of each chamber is either vented through its null line vent or directed through the IRGA sample cell using solenoid valves
At any given time, only one of the nine sample solenoid valves is open, so only one gas source (one of the eight chamber lines or the reference line) flows into the IRGA sample cell; that line’s null valve is closed, and the null valves for the other eight lines are open. To “match” the IRGA, the reference line’s sample valve is opened and all chamber sample valves are closed, so that the same (reference) gas flows through both IRGA cells. Each null valve is preceded in the flow path by a needle valve, which enables the user to match flow resistances among lines to prevent changes in chamber flow rate when switching between chamber lines. Whenever the gas source entering an IRGA cell is changed, it takes approximately 15 s to turn over the air in the IRGA cell (for a chamber line flow rate of 1 L min−1), after which the IRGA CO2 and H2O differentials can be used to calculate current gas exchange rates [11].
Data acquisition and processing and system control
The system is interrogated and controlled by a Microsoft Excel file that uses Visual Basic for Applications (VBA) to interface with the IRGA, a data acquisition board and a relay control board (USB-2416-4AO and USB-ERB24, Measurement Computing Corporation, Norton, MA, USA) in real time via Visual Basic functions in a DLL (see Additional files 1 and 2 for the Excel file and VB code, respectively). The Excel file uses Forms Controls to manipulate the system and real-time graphs of the data. The relay control board drives solid-state relays (DC60S3-B, Crydom, San Diego, CA, USA) that control voltage supplies to the solenoid valves. Control and measurements are performed every 2 s. We emphasize that the general approach presented in this study could be implemented using any suitable data acquisition and control system.
Operational procedure
A typical OCTOflux cycle of eight Amax measurements involves five stages: enclosing leaves in chambers (~ 2–5 min total for eight leaves), waiting for A to stabilize at Amax (~ 8–25 min), sequentially routing each chamber’s sample gas through the analyzer to record its stable A value (7 min; 40–60 s per chamber), removing leaves from chambers (~ 1–2 min), and photographing leaves and measuring the leaf area enclosed in the chamber (~ 5 min). We performed the last (photographing) stage of each measurement cycle during the acclimation stage of the following cycle.
Validation of Amax measurement
At very high CO2 concentration such as measured by OCTOflux, net CO2 assimilation rate can be limited by triose phosphate utilization (TPU; i.e., photoassimilate export) rather than by the capacities for RuBP carboxylation or electron transport (Vcmax and Jmax, respectively), and it is unknown whether the maximum TPU rate (VTPU) is strongly correlated with Jmax. Furthermore, A can decline with increasing intercellular CO2 concentration (ci) when TPU is limiting, so TPU-limited Amax can be lower than the “true” (electron transport-limited) Amax. Busch et al. [12] recently showed that the decline in A with [CO2] under TPU-limited conditions is caused by quenching of non-photosynthetic CO2 assimilation (via C incorporation into amino acids in the photorespiratory cycle). However, this quenching saturates as glycine and serine export rates approach biochemical limits, so that A does not continue to decline indefinitely as ci increases.
To validate the interpretation of OCTOflux’s high-ci Amax measurement in relation to electron transport-limited Amax, we measured A vs ci curves in 128 leaves of 30 wheat genotypes. The curves were made with two recently calibrated IRGAs (GFS-3000; Heinz Walz GmbH, Effeltrich, Germany), by changing ca in 13 steps (400, 50, 100, 150, 250, 350, 400, 600, 800, 1000, 1200, 1500 and 2000 µmol mol−1) over 45 min using a PAR of 2000 µmol m−2 s−1 and a temperature of 25 °C. These response curves used a 4 × 2 cm leaf chamber, a leaf to air vapor pressure difference of 1.5 ± 0.2 kPa (mean ± SD) and a chamber flow rate of 750 μmol s−1. We then fitted the Farquhar et al. [10] photosynthesis model to each curve, using the ‘plantecophys’ package in R (bilinear fitting method with TPU limitation estimate; [13], to estimate Vcmax, Jmax and VTPU. We then fitted the model proposed by Busch et al. [12] to the TPU-limited portion of A versus ci curves in cases where enough data were available (4 or 5 TPU-limited points) and A was unambiguously declining with increasing ci (which we defined as no more than one deviation from a monotonically declining relationship among the 4–5 points), and used the model to extrapolate A to its value at 5000 ppm to estimate the value of Amax that OCTOflux would give for that leaf.
Calibration
We calibrated the IRGA for H2O using dry air (scrubbed using Drierite) and using ambient air, both also measured with a chilled mirror dewpoint hygrometer (Dew-10, General Eastern, GE, Billerica, MA, USA), and for CO2 using CO2-free air (scrubbed using soda lime) and reference tanks of 360 and 1190 ppm. Previous calibrations showed negligible span drift over time. We matched the IRGA sample and reference cells using reference air several times daily. We found that match drift was negligible with this analyzer if ambient temperature was stable and gas concentrations did not differ greatly between successive measurements, provided the instrument was warmed up for ≥ 2 h. During this study, we kept the analyzer running 24 h per day.
We calibrated the MFMs and MFCs by first calibrating one MFC volumetrically (recording the time required for air flow at each of several different flow rates to displace 1–2 L of water with no pressure head in an inverted graduated cylinder, nested within a larger cylinder), and then placing the remaining MFMs and MFC in series with the calibrated MFC and recording their outputs at a series of controlled flow rates. We placed a Li-Cor quantum sensor (Li-190R) at various distances from each chamber’s light source to determine the leaf-to-light distance required to produce a saturating PPFD of 1700 μmol m−2 s−1 at the leaf surface.
We measured the leaf area enclosed in each chamber by marking the leaf at the external gasket margins, removing the leaf and taking a digital photograph of the enclosed leaf segment over a template representing the chamber and its gaskets, binarizing these images in ImageJ to produce an image with distinct white and black areas representing chamber areas with and without leaf, respectively, quantifying the % black pixels in the entire chamber area and multiplying the result by total chamber area (55 cm2).
To ensure that calculated Amax was not influenced by diffusion of CO2 across chamber gaskets, we recorded A with no leaf in the chamber and chamber CO2 concentrations in the typical range for this study (~ 4800–5000 ppm).
System cost
The total cost of OCTOflux was approximately USD $31,000 (Table 1), 60% of which was the IRGA (USD $18,311), and another 30% of which was the eight sample MFMs (@ USD $647), two MFCs (@ USD $820), a laptop computer (USD $1725) and the DAQ board (USD $1493). The only significant running cost was compressed air (approximately 0.7–1 G-size cylinders/day or roughly USD $14–20/day or ~ $0.13–$0.18 per measurement; this cost may differ among countries or regions).
Table 1.
OCTOflux components and approximate costs in USD in 2016–2017
| Item | Count | Unit cost | Total cost |
|---|---|---|---|
| Gas analyzer | 1 | 18,311 | 18,311 |
| Mass flow meters | 8 | 647 | 5176 |
| Mass flow controllers | 2 | 820 | 1640 |
| Laptop computer | 1 | 1725 | 1725 |
| Data acquisition board | 1 | 1493 | 1493 |
| Gas regulators | 2 | 250 | 500 |
| Hardware, materials | 1 | 500 | 500 |
| Tubing, fittings, valves | 1 | 500 | 500 |
| LED lights and regulators | 8 | 56 | 450 |
| Relay control board | 1 | 443 | 443 |
| Solenoid valves | 18 | 17 | 306 |
| Garden cart | 1 | 150 | 150 |
| Total | $31,193 |
Temperature correction
OCTOflux does not include leaf temperature (T) control. To minimize temperature fluctuations, we operated the system in an air-conditioned workshop; leaf T in the OCTOflux chamber averaged 26.0 ± 1.7 °C (mean ± SD), and 80% of measurements were between 24.1 and 28.2 °C. To correct Amax values to a common temperature of 25 °C, we determined the relationship between Amax and T as follows. We measured Amax at three temperatures (21.1 ± 0.1, 26.1 ± 0.3 and 31.1 ± 0.05 °C) in each of 10 leaves, using a calibrated infrared gas analyser (GFS-3000; Heinz Walz GmbH, Effeltrich, Germany). For each leaf, we fitted the function Amax(T) = a·exp(b·T) to the data, computed Amax25 for that leaf as a·exp(b·25), and expressed each Amax value for that leaf relative to its Amax25, as Arel = Amax(T)/Amax25. We then compiled Arel values across leaves for each temperature, fitted the function Arel(T) = a′·exp(b′·T) to them and used this function to infer Amax25 for each observed value of Amax in the study.
Plant material
Leaves were chosen haphazardly from among flag (first-rank) and penultimate (second-rank) leaves of wheat (Triticum aestivum L.) as part of a broader study. Each leaf was from a different genotype; the complete genotype list is given in Additional file 3. All plants were grown in the field at the University of Sydney’s IA Watson Grains Research Centre, Narrabri, NSW Australia (30.2743°S, 149.8093°E). Plants were sown in 2 × 6 m plots with five planting rows, and lanes were later mowed between adjacent ranges of plots, making each plot 2 × 4 m at the time of measurement. Most plants were approximately at anthesis, and ranged in phenological stage from Zadok stage 57–71 (ear three quarters emerged to kernel water ripe, respectively).
Plants were haphazardly selected from the middle three planting rows at least 0.5 m from the end of each plot and cut at the base, immediately recut under distilled water and returned to the laboratory for measurement (approx. 2 km from the field), and then dark-acclimated for 0–60 min before measurement. Stomatal conductance typically exhibits a transient decline following plant or leaf excision in water, followed by a steady-state increase; analogous transients following excision in air averaged 6.7 min in duration across 20 species [14], and 2.0 min in the grass Hordeum vulgare (barley), which is closely related to wheat. These transients did not affect our estimates of Amax in the present study, because at least 20 min passed between excision and the final Amax measurement, but more importantly because leaves experienced saturating CO2, negating the impact of variations in stomatal conductance.
Additional files
Additional file 1. Microsoft Excel file with VBA code that controls the OCTOflux system.
Additional file 2. VB.net code for DLL functions that handle communications between VBA and peripherals.
Additional file 3. List of genotypes used in trial application of the OCTOflux system.
Authors’ contributions
MEG conceived of the multiplexed gas exchange approach, and designed and machined the leaf chambers. All authors designed the OCTOflux system. WTS and TNB built the system, collected and analyzed the data and drafted the manuscript. All authors edited and revised the manuscript. All authors read and approved the final manuscript.
Acknowledgements
The authors thank Julie Lintz, Kathryn Dumschott and Maria Ruz Ruiz for technical assistance.
Competing interests
The authors declare that they have no competing interests.
Availability of data and materials
The datasets used and analysed during the current study are available from the corresponding author on reasonable request.
Funding
This research was supported by the International Wheat Yield Partnership, through grants provided by the Grains Research and Development Corporation (US00082) and CIMMYT (IWYP89FP). TNB was supported by the Australian Research Council (DP150103863 and LP130100183) and the National Science Foundation (Award #1557906). This work was supported by the USDA National Institute of Food and Agriculture, Hatch project 1016439.
Publisher’s Note
Springer Nature remains neutral with regard to jurisdictional claims in published maps and institutional affiliations.
Contributor Information
William T. Salter, Email: william.salter@sydney.edu.au
Matthew E. Gilbert, Email: megilbert@ucdavis.edu
Thomas N. Buckley, Email: tnbuckley@ucdavis.edu
References
- 1.Taylor SH, Long SP. Slow induction of photosynthesis on shade to sun transitions in wheat may cost at least 21% of productivity. Philos Trans R Soc B Biol Sci. 2017;372(1730):9. doi: 10.1098/rstb.2016.0543. [DOI] [PMC free article] [PubMed] [Google Scholar]
- 2.Fiorani F, Schurr U. Future scenarios for plant phenotyping. In: Merchant SS, editors. Annual review of plant biology, vol 64, annual reviews, Palo Alto; 2013, p. 267–91. [DOI] [PubMed]
- 3.Araus JL, Cairns JE. Field high-throughput phenotyping: the new crop breeding frontier. Trends Plant Sci. 2014;19(1):52–61. doi: 10.1016/j.tplants.2013.09.008. [DOI] [PubMed] [Google Scholar]
- 4.Sankaran S, Khot LR, Espinoza CZ, Jarolmasjed S, Sathuvalli VR, Vandemark GJ, Miklas PN, Carter AH, Pumphrey MO, Knowles NR, et al. Low-altitude, high-resolution aerial imaging systems for row and field crop phenotyping: a review. Eur J Agron. 2015;70:112–123. doi: 10.1016/j.eja.2015.07.004. [DOI] [Google Scholar]
- 5.Cobb JN, DeClerck G, Greenberg A, Clark R, McCouch S. Next-generation phenotyping: requirements and strategies for enhancing our understanding of genotype-phenotype relationships and its relevance to crop improvement. Theor Appl Genet. 2013;126(4):867–887. doi: 10.1007/s00122-013-2066-0. [DOI] [PMC free article] [PubMed] [Google Scholar]
- 6.Serbin SP, Singh A, Desai AR, Dubois SG, Jablonsld AD, Kingdon CC, Kruger EL, Townsend PA. Remotely estimating photosynthetic capacity, and its response to temperature, in vegetation canopies using imaging spectroscopy. Remote Sens Environ. 2015;67:78–87. doi: 10.1016/j.rse.2015.05.024. [DOI] [Google Scholar]
- 7.Heckmann D, Schluter U, Weber APM. Machine learning techniques for predicting crop photosynthetic capacity from leaf reflectance spectra. Mol Plant. 2017;10(6):878–890. doi: 10.1016/j.molp.2017.04.009. [DOI] [PubMed] [Google Scholar]
- 8.Yendrek CR, Tomaz T, Montes CM, Cao YY, Morse AM, Brown PJ, McIntyre LM, Leakey ADB, Ainsworth EA. High-throughput phenotyping of maize leaf physiological and biochemical traits using hyperspectral reflectance. Plant Physiol. 2017;173(1):614–626. doi: 10.1104/pp.16.01447. [DOI] [PMC free article] [PubMed] [Google Scholar]
- 9.Poorter H, Fiorani F, Pieruschka R, Wojciechowski T, van der Putten WH, Kleyer M, Schurr U, Postma J. Pampered inside, pestered outside? Differences and similarities between plants growing in controlled conditions and in the field. New Phytol. 2016;212(4):838–855. doi: 10.1111/nph.14243. [DOI] [PubMed] [Google Scholar]
- 10.Farquhar GD, Caemmerer SV, Berry JA. A biochemical-model of photosynthetic CO2 assimilation in leaves of C-3 species. Planta. 1980;149(1):78–90. doi: 10.1007/BF00386231. [DOI] [PubMed] [Google Scholar]
- 11.von Caemmerer S, Farquhar GD. Some relationships between the biochemistry of photosynthesis and the gas-exchange of leaves. Planta. 1981;153(4):376–387. doi: 10.1007/BF00384257. [DOI] [PubMed] [Google Scholar]
- 12.Busch FA, Sage RF, Farquhar GD. Plants increase CO2 uptake by assimilating nitrogen via the photorespiratory pathway. Nat Plants. 2018;4(1):46–54. doi: 10.1038/s41477-017-0065-x. [DOI] [PubMed] [Google Scholar]
- 13.Duursma RA. Plantecophys—an R package for analysing and modelling leaf gas exchange data. PLoS ONE. 2015;10(11):13. doi: 10.1371/journal.pone.0143346. [DOI] [PMC free article] [PubMed] [Google Scholar]
- 14.Buckley TN, Sack L, Gilbert ME. The role of bundle sheath extensions and life form in stomatal responses to leaf water status. Plant Physiol. 2011;156(2):962–973. doi: 10.1104/pp.111.175638. [DOI] [PMC free article] [PubMed] [Google Scholar]
Associated Data
This section collects any data citations, data availability statements, or supplementary materials included in this article.
Supplementary Materials
Additional file 1. Microsoft Excel file with VBA code that controls the OCTOflux system.
Additional file 2. VB.net code for DLL functions that handle communications between VBA and peripherals.
Additional file 3. List of genotypes used in trial application of the OCTOflux system.
Data Availability Statement
The datasets used and analysed during the current study are available from the corresponding author on reasonable request.


