Abstract
Background:
The rising burden of obesity is a threat to both developed and developing countries. Obesity is a killer lifestyle disease. Different aspects of the local environment play a key role in the occurrence of obesity. The present study was conducted to determine the prevalence of obesity among adult, its associated factors, and its relationship with retail food outlet density in Srikot, Uttarakhand.
Materials and Methods:
This study was a community-based cross-sectional study, carried out in Srikot, Uttarakhand, in 2016 among 155 adults systematically sampled, aged above 20 years. A semi-structured pretested questionnaire was used to interview the participants, and anthropometry measurements were done. The details regarding the geographic location and count of outlets were carried out. Obesity was considered body mass index ≥25 kg/m2.
Results:
In the present study, 61.3% were females. The mean age of the study participants was 38.3 (±13.6) years. The prevalence of overweight was 14.8% and obesity was 55.5%. A total of 92.9% of the study participants reported consumption of junk food. On mapping the study area, it was found that the total number of food outlets were 116. It was found that density of any food outlet per study participant was 0.7.
Conclusion:
The Srikot in Uttarakhand is in an early stage of urbanization as evident from the burden of obesity, and this might worsen by prevalent outlet density of food in the environment.
Keywords: Adult, Body mass index, obesity, outlet, overweight, retail, shop
Introduction
The rising burden of obesity is a threat to both developed and developing countries. Obesity is a killer lifestyle disease.[1] Obesity and overweight are affecting millions in developed as well as developing countries.[2] Obesity was once considered a developed world problem. However, today, the prevalence of obesity is drastically increasing in developing countries also.[3] Overweight and obesity have the largest contribution for noncommunicable disease morbidity and mortality.[4]
According to the World Health Organization in 2008, over 1.4 billion adults were overweight and more than half a billion were obese.[2] The National Health and Nutrition Examination Survey in the United States in 2005–2008 revealed that the obesity prevalence was 39.6% among rural adults compared to 33.4% among urban adults.[5] The recent ICMR-INDIAB study conducted in three states namely Tamil Nadu, Maharashtra, and Jharkhand and one Union Territory Chandigarh of India found that the prevalence of generalized obesity ranged from 11.8% to 33.6% among the residents.[6] Comparison of two major studies conducted by the National Family Health Survey (NFHS-2) in 1998–1999 and NFHS-3 in 2005–2006 shows that the prevalence of obesity among Indian women has elevated from 10.6% to 12.6%.[7] The Chennai Urban Rural Epidemiology Study determined that the age-standardized prevalence of generalized obesity was 45.9% (95% confidence interval [CI]: 43.9%–47.9%).[8]
Different aspects of the local environment play a key role in the occurrence of obesity. Neighborhood retailing of high calorie unhealthy food had been implicated in affecting prevalence rates of overweight and obesity. The high density of outlets increases the ease with which individuals can access these products. The prevalence of elevated weight status is positively associated with the presence of unhealthy food outlets in the neighborhood.[9] A study documented that the proximity to or density of grocery or fast food restaurants or the prices of healthy food options were more associated with risk of overweight/obesity in children.[10] Moreover, the rural areas are rapidly undergoing urbanization. This further leads to nutrition transition from homemade food to packed food, thereby increasing the risk and burden of obesity.[11]
There is an immediate need to address the burden of obesity, the greatest risk factor contributing to noncommunicable diseases. The present study was conducted to determine the prevalence of obesity among adult, its associated factors, and its relationship with food and retail outlet density in Srikot, Uttarakhand.
Materials and Methods
This was a community-based cross-sectional study, carried out in Srikot about 5 km from Srinagar toward Joshimath, Uttarakhand. Srikot is a rural hilly area with nearly 6500 population as per the Census 2011.[12] Data collection was started from Mid-May 2016 and was completed in Mid-July 2016. The study participants were the adult males and females aged above 20 years and living in the study area for the last 6 months. The people who did not give consent or who were not available after three consecutive visits were excluded from the study. The present study was studied as a component of a primary study conducted to find out the prevalence of smoking and alcoholism among the adult population. The sample size was calculated based on the prevalence of smoking, a proxy indicator for obesity in Indian population.[6] For calculation of the sample size, the prevalence of smoking was taken to be 17.7% among adult population of rural Chandigarh, North India.[7] For logistic issues, we took a precision of 6%. The final sample size came to be 155 after taking 6% precision and 95% confidence level.
We developed interview schedule as relevant to the objectives of the present study. A semi-structured pretested questionnaire was used to interview the participants. The questionnaire was pretested with 10 patients before starting the study. The questionnaire was finalized after incorporating grammar changes based on the pretesting. This questionnaire contained questions relevant to sociodemographic data, outside made food, and other associated factors. These questions were asked in the local language for better understanding of the study participants. House-to-house survey was done. Systematic sampling in the community of Srikot identified eligible households. Every nth house was chosen after a random starting point between 1 and 10. The youngest eligible persons in a house were considered for the study.
For measurement of body mass index (BMI), digital weighing scale and stadiometer were used. Zero error was checked. The study participant was asked remove shoes and outer clothing. The study participant was asked to stand in the middle of the scale, feet slightly apart, and remain still until the weight appeared on display. This weight was recorded. Stadiometer was used for measuring the height. Shoes, socks, and hair ornaments were removed. The study participant was helped to stand on the baseboard with feet slightly apart. It was ensured that the back of the head, shoulder blades, buttocks, calves, and heels, all touch the vertical board. The study participant's head was positioned so that a horizontal line from the ear canal to the lower border of the eye socket runs parallel to the baseboard. Keeping the head in position, headboard was pushed down to rest firmly on the top of the head and compresses the hair. Height was measured and recorded. Each anthropometric index was measured twice. An average of the two readings was used for analysis purpose.
The details regarding the geographic location and count of outlets were carried by walking in the community. The coordinates of food outlets were picked up using a free android app, Map it. The coordinate was recorded while standing at the entrance of the outlet. The appropriate items were purchased from the outlet to mark food outlets as healthy or unhealthy.
The outcome variable was the prevalence of obesity, and the explanatory variables were sociodemographic details, pattern of consumption of outside food, density of healthy food, unhealthy food, mixed food, and others. We operationally defined obesity as a person whose BMI ≥25 kg/m2.[7] Unhealthy food outlet was any settlement selling fried, junk, or packed food. Healthy food outlet was any settlement selling vegetables, fruits, fresh juice, and milk and milk product. Mixed food outlet is any settlement selling both healthy and unhealthy food.[13]
The ethical clearance was received from the Institutional Ethics Committee, and informed written consent was obtained from all the participants. All the data were entered into Microsoft Excel 2010. Analysis was done using SPSS 17 compatible for Windows free version. Descriptive statistics was conducted for the percentage, mean, and standard deviation; inferential statistics was conducted using test of significance to measure associations between outcome and explanatory variables. P < 0.05 was considered statistically significant.
Results
In the present study, 61.3% were females. The 63.2% of the study participants belonged to the age group 21–40 years. The mean age of the study participants was 38.3 (±13.6) years. Among male study participants, more than two-third (68.3%) studied graduation or higher. On the other hand, only 46.3% of females had studied graduation or higher. Overall, almost 10% of study participants studied primary class or less. Among males, 41.7% were office workers, having a private or government job. On the contrary, among females, three-fourth (75.7%) were homemakers. It was found 47.7% of the study participants belonged to upper socioeconomic class and 31.6% to upper middle socioeconomic class [Table 1].
Table 1.
Sociodemographic distribution of the study participants (n=155)
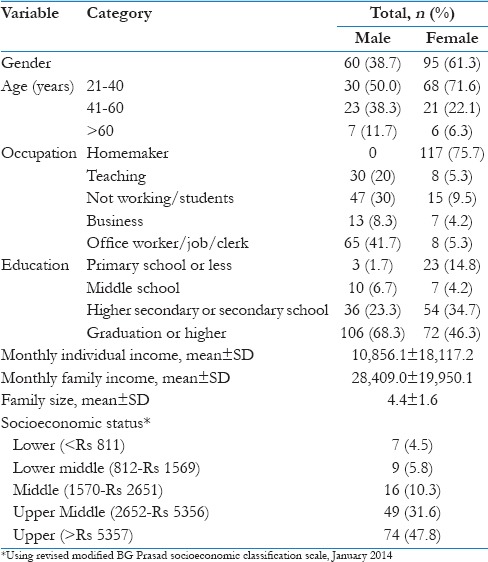
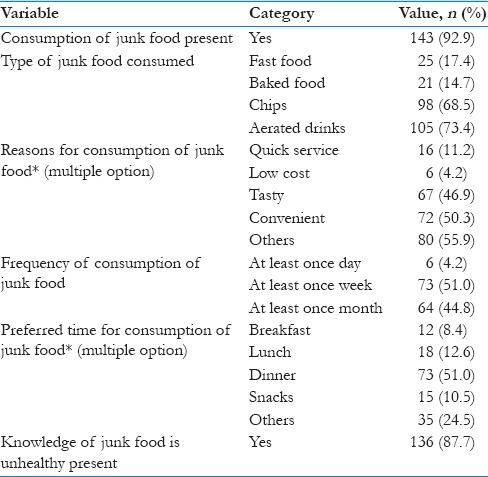
The prevalence of overweight was 14.8% and obesity was 55.5%. Among all obese, BMI was ≥30 kg/m2 for 20.7% of the study participants [Table 2]. A total of 92.9% of the study participants reported consumption of junk food. The primary reasons stated were due to taste and convenience. Nearly 51% of the study participants consumed junk food at least once a week and during dinner. Approximately 87% had knowledge that junk food is not good for health [Table 3].
Table 2.
The prevalence of obesity among the study participants (n=155)
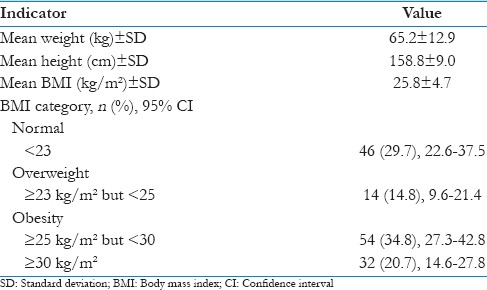
Table 3.
The pattern of junk food consumption among the study participants (n=155)
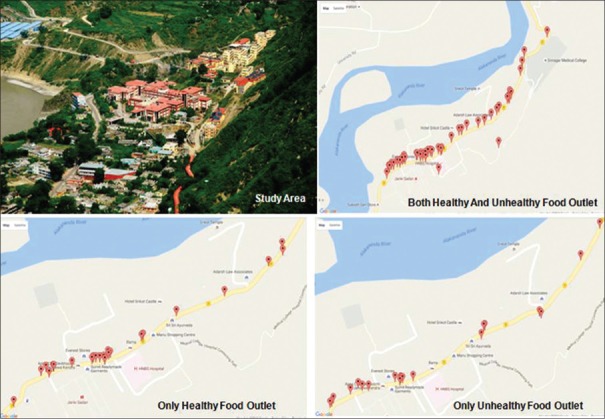
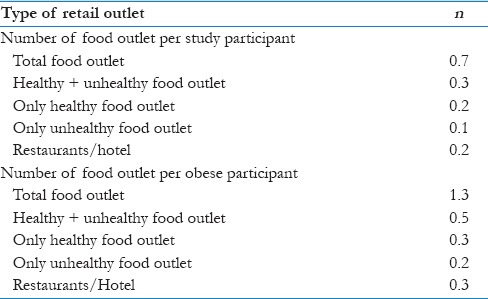
The unadjusted and adjusted odds ratios for factors associated with the obesity in the study participants are shown in Table 4. On mapping the study area, it was found that total number of food outlets was 116 [Figure 1]. Among these, 39.7% had both healthy and unhealthy food and 22.4% were restaurants or hotels. Only healthy food outlets were 20.7% [Table 5]. It was found that density of any food outlet per study participant was 0.7. There was one healthy food outlet per two study participants. On the contrary, there was <1 unhealthy food outlet per two study participants [Table 6].
Table 4.
Distribution of various risk factors with obesity of study participants (n=155)
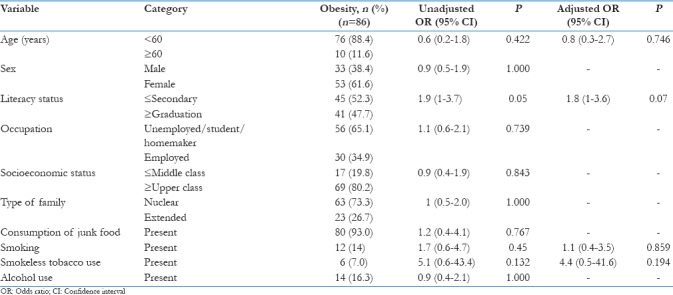
Figure 1.
Density of food outlets in the study area
Table 5.
The density of food outlet in the study area

Table 6.
Relationship between density of food in the study area with study participants
Discussion
To the best of our knowledge, this study is the first of its type to assess food outlet density relationship with the prevalence of obesity among adults in a hilly rural community in India. In addition, there is a lack of published literature about the presence of food outlet density in the hilly rural community of India. The present study enrolled 155 adults. Females constituted nearly two-third of the study population. About 14.8% females have completed primary school or less. Around 68.3% and 46.3% of the males and females were graduate or more educational status. Overall, >85% of the study population was literate middle school or more. This is comparable with District Level Household Survey-3, which revealed that 79.1% population in Uttarakhand had schooling of 7 years or more.[14] Among males, less than one-third (30%) were unemployed or students, whereas three-fourth (75.7%) of the females were homemakers. More than three-fourth (79.3%) of the study participants belonged to upper middle or upper class. This indicates that the study population was literate and had good economic status.
In the present study, the prevalence of obesity among adult population was 55.5% (CI: 47.2–63.4) using BMI ≥25 kg/m2, indicating a high burden of disease. These findings were similar to a study conducted in urban slums in New Delhi (50.1%)[15] and urban areas of Chennai (45.9%),[9] using BMI ≥25 kg/m2. Alikely another study documented that the prevalence of generalized obesity was 26.1%–40.3% in urban adult ≥20 year, where as, the prevalence of obesity was 4.3% to 27.9% in rural areas.[7]
The present results were higher compared to a study from Rajasthan which found the prevalence of obesity (BMI ≥25 kg/m2) was 9.4% in and 8.9% in women, in a rural cohort,[16] and other studies from India urban slums,[17] and Mumbai.[18] Similarly, it was higher compared to a study conducted among tribal women aged 20–70 years of Manipur, Northeast India. The prevalence of obesity was 2.0% using Asian cutoff point in this study.[19] The studies from Kashmir also reported lower prevalence. This could be due to differences in age category of the study population in two studies.[20,21]
The prevalence of obesity in the present study was higher than that reported by other studies in rural areas but comparable with urban slum setting. This reflects the movement of rural communities toward urbanization. The results of the present study are also higher compared to study conducted in urban populations of India,[22] Nepal,[23] Bangladesh,[24] Malaysian,[25] Bahrain,[26] United States,[5] and China.[27] The key reason for this difference in findings could be criteria used for obesity by these studies, BMI ≥30 kg/m2.
The prevalence of obesity among different age groups, gender, occupation, and socioeconomic status was not found to be significantly different. On the contrary, a study from Bangladesh stated that age, education, and occupation were significantly associated with obesity.[24] Furthermore, a study from Nepal reported that higher socioeconomic status, higher literacy status, and particular occupation were significantly associated with obesity.[23] This difference in results could be due to different criteria of BMI for obesity classification.
The present study found that total number of food outlets was 116 in the study area. Among these, majority were both healthy and unhealthy food (39.7%) selling. However, only healthy food outlets were 20.7%. In the present study, it was found that density of any food outlet per study participant was 0.7. There was nearly one food outlet (unhealthy, restaurant, or hotel) for every obese individual in the present study.[12] As per the Census 2011, Srikot, study area, has nearly 6500 population. It was estimated that the density of any food outlet per 1000 person was 748.3. The area of Srikot in hectares is 273.42 (1.05 square mile). This reflects the high availability of unhealthy food. The previous studies had documented that there might be an association between density and proximity of grocery or fast food restaurants, with a risk of obesity in children.[11,28,29,30] It is also stated by studies from New Jersey and Toronto high density of healthy food outlets and supermarket in proximity decreased the chances of being overweight or obese.[31,32] It is a community-based study undertaken in a hilly rural population on obesity. The study has its limitations as well. A better understanding of practices, especially that focuses on urbanization of rural population one needs a qualitative study, was beyond the scope of this study.
Conclusion
The high burden of obesity is influenced by prevalent outlet density of food in the environment. The policy that incorporates to determine the density of unhealthy burden in the community is a need of s combat the burden of obesity.
Financial support and sponsorship
The study was supported by ICMR STS 2016 project.
Conflicts of interest
There are no conflicts of interest.
References
- 1.Obesity: Preventing and managing the global epidemic. Report of a WHO consultation. World Health Organ Tech Rep Ser. 2000;894:i–xii. 1-253. [PubMed] [Google Scholar]
- 2.Rohilla R, Rajput M, Rohilla J, Malik M, Garg D, Verma M, et al. Prevalence and correlates of overweight/obesity among adolescents in an urban city of North India. J Family Med Prim Care. 2014;3:404–8. doi: 10.4103/2249-4863.148127. [DOI] [PMC free article] [PubMed] [Google Scholar]
- 3.Chopra M, Galbraith S, Darnton-Hill I. A global response to a global problem: The epidemic of overnutrition. Bull World Health Organ. 2002;80:952–8. [PMC free article] [PubMed] [Google Scholar]
- 4.Burden of NCDs and their Risk Factors in India. [Last accessed on 2016 Jan 10]. Available from: http://www.searo.who.int/india/topics/noncommunicable_diseases/ncd_situation_global_report_ncds_2014.pdf .
- 5.Befort CA, Nazir N, Perri MG. Prevalence of obesity among adults from rural and urban areas of the United States: Findings from NHANES (2005-2008) J Rural Health. 2012;28:392–7. doi: 10.1111/j.1748-0361.2012.00411.x. [DOI] [PMC free article] [PubMed] [Google Scholar]
- 6.Pradeepa R, Anjana RM, Joshi SR, Bhansali A, Deepa M, Joshi PP, et al. Prevalence of generalized & abdominal obesity in urban & rural India – The ICMR-INDIAB study (Phase-I) [ICMR- NDIAB-3] Indian J Med Res. 2015;142:139–50. doi: 10.4103/0971-5916.164234. [DOI] [PMC free article] [PubMed] [Google Scholar]
- 7.Garg C, Khan SA, Ansari SH, Garg M. Prevalence of obesity in Indian women. Obes Rev. 2010;11:105–8. doi: 10.1111/j.1467-789X.2009.00666.x. [DOI] [PubMed] [Google Scholar]
- 8.Deepa M, Farooq S, Deepa R, Manjula D, Mohan V. Prevalence and significance of generalized and central body obesity in an urban Asian Indian population in Chennai, India (CURES: 47) Eur J Clin Nutr. 2009;63:259–67. doi: 10.1038/sj.ejcn.1602920. [DOI] [PubMed] [Google Scholar]
- 9.Cetateanu A, Jones A. Understanding the relationship between food environments, deprivation and childhood overweight and obesity: Evidence from a cross sectional England-wide study. Health Place. 2014;27:68–76. doi: 10.1016/j.healthplace.2014.01.007. [DOI] [PMC free article] [PubMed] [Google Scholar]
- 10.Le H, Engler-Stringer R, Muhajarine N. Walkable home neighbourhood food environment and children's overweight and obesity: Proximity, density or price? Can J Public Health. 2016;107:5347. doi: 10.17269/CJPH.107.5347. [DOI] [PMC free article] [PubMed] [Google Scholar]
- 11.Allender S, Lacey B, Webster P, Rayner M, Deepa M, Scarborough P, et al. Level of urbanization and noncommunicable disease risk factors in Tamil Nadu, India. Bull World Health Organ. 2010;88:297–304. doi: 10.2471/BLT.09.065847. [DOI] [PMC free article] [PubMed] [Google Scholar]
- 12.District Census Handbook, Garhwal. Census of India 2011. Directorate of Census Operations Uttarakhand. [Last accessed on 2016 Jan 11]. Available from: http://www.censusindia.gov.in/2011census/dchb/0506_PART_B_DCHB_GARHWAL.pdf .
- 13.Fleischhacker SE, Evenson KR, Sharkey J, Pitts SB, Rodriguez DA. Validity of secondary retail food outlet data: A systematic review. Am J Prev Med. 2013;45:462–73. doi: 10.1016/j.amepre.2013.06.009. [DOI] [PMC free article] [PubMed] [Google Scholar]
- 14.District Level Household and Facility Survey–3. India; 2007-2008. [Last accessed on 2016 Jan 16]. Available from: http://www.rchiips.org/prch-3.html .
- 15.Bhardwaj S, Misra A, Misra R, Goel K, Bhatt SP, Rastogi K, et al. High prevalence of abdominal, intra-abdominal and subcutaneous adiposity and clustering of risk factors among urban Asian Indians in North India. PLoS One. 2011;6:e24362. doi: 10.1371/journal.pone.0024362. [DOI] [PMC free article] [PubMed] [Google Scholar]
- 16.Gupta R, Gupta VP, Bhagat N, Rastogi P, Sarna M, Prakash H, et al. Obesity is major determinant of coronary risk factors in India: Jaipur heart watch studies. Indian Heart J. 2008;60:26–33. [PubMed] [Google Scholar]
- 17.Misra A, Pandey RM, Devi JR, Sharma R, Vikram NK, Khanna N, et al. High prevalence of diabetes, obesity and dyslipidaemia in urban slum population in Northern India. Int J Obes Relat Metab Disord. 2001;25:1722–9. doi: 10.1038/sj.ijo.0801748. [DOI] [PubMed] [Google Scholar]
- 18.Shukla HC, Gupta PC, Mehta HC, Hebert JR. Descriptive epidemiology of body mass index of an urban adult population in Western India. J Epidemiol Community Health. 2002;56:876–80. doi: 10.1136/jech.56.11.876. [DOI] [PMC free article] [PubMed] [Google Scholar]
- 19.Mungreiphy NK, Kapoor S. Socioeconomic changes as covariates of overweight and obesity among Tangkhul Naga tribal women of Manipur, North-East India. J Biosoc Sci. 2010;42:289–305. doi: 10.1017/S0021932009990587. [DOI] [PubMed] [Google Scholar]
- 20.Zargar AH, Masoodi SR, Laway BA, Khan AK, Wani AI, Bashir MI, et al. Prevalence of obesity in adults – An epidemiological study from Kashmir valley of Indian subcontinent. J Assoc Physicians India. 2000;48:1170–4. [PubMed] [Google Scholar]
- 21.Masoodi SR, Wani AA, Wani AI, Bashir MI, Laway BA, Zargar AH, et al. Prevalence of overweight and obesity in young adults aged 20-40 years in North India (Kashmir valley) Diabetes Res Clin Pract. 2010;87:e4–6. doi: 10.1016/j.diabres.2009.11.004. [DOI] [PubMed] [Google Scholar]
- 22.Singh RB, Pella D, Mechirova V, Kartikey K, Demeester F, Tomar RS, et al. Prevalence of obesity, physical inactivity and undernutrition, a triple burden of diseases during transition in a developing economy. The five city study group. Acta Cardiol. 2007;62:119–27. doi: 10.2143/AC.62.2.2020231. [DOI] [PubMed] [Google Scholar]
- 23.Vaidya AK, Pokharel PK, Nagesh S, Karki P, Kumar S, Majhi S, et al. Association of obesity and physical activity in adult males of Dharan, Nepal. Kathmandu Univ Med J (KUMJ) 2006;4:192–7. [PubMed] [Google Scholar]
- 24.Khan MM, Kraemer A. Factors associated with being underweight, overweight and obese among ever-married non-pregnant urban women in Bangladesh. Singapore Med J. 2009;50:804–13. [PubMed] [Google Scholar]
- 25.Azmi MY, Jr, Junidah R, Siti Mariam A, Safiah MY, Fatimah S, Norimah AK. Body mass index (BMI) of adults: Findings of the Malaysian adult nutrition survey (MANS) Malays J Nutr. 2009;15:97–119. [PubMed] [Google Scholar]
- 26.Al-Mahroos F, Al-Roomi K. Obesity among adult Bahraini population: Impact of physical activity and educational level. Ann Saudi Med. 2001;21:183–7. doi: 10.5144/0256-4947.2001.183. [DOI] [PubMed] [Google Scholar]
- 27.Ahn S, Zhao H, Tai-Seale M, Huber C, Jr, Smith ML, Ory MG. The longitudinal effects of behavioral, health, and socio-demographic factors on body mass index among older Chinese adults. Int J Public Health. 2012;57:269–77. doi: 10.1007/s00038-011-0249-5. [DOI] [PubMed] [Google Scholar]
- 28.Crawford DA, Timperio AF, Salmon JA, Baur L, Giles-Corti B, Roberts RJ, et al. Neighbourhood fast food outlets and obesity in children and adults: The CLAN study. Int J Pediatr Obes. 2008;3:249–56. doi: 10.1080/17477160802113225. [DOI] [PubMed] [Google Scholar]
- 29.MacFarlane A, Cleland V, Crawford D, Campbell K, Timperio A. Longitudinal examination of the family food environment and weight status among children. Int J Pediatr Obes. 2009;4:343–52. doi: 10.3109/17477160902846211. [DOI] [PubMed] [Google Scholar]
- 30.Chen HJ, Wang Y. Changes in the neighborhood food store environment and children's body mass index at peripuberty in the United States. J Adolesc Health. 2016;58:111–8. doi: 10.1016/j.jadohealth.2015.09.012. [DOI] [PMC free article] [PubMed] [Google Scholar]
- 31.Tang X, Ohri-Vachaspati P, Abbott JK, Aggarwal R, Tulloch DL, Lloyd K, et al. Associations between food environment around schools and professionally measured weight status for middle and high school students. Child Obes. 2014;10:511–7. doi: 10.1089/chi.2014.0065. [DOI] [PMC free article] [PubMed] [Google Scholar]
- 32.Larsen K, Cook B, Stone MR, Faulkner GE. Food access and children's BMI in Toronto, Ontario: Assessing how the food environment relates to overweight and obesity. Int J Public Health. 2015;60:69–77. doi: 10.1007/s00038-014-0620-4. [DOI] [PubMed] [Google Scholar]


