

Abstract
Introduction:
During the 2009–2010 H1N1 pandemic, children and high-risk adults had priority for vaccination. Vaccine in short supply was allocated to states pro-rata by population, but vaccination rates as of January 2010 varied among states from 21.3% to 84.7% for children and 10.4% to 47.2% for high-risk adults. States had different campaign processes and decisions.
Objective:
To determine program and system factors associated with higher state pandemic vaccination coverage for children and high-risk adults during an emergency response with short supply of vaccine.
Methods:
Regression analysis of factors predicting state-specific H1N1 vaccination coverage in children and high-risk adults, including state campaign information, demographics, preventive or health-seeking behavior, preparedness funding, providers, state characteristics, and surveillance data.
Results:
Our modeling explained variation in state-specific vaccination coverage with an adjusted R- squared of 0.82 for children and 0.78 for high-risk adults. We found that coverage of children was positively associated with programs focusing on school clinics and with a larger proportion of doses administered in public sites; negatively with the proportion of children in the population, and the proportion not visiting a doctor because of cost. The coverage for high-risk adults was positively associated with shipments of vaccine to “general access” locations, including pharmacy and retail, with the percentage of women with a Pap smear within the past 3 years and with past seasonal influenza vaccination. It was negatively associated with the expansion of vaccination to the general public by December 4, 2009. For children and high-risk adults, coverage was positively associated with the maximum number of ship-to-sites and negatively associated with the proportion of medically underserved population.
Conclusion:
Findings suggest that distribution and system decisions such as vaccination venues and providers targeted can positively impact vaccination rates for children and high-risk adults. Additionally, existing health infrastructure, health-seeking behaviors, and access affected coverage.
Keywords: Pandemic, Coverage, State-specific, Factors, Estimates, Children and high-risk adults
1. Introduction
A national vaccination campaign was rolled out in fall of 2009 in response to the H1N1 influenza pandemic. Initially,the vaccine was in short supply, in some areas until early December. The vaccine was purchased by the federal government and allo cated to states as it became available, in proportion to population size. The flow of doses from the manufacturers to the national distribution centers and then to final points of distribution built on an existing contract for management and distribution of vaccines in the Vaccine for Children (VFC) program. Depending on their internal structures, states or local authorities decided how to distribute vaccine within their jurisdiction.
CDC’s Advisory Committee on Immunization Practices (ACIP) issued recommendations for the use of the vaccine [7]. The initial target groups were: pregnant women, household contacts or caregivers for infants aged <6 months (e.g., parents, siblings, and daycare providers), personnel who have direct contact with patients or infectious material at health-care and emergency medical services, all people between 6 months and 24 years of age, and persons 25 through 64 years old with health conditions associated with higher risks of complications if infected (to whom we will refer as “high-risk adults”) [7]. The recommendations further specified priority groups in the event of a vaccine shortage, giving priority to the first three of the previous groups, and in addition children aged 6 months to 4 years, and children and adolescents aged 5–18 years who have a medical condition that could cause them influenza-related complications. Finally, the ACIP recommenddations stated that decisions about opening vaccination up beyond the target groups should be made at the local level.
Despite the pro-rata allocation of vaccine to the states, by the end of January 2010 [2] state-level vaccination coverage varied markedly across states, with rates for children aged 6 months to 17 years ranging from 21.3% to 84.7%, and for high-risk adults from 10.4% to 47.2%. This variation suggests that implementation strategies (e.g. location of vaccination or types of providers receiving vaccine) may have affected state-level vaccination rates achieved and that specific distribution strategies may be associated with reaching specific groups. Fig. 1 summarizes coverage outcomes [2] for children and high-risk adults compared to overall adults (18 and up, including those with high-risk conditions). Coverage rates were higher for more than one group in some states, pointing to the potential contribution of state systems, processes, or underlying characteristics to coverage achieved.
Fig. 1.
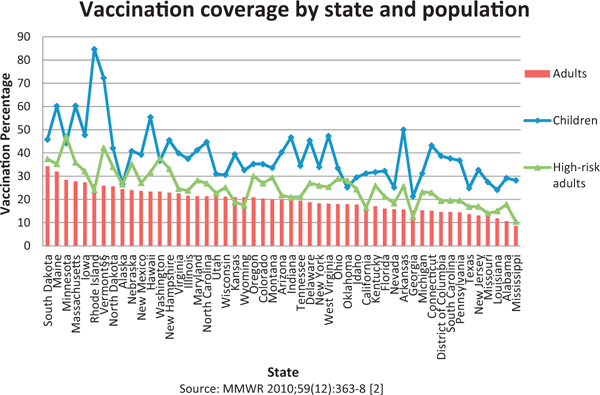
2009 pandemic H1N1 vaccination coverage by state for 3 different populations [2], sorted by decreasing order of adults coverage, October 2009-January 2010.
In a previous study, we found that certain supply chain and system factors were associated with state-level coverage of overall adults [12]. The purpose of this study was to extend that analysis and focus on factors associated with coverage of children and high-risk adults, two of the initial target groups for vaccination. Some of the characteristics of the state’s health supply chain that we expected to relate with coverage of children and high-risk adults were the number of locations where vaccine was available, type of providers that received doses, focus on school vaccination, timing of opening of vaccine distribution to non-priority groups, use of third parties for transfer and redistribution of vaccine, and use of retail and pharmacy for vaccination. Fig. 2 presents an example of the supply chain of vaccine. We considered health infrastructure characteristics for the states, and data about vaccine shipments and distribution strategies during the primary shortage period. To account for other factors that may affect vaccination coverage [13–18], we included factors pertaining to the underlying characteristics of the state’s population such as demographics and utilization of preventive health services.
Fig. 2.
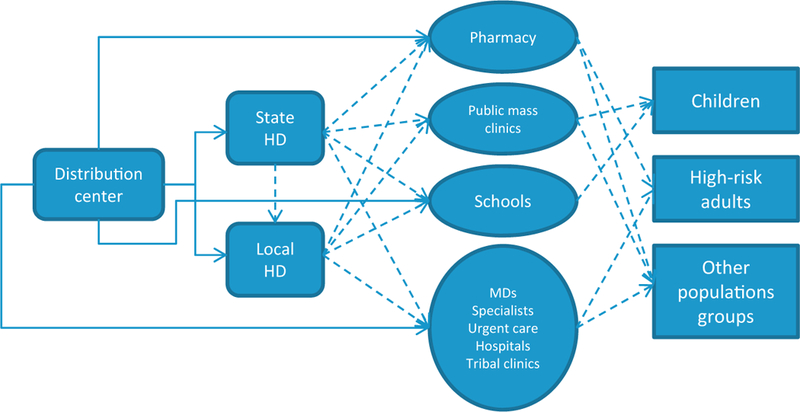
Example supply chain for H1N1 vaccine during the 2009–2010 pandemic vaccination campaign, where states used different distribution processes and locations to serve several populations, e.g., vaccine could be sent from distribution center to state or local health departments (HDs) or other providers, and potentially from there to other locations. Dotted lines represent possible combinations for some of the flows used.
2. Methods
2.1. Design
We used linear regression models to perform an ecological analysis on the relationship between state-level 2009 H1N1 vaccination rates in children 6 months to 17 years of age, and high-risk adults 25–64 years old, and variables describing (1) the state’s supply chain and process design for the vaccination campaign, and (2) general population and health characteristics of the states.
2.2. Data
We separately analyzed two outcomes, both related to the state- specific 2009 H1N1 vaccination coverage: (i) the estimation of children’s vaccination rate as a percentage (0–100%) of the population, and (ii) the estimation for the percentage of high-risk adults vaccinated, both of them calculated by the CDC [2,19].
2.2.1. Population and state characteristics
The data sources for the analysis were varied including census [8,20], income inequalities [21], measures of segregation and disparities [22], industry trade reports on number of cars [3], the 2008 National Profile of Local Health Departments [23], the Bureau of Labor and Statistics [24], the American Medical Association 2006 [25], State Health Facts [4], CDC’s Behavior Risk Factor Surveillance System (BRFSS) [26], and CDC estimates on influenza coverage for previous seasons [11]). The details on this data (and all others) are explained in the Supplemental Material to Davila-Payan et al. [12].
For the analysis of children, we additionally considered several variables from the National Survey of Children’s Health 2007 [27] that describe the children’s general health condition, the prevalence of chronic health conditions among them, their private or public health insurance coverage, if they have preventive visits to the doctor in the past 12 months, and if their home meets the medical home criteria.
2.2.2. State-specific vaccination program and surveillance information
The analysis included information on emergency response funds provided to states [28,29]; reports from the Outpatient Influenzalike Illness Network (ILINet) [30]; information on the amount of vaccine allocated to each state over time; detailed vaccine shipping information including date, address, and number of doses shipped to each location, from the beginning of the campaign through December 9 2009 [1] (which covers the major shortage period); the maximum number of provider sites to which vaccine could be shipped through the centralized distribution system; the number of vaccine doses received in each state through the federal pharmacy vaccination initiative [10,31] in late 2009; and self-reported data from states on doses distributed to or administered in public settings [9].
Information on state processes and decisions from surveys during the campaign [6] contained several variables that we considered including: the percentage of VFC providers who participated in the H1N1 campaign; whether or not vaccination had expanded beyond the ACIP target groups by December 4 2009 (similarly, by December 18); whether school clinics had been held by October 27 (or doses were being held for, or waiting to hold clinics at schools) and whether school vaccination was a main focus; and if 3rd party distribution was used to transfer or redistribute to small providers.
From the detailed shipping information we calculated the average number of shipments per location (the total number of shipments divided by the total number of ship-to-sites per state). Performing targeted queries, we also categorized shipments by type of provider, showing types of destinations for the distribution of vaccine. We also combined some of these categories in subgrouping to see which had a greater impact on these populations, For example,a targeted access group for categories serving specific populations; and a general access group, including categories available to all population sub-groups. Information was adequate to categorize more than 75% of the overall shipments.
2.3. Analysis
We constructed separate models for children (6 months to 17 years) and high-risk adults (25–64 year olds with a chronic condition) because we expected factors affecting coverage to differ across groups, and to differ from factors associated with vaccination rates in overall adults (18 and up, including those with high-risk conditions [12]).
The primary technique used for modeling was multivariate linear regression (ordinary least squares). We used a logarithmic transformation of the vaccination rate for children, to better approximate normality. We calculated simple descriptive statistics for all the analyzed outcomes and factors (means, standard deviations, and proportions). Outliers were not removed for the analysis. Data was linearly scaled to values in [0.1] before performing regressions.
We selected a number of potential initial predictors for each of the dependent variables based on their correlation with the outcomes. From these initial models we developed models by stepwise addition, elimination, or by interchange of factors. At each stage, we chose variables to include or remove based on their statistical significance and their potential to explain variability, while we examined correlations to avoid high collinearities in the model. Models were evaluated on adjusted R-square values and the F- statistic, with individual variables significant at p-value < 0.05. The regressions were performed with R statistical software package version 2.11.1 [32]. Some descriptive statistics were calculated in Microsoft Excel versions 11 and 12. A deeper explanation of the methodology can be found on Davila-Payan et al. [12], and in the Supplemental Methods Section.
3. Results
Nine independent variables were significantly associated with vaccination coverage in children and eight for high-risk adults (fifteen different independent variables in total, two of which are shared by both models). A list of these variables can be found in Table 1. The adjusted R-squared for the regression models is 0.82 for children (Table 2) and 0.78 for high-risk adults (Table 3), and both of their p-values are close to 0.
Table 1.
List of variables appearing in both model, including the dependent variables at the top. Table shows the variable’s name, description, reference for the data, average (Avg.), standard deviation (S.D.), maximum (Max) and minimum (Min) values.
| Variable | Description ofvariables | Reference | Avg. | S.D. | Max | Min |
|---|---|---|---|---|---|---|
| D-1 | Coverage ofchildren 6 months to 17 years | MMWR [2] | 38.9 | 11.9 | 84.7 | 21.3 |
| D-2 | Coverage of persons aged 25–64 years at high-risk | MMWR [2] | 25.4 | 7.6 | 47.2 | 10.4 |
| I-1 | Percent of women age 18 and older who report having had a Pap Smear within the last three years, 2008 | State health facts [4] | 82.7 | 2.9 | 88.9 | 74.1 |
| I-2 | Maximum number of vaccination sites per state per thousand population (2009) | CDC report (calculation) [5] | 0.5 | 0.1 | 0.7 | 0.00a |
| I-3 | Percentage reporting not seeing a doctor in the past 12 months because of cost | State health facts [4] | 13 | 3.4 | 20.5 | 6.2 |
| I-4 | Underserved population living in primary care health professional shortage areas, as ofSeptember, 2008 | State health facts [4] | 12.6 | 7.6 | 34.4 | 1.7 |
| I-5 | Resident population under 18 years, percent (July 1 - estimate) 2008 | Census [8] | 24 | 1.9 | 31 | 18.9 |
| I-6 | Resident population: American Indian and Alaska native alone, percent (July 1 - estimate) 2008 | Census [8] | 1.8 | 2.9 | 15.3 | 0.2 |
| I-7 | Total public doses October-February divided by estimated people vaccinated | CDC report [9] | 39.6 | 20.3 | 98.9 | 11.9 |
| I-8 | H1N1 Vaccine doses distributed oradministered to date from large pharmacy chains/retail-based clinics to states as of January 29 2010 | CDC report [10] | 10 | 6.6 | 30.1 | 0 |
| I-9 | Seasonal influenza coverage foradults 18–49 years on the 2007–2008 season | CDC influenza vaccination coverage [11] | 55.4 | 11.5 | 80.5 | 27.3 |
Roundedvalue forAlaska.
Table 2.
Regression results for predicting the state level vaccination coverage for children 6 months-17years, United States, end ofJanuary 2013.
| Coefficients when predicting ln (children coverage percentage) | |||||
|---|---|---|---|---|---|
| Variable | Short description | Estimate | Std. error | t-Value | Pr (>|t|) |
| (Intercept) | 0.01488 | 0.05956 | 0.25 | 0.804 | |
| Indep15 | (Re) Shipments | 0.42308 | 0.07285 | 5.807 | 0.000 |
| Indep19 | Focus on school | 0.36769 | 0.07239 | 5.079 | 0.000 |
| Indep6 | Max # sites | 0.29734 | 0.07016 | 4.238 | 0.000 |
| Indep20 | 3rd Party dist’n | 0.24461 | 0.06349 | 3.852 | 0.000 |
| Indep12 | % Public doses | 0.2125 | 0.06837 | 3.108 | 0.003 |
| Indep10 | % Children | −0.18817 | 0.07965 | −2.362 | 0.023 |
| Indep17 | Cars per capita | −0.2843 | 0.07726 | −3.68 | 0.001 |
| Indep9 | % Underserved population | −0.28992 | 0.07701 | −3.765 | 0.001 |
| Indep8 | % Visit, cost | −0.35139 | 0.08217 | −4.276 | 0.000 |
Adjusted R-squared: 0.8291, regression’s p-value<0.001.
Table 3.
Regression results for predicting the state level vaccination coverage forthe high-risk adult population, United States, End ofJanuary 2010.
| Coefficients when predicting coverage ofhigh-risk adults | |||||
|---|---|---|---|---|---|
| Variable | Short description | Estimate | Std. error | t-Value | Pr(>|t|) |
| (Intercept) | −0.46318 | 0.09916 | −4.671 | 3.51E-05 | |
| Indep1 | Women with Pap Smear | 1.44641 | 0.38477 | 3.759 | 0.000559 |
| Indep6 | Max # sites | 0.54139 | 0.09705 | 5.579 | 1.99E-06 |
| Indep16 | % Doses shipped to “general access locations” | 0.38443 | 0.07088 | 5.424 | 3.26E-06 |
| Indep14 | Previous seasonal influenza coverage adults | 0.3603 | 0.08525 | 4.226 | 0.000138 |
| Indep11 | Pop. American Indian | 0.20897 | 0.0777 | 2.69 | 0.010474 |
| Indep13 | Pharmacy and retail | 0.17915 | 0.05251 | 3.412 | 0.001515 |
| Indep18 | Expanded by December 4th | −0.11829 | 0.02398 | −4.933 | 1.55E-05 |
| Indep9 | % Underserved population | −0.37442 | 0.06081 | −6.157 | 3.14E-07 |
Adjusted R-squared: 0.7823, Regression’s p-value< 0.001
For children, four factors related with supply chain and campaign processes contributed positively to coverage: average ratio of the number of shipments per ship-to-sites, the state focus on school vaccination, the use of third parties (i.e. state or locally hired distributors) for further distribution to small providers, and the estimated proportion of doses that were administered in public sites.
Two factors were related to existing health infrastructure: the maximum number of ship-to-sites had a positive association with coverage, and the percentage of medically underserved population a negative association. Coverage was also negatively associated with population factors including the percentage of the population that will not visit a medical doctor because of cost, the number of vehicles per capita, and the percentage of population under 18 years old.
For high-risk adults, two supply chain processes were positively associated with uptake: the percentage of doses shipped to “general public” locations, and the use of pharmacy and retail locations for vaccination; and one, the expansion of vaccination to the general public by December 4th, was negatively associated.
Coverage was positively associated with population and health related factors: percentage of women with a Pap smear, past seasonal influenza vaccination, and percentage of population that is American Indian. Two infrastructure factors were associated: the proportion of the population medically underserved (negatively) and the maximum number of ship-to-sites (positively).
4. Discussion
We sought to identify factors related to vaccination program decisions and processes that may have facilitated or hindered vaccine uptake for two target groups for vaccination: children and high-risk adults. Several supply chain and system factors were associated with vaccination coverage of children and of high-risk adults. With the exception of the maximum number of ship-to sites, a factor that was also associated with overall adult coverage [3], factors associated with coverage of children and of high-risk adults did not overlap. Additionally, factors not related to program decisions such as health-seeking behaviors and population characteristics were also associated with state-to-state variation, as would be expected given baseline variation in vaccination coverage for recommended vaccines [4] and the variety of factors associated with vaccinations, both for high-risk individuals [15,17,18,33] and children [13,14].
Several findings were related to the type of providers or locations to which vaccine was directed. For children, having a focus on school vaccination was associated with higher coverage (five of the six states that achieved the highest coverage in children implemented statewide school vaccination programs [2,6]), as was distribution to public sites. Public sites can include schools, but also locations such as mass clinics run by health departments. For high-risk adults, more distribution to providers with a broad base of access (including pharmacies, primary care providers, county health departments, etc.) was associated with higher coverage. It is noteworthy that coverage for overall adults was negatively associated with distribution to internists or specialists [3]. Taken together, the results for adults suggest that vaccine that was broadly accessible may have facilitated higher coverage. This could be because high-risk adults may not visit internists or specialists frequently enough to be vaccinated in this time period; because specialists traditionally have had less focus on vaccinating so patients may have looked elsewhere for vaccine, or because the cost in some settings was lower. For high-risk adults, the percent medically underserved is also negatively associated with coverage, which may also help explain the positive impact of open access locations and pharmacies.
The number of shipments per ship-to site was positively associated with coverage for children but not for high-risk adults. For children, this may reflect repeated shipments to locations such as local health departments, mass clinics, or pediatricians who may have offered repeated clinics. Some health departments monitored usage and distributed more vaccine to providers who were depleting vaccine supply faster, which is another potential hypothesis. The maximum number of sites to which vaccine could be directly shipped through the centralized distribution system was positively associated with vaccination coverage for both children and high- risk adults, a finding also observed for overall adults [3]. Because the number of ship-to-sites allowed for each state was based on a formula that included the population size as well as the number of existing VFC providers, this measure may reflect a more robust healthcare infrastructure.
The expansion of vaccine availability to the general public by December 4th was associated with lower coverage for high-risk adults. Early expansion could have resulted in less access for high- risk adults, especially if a state had sequential priorities (e.g., children first, then high-risk adults). However, because in most states, decisions about when to make vaccine available beyond the initial target groups were based on perceived demand for vaccine, e.g., as ascertained from provider vaccine orders and attendance at public clinics, so the decision to expand early could reflect lower demand in those states.
Coverage for high-risk adults was positively associated with uptake of seasonal vaccine for high-risk adults in 2007–2008, as it was for adults overall [12].This could be because the administration sites for adults were similar to past seasonal influenza campaigns or it could reflect use of preventative services. In contrast, the lack of association for children could reflect the fact that vaccine administration sites differed from past seasons with school vaccination playing an unprecedented role during this influenza vaccination campaign. A second hypothesis for children is that the increased focus on them as a priority group served to motivate their vaccination by caregivers or providers. The association between coverage rates in high-risk adults and rates of receipt of Pap smear may be a reflection of utilization of preventive care in a state, and could also reflect vaccination by Ob-Gyns [34].
For children, lower coverage was associated with a higher percent of the population reporting they would not visit a medical provider because of cost; and coverage was positively associated with the proportion of vaccine being directed to public sites. These findings may relate to the relationship between cost and access (e.g., a mass clinic may have been free to patients, while visiting a specialty physician may result in a fee), as we found for high-risk adults. It is noteworthy that for both children and high-risk adults, the percent uninsured was highly correlated with coverage (though it did not add to the model).
The negative association between coverage for children and the percentage of the population under 18 could be a combination of the pro-rata allocation and prioritization policies. Given the initial focus on vaccinating children, the amount of vaccine available per child was less in states with proportionately more children. Additionally, the vaccine available per child decreased since a second dose was recommended for children 6 months through 9 years of age [35]. In the event of a vaccine shortage, deviating from an overall pro-rata allocation may be justifiable, if a sub-population at higher risk is easy to identify, and the impact of increased allocation to this sub-population is potentially large. This warrants further examination given the complexity of recommendations with multiple target groups.
The use of third party distribution and number of cars per capita appeared in the model for children. Both have small individual correlations with the dependent variable, so they improve the overall model fit when controlling for other variables.
This study had several limitations. As explained more fully in the article by Davila-Payan et al. [12] the shipment data ends December 9 2009, but we examine vaccination coverage at the end of January 2010. We also do not know where the vaccine was actually administered; this means for example, that we do not know whether repeated shipments to the same location, i.e., a local health department, were being distributed through mass clinics, schools, or other local providers. We were only able to determine provider type for 75% of shipments, and the information on state and local decisions and processes was not always complete. Modeling limitations include the fact that ecological approaches do not point to individual characteristics of the population but to state-level conditions, leaving out potentially relevant variations within states, and that that cross-sectional studies cannot determine causality. Also related to the latter, it should be noted that there are multiple potential explanations for findings. While we aimed to include the most likely ones, the potential for bias should be recognized. Additionally, we are identifying associations with a relatively small number of dependent variables (51), across many independent variables that have correlations, and confidence intervals of the coverage estimations were not considered in the regression. We have kept the best models we found, however, other good models could also exist. Supplementary Table 1 presents a summary of variables highly correlated with those in the children and high- risk models. Our models provide a solid approach on the analysis of factors related with coverage. However, care should be taken in relying too heavily on any particular variable or finding without considering its interaction with other variables in the model.
The distribution and administration of the H1N1 vaccine provided an opportunity to understand how specific approaches may affect vaccine uptake in priority populations in an emergency situation. Results from this analysis complement those examining factors associated with vaccination of overall adults and suggests that supply chain factors may affect vaccine uptake. The analysis also points to opportunities for future research such as further analysis on uptake and the relationship with spatial access to vaccine or access by provider type, and the role of urban or rural differences in vaccine uptake. These research questions and others can be informed by more detailed mapping of the process and system to show details of demand (e.g., by population or providers), supply (e.g. details on allocations and shipments including the final point of distribution and the category of provider), lead-times across the system, variations within and across states, where vaccine was administered, when, by who and to what subpopulation. Such data would also allow for a robust comparison of potential distribution systems and processes before they are implemented.
Supplementary Material
Acknowledgements
C. Davila-Payan collected data, performed statistical analysis, and aided in drafting the manuscript. J. Swann designed the study, advised on methodology and logistical factors, and drafted the manuscript. P. Wortley advised on public health and vaccination programs, assisted in acquisition of data, aided in interpretation of results, and editing the manuscript. All authors approved the final manuscript. C. Davila-Payan was partially supported by the ORISE Fellows program during the research. J. Swann was partially supported as the Harold R. and Mary Anne Nash professor, by the Zalesky Family, and by Andrea Laliberte in gifts to the Georgia Institute of Technology, and was partially supported by the Centers for Disease Control and Prevention (CDC) in an Intergovernmental Personnel Act agreement between the CDC and Georgia Tech. The ORISE Fellows program and the donors to Georgia Tech had no role in this research. Participants at the CDC gave feedback on preliminary results including potential interpretations and reviewed the final manuscript for confidentiality and accuracy. The findings and conclusions in this paper are those of the authors and do not necessarily represent the official position of the CDC.
Footnotes
Conflicts of interest: No conflicts of interest are declared by the authors.
Appendix A. Supplementary data
Supplementary data associated with this article can be found, in the online version, at http://dx.doi.org/10.1016/j.vaccine.2013.11.018.
References
- [1].Centers for Disease Control and Prevention.FOIA Request, H1N1 Shipments through December 9, 2009; 2009 [provided 17.12.09].
- [2].Centers for Disease Control and Prevention. Interim results: state-specific influenza A (H1N1) 2009 monovalent vaccination coverage - United States, October 2009-January 2010. MMWR Morbidity and Mortality Weekly Report 2010;59(12):363–8 [April 2]. [PubMed] [Google Scholar]
- [3].National Automobile Dealers Association. Report on Average age and Number of Vehicles. National Automobile Dealers Association; 2006. [available from: http://www.swivel.com/workbooks/19617-Cars-per-state cited 03.05.10].
- [4].The Henry J. Kaiser Family Foundation - Statehealthfacts.org. 50 State Comparisons; 2010. [available from: http://www.statehealthfacts.org/compare.jsp cited 12.07.10].
- [5].Centers for Disease Control and Prevention. Vaccine Depos assigned to States; 2010 [provided 16.06.10].
- [6].Clark S. H1N1 Vaccine Implementation Simultaneous Tracking Project - Sum- mary of Findings weeks 09–28-09 to 10–2-09,10–05-09to 10–09-09,10–19-09 to 10–23-09, 10–26-09 to 10–30-09, 11–02-09 to 11–06-09, 11–09-09 to11– 13-09, 11–23-09 to 11–28-09, 11–30-09 to 12–04-09, 12–14-09 to 12–18-09, 01–04-10 to 01–08-10, and 01–11-10 to 01–15-10. University of Michigan; 2010.
- [7].Centers for Disease Control and Prevention. Use of Influenza A (H1N1) 2009 Monovalent Vaccine: Recommendations of the Advisory Committee on Immunization Practices (ACIP). MMWR 2009;58(RR10):1–8. [PubMed] [Google Scholar]
- [8].U.S. Census Bureau. National and States Population Estimates; 2009 [available from: http://www.census.gov/popest/states/tables/NST-EST2009-01.xls cited 03.05.10].
- [9].Centers forDisease Control and Prevention. State dataon public doses ofH1N1 vaccine; 2010 [provided 25.05.10].
- [10].Koonin LM, Beauvais DR, Shimabukuro T, Wortley PM, Palmier JB, Stanley TR, et al. CDC’s 2009 H1N1 vaccine pharmacy initiative in the United States: implications for future public health and pharmacy collaborations for emergency response. Disaster Medicine and Public Health Preparedness 2011; 5(4):253–5. [DOI] [PubMed] [Google Scholar]
- [11].Centers for Disease Control and Prevention. Seasonal Influenza (Flu). Influenza Vaccination Coverage; 2010. [available from: http://www.cdc.gov/flu/professionals/vaccination/vaccinecoverage.htm cited 24.09.12].
- [12].Davila-Payan CS, Swann JL, Wortley PM System factors to explain H1N1 state vaccination rates for adults in US emergency response to pandemic. Vaccine 2013. Ms. Ref. No.:JVAC-D-13–00137. [DOI] [PubMed] [Google Scholar]
- [13].Cohen B, Ferng YH, Wong-McLoughlin J, Jia HM, Morse SS, Larson EL. Predictors of flu vaccination among urban Hispanic children and adults. Journal of Epidemiology and Community Health 2012;66(March 3):204–9. [DOI] [PMC free article] [PubMed] [Google Scholar]
- [14].OrtizJR Neuzil KM, Victor JC,Aitken ML, Goss CH Predictors ofinfluenzavac- cination in the Cystic Fibrosis Foundation Patient Registry, 2006 through 2007. Chest 2010;138(December6):1448–55. [DOI] [PMC free article] [PubMed] [Google Scholar]
- [15].Lu PJ, Callahan DB, Ding H, Euler GL InfluenzaA(H1N1)2009 MonovalentVac- cination Among Adults withAsthma, US, 2010. AmericanJournal ofPreventive Medicine 2011;41(December 6):619–26. [DOI] [PubMed] [Google Scholar]
- [16].Sammon CJ, McGrogan A, Snowball J, de Vries CS. Factors associated with uptake ofseasonal and pandemic influenza vaccine among clinical risk groups in the UK: an analysis using the General Practice Research Database. Vaccine 2012;30(March 14):2483–9. [DOI] [PubMed] [Google Scholar]
- [17].SteelFisher GK, Blendon RJ, Bekheit MM, Mitchell EW, Williams J, Lubell K, et al. Novel pandemic A (H1N1) influenza vaccination among pregnant women: motivators and barriers. American Journal of Obstetrics and Gyne cology 2011;204(June 6):S116–23. [DOI] [PubMed] [Google Scholar]
- [18].Durham MD, Buchacz K, Armon C, Patel P, Wood K, Brooks JT, et al. Rates and correlates of influenza vaccination among HIV-infected adults in the HIV Outpatient Study (HOPS), USA, 1999–2008. Preventive Medicine 2011;53(Jul-Aug 1/2):89–94. [DOI] [PubMed] [Google Scholar]
- [19].Singleton J, Santibanez T, Lu P, Ding H, Euler G, Armstrong G, et al. Interim results: influenza A (H1N1) 2009 monovalent vaccination coverage-United States, October-December 2009. MMWR 2010;59:44–8. [PubMed] [Google Scholar]
- [20].U.S. Census Bureau. Population Estimates - Quick Tables. U.S. Census Bureau; 2008. [available from: http://factfinder.census.gov/servlet/QTGeoSearchByListServlet?ds_name=PEP_2008_EST&_lang=en&_ts=327594145461 cited 03.05.10].
- [21].Volscho T Measures ofIncome Distribution in the United States, 1970–2000 Department of Sociology, Anthropology, and Social Work, CUNY - College of Staten Island; 2009. [Google Scholar]
- [22].James CV, Salganico A, Thomas M, Ranji U, Lillie-Blanton M, Wyn R. Putting Women’s Health Care Disparities on the Map The HenryJ. Kaiser Family Foundation; 2009. [Google Scholar]
- [23].National Association of County & City Health Officials. Washington, DC: 2008. National Profile ofLocal Health Departments; 2009. [Google Scholar]
- [24].U.S. Department of Labor - Bureau of Labor Statistics Create customized tables. U. S. Department ofLabor- Bureau ofLabor Statistics; 2010. [available from: http://data.bls.gov/cgi-bin/dsrv, http://www.bls.gov/oes/#data cited 03.05.10]. [Google Scholar]
- [25].PhysicianCharacteristics and distribution inthe US. Chicago, IL: American Medical Association; 2006.
- [26].Centers for Disease Control and Prevention. Behavioral Risk Factor Surveillance System - Prevalence and Trends Data; 2008. [available from: http://apps.nccd.cdc.gov/brfss/ cited 12.07.12].
- [27].The Child and Adolescent Health Measurement Initiative. National Surey of Children’s Health - Physical and Dental Health; 2010. [available from: http://nschdata.org/DataQuery/SurveyTopics.aspx cited 14.06.10].
- [28].Centers for Disease Control and Prevention. Instructions for Preparing and Submitting Budget Period 10 Funding Applications; 2009. [available from: http://www.bt.cdc.gov/cotper/coopagreement/10/FinalPHEP_BP10_Guidance_508%20Version.pdf updated 05.07.10; cited 05.07.12].
- [29].Centers for Disease Control and Prevention. Public Health Emergency Response (PHER) Phase III; 2010. [available from: http://www.cdc.gov/phpr/pher.htm cited 07.06.12].
- [30].Centers for Disease Control and Prevention. Influenza-like Illness Surveillance Program (ILINet); 2010 [provided 07.07.10].
- [31].Centers for Disease Control and Prevention. H1N1 Vaccine Doses Distributed or Administered to Date from Large Pharmacy Chains/Retail Based Clinics to States as ofJanuary 29, 2010; 2010 [provided 20.05.10].
- [32].Institute for Statistics and Mathematics. R project for statistical computing; 2012. [available from: http://www.r-project.org/ cited 24.05.12].
- [33].Althoff KN, Anastos K, Nelson KE, Celentano DD, Sharp GB, Greenblatt RM, et al. Predictors of reported influenza vaccination in HIV-infected women in the United States, 2006–2007 and 2007–2008 seasons. Preventive Medicine 2010;50(May-Jun 5–6):223–9. [DOI] [PMC free article] [PubMed] [Google Scholar]
- [34].Clark SJ, Cowan AE, Wortley PM. Obstetricians and the 2009–2010 H1N1 vaccination effort: implications for future pandemics. Maternal and Child Health Journal 2013;17:1188–90. [DOI] [PMC free article] [PubMed] [Google Scholar]
- [35].Centers for Disease Control and Prevention. 2009. H1N1 Influenza Vaccine - Dose Spacing for Children 6 Months through 9 Years of Age; 2009 [available from: http://www.cdc.gov/h1n1flu/vaccination/dosespacing.html cited 11.03.13].
Associated Data
This section collects any data citations, data availability statements, or supplementary materials included in this article.