

Abstract
Queueing theory studies the properties of waiting queues and has been applied to investigate direct host-to-host transmitted disease dynamics, but its potential in modelling environmentally transmitted pathogens has not been fully explored. In this study, we provide a flexible and customizable queueing theory modelling framework with three major subroutines to study the in-hospital contact processes between environments and hosts and potential nosocomial pathogen transfer, where environments are servers and hosts are customers. Two types of servers with different parameters but the same utilization are investigated. We consider various forms of transfer functions that map contact duration to the amount of pathogen transfer based on existing literature. We propose a case study of simulated in-hospital contact processes and apply stochastic queues to analyse the amount of pathogen transfer under different transfer functions, and assume that pathogen amount decreases during the inter-arrival time. Different host behaviour (feedback and non-feedback) as well as initial pathogen distribution (whether in environment and/or in hosts) are also considered and simulated. We assess pathogen transfer and circulation under these various conditions and highlight the importance of the nonlinear interactions among contact processes, transfer functions and pathogen demography during the contact process. Our modelling framework can be readily extended to more complicated queueing networks to simulate more realistic situations by adjusting parameters such as the number and type of servers and customers, and adding extra subroutines.
Keywords: queueing theory, pathogen transfer and decay, environment–host contact, agent-based model, health care contact process, model framework
1. Introduction
Many pathogens, including influenza and those causing nosocomial, foodborne and waterborne diseases, are able to infect hosts via the environment without direct contact between hosts (Boyce, 2007; Eisenberg et al., 2007; Breban et al., 2009). Contaminated surfaces in hospital and other health care facilities are a major source of nosocomial infections (Pittet et al., 1999; Dancer, 2009; Otter et al., 2011; Weber & Rutala, 2013; Russotto et al., 2015), including many antimicrobial-resistant pathogens such as Clostridium difficile (Weber et al., 2010; Guerrero et al., 2012; Rutala & Weber, 2013; Landelle et al., 2014), vancomycin-resistant Enterococci (Falk et al., 2000; Levin et al., 2009), and methicillin-resistant Staphylococcus (Levin et al., 2009; Sui et al., 2012; Matsuo et al., 2013). Infectious disease models have recently expanded to explicitly address environmental exposure pathways in response to the growing awareness of the relevance of environmental transmission in disease dynamics. Commonly used are formulations similar to the mass action principle used for directly transmitted diseases in which contacts are assumed instantaneous (Boots, 1999; Xiao et al., 2005). However, in reality, contacts often have a non-negligible duration and the dose of exposure and associated probability of infection are not independent from the duration of the contact. While some of these issues have been acknowledged in microbial risk assessment (Pujol et al., 2009), they have received little consideration in modelling the spread of infectious disease. Therefore, in order to control environmentally transmitted pathogens, it is necessary to acquire a better quantitative analysis of what defines an effective contact for pathogen transfer and how realistic exposure patterns influence pathogen transfer. For instance, with respect to the process of pathogen transfer, is a series of 10 short contacts (e.g. 5 s each) with an environment (i.e. inanimate object that carries pathogens) equivalent to the effect of a single long contact (e.g. 50 s) for pathogen transfer? To address this question, we propose a modelling framework that utilizes queuing theory to incorporate a detailed description of the different contact processes to more accurately formulate them.
Queueing theory was originally developed to describe and predict the behaviour of systems that provide service to customers arriving randomly to servers or server facilities (Allen, 2011). In public health and epidemiology fields, queueing theory has been applied to tackle resource allocation problems (e.g. physicians, doctors), and study direct host-host transmissions (Trapman & Bootsma, 2009, Hernandez-Suarez et al., 2010; Michelusi et al., 2016). We suggest that besides direct transmission, queueing theory is also applicable and suitable for the environmental transmission pathways. Queueing theory provides a useful and versatile modelling framework to characterize the contact process between environmental reservoirs and hosts. In this work, to describe environmental exposures as a queuing process, we define specific environments as servers and regard hosts who contact the environments as customers. The contact process can be characterized by two parameters: the contact duration ( , which represents the duration of the contact between a specific environment and a host; and the inter-arrival rate (
 , which is the frequency of the host arrival to contact the environment. Other disciplines such as ecology use different terminology to describe this process, for example, emigration/immigration in meta-population models. In addition to simulating appropriate contact patterns, we also need to quantify pathogen transfer. This is accomplished by describing pathogen transfer as a function of both the contact duration and the pathogen decay in the environment. In this study, we integrate queueing processes into an agent-based model (ABM) which quantifies the bi-directional pathogen transfer from environment to hosts and from hosts back to the environment. Queueing theory has previously been coupled with ABMs to quantify behavioural patterns at service facilities (Sankaranarayanan et al., 2012), but this work presents the first time that both are integrated to quantify pathogen transfer. As a result, we offer a flexible, versatile, and modularly designed modelling framework to further investigate pathogen transfer burdens.
The values chosen for the queue parameters (e.g. inter-arrival rate,  , and contact duration,
  along with the selected transfer functions reflect environmental transfer in a health-care facility. In recent years, there has been increasing evidence that hospital surfaces contribute to the transmission of hospital-acquired pathogens (Breban et al., 2009; Otter et al., 2011; Weber & Rutala, 2013). In health care settings, environmental surfaces are often classified as high-touch or low-touch depending on the frequency of contacts between health-care workers/patients and the surfaces (Huslage et al., 2010, Huslage et al., 2013; Baraboutis et al., 2011; Fraser et al., 2015). Since high-touch surfaces are assumed to contribute more to pathogen transfer within hospitals, high-touch surfaces are often subject to more cleaning and decontamination compared to low-touch surfaces. However, high-touch surfaces have levels of microbial contamination similar to those found on low-touch surfaces (Huslage et al., 2013), suggesting that the relationship between contact frequency, contamination levels and actual pathogen transfer is more complex than previously acknowledged. To design effective environmental cleaning and monitoring initiatives, a better quantitative understanding of the pathogen transfer dynamics between surfaces and hosts is needed. In this article, we develop an agent-based queueing framework to evaluate the contribution of high- and low-touch surfaces to pathogen transfer and the relationship between contact frequency and contamination levels of the environments.
2. Materials and methods
We develop an agent-based modelling (ABM, Keeling & Rohani, 2008; Siebers et al., 2010; Allen, 2011; Lanzas & Chen, 2015) that integrates three main subroutines. The first subroutine uses queuing theory to model the contact process. The second subroutine defines a function to emulate the transfer/decay of pathogen given a contact duration. The third subroutine tracks the levels of pathogen contamination of environments and of hosts, and how pathogen circulate in this system. These three subroutines work collectively to form the ABM framework in which we can vary aspects of the processes such as contact duration, percentage of pathogen transfer and individual level of pathogen transferred through each contact. Unlike common ecological and epidemiological models which possess an explicit mathematical form, ABM does not have explicit expressions and is solely based on its written code and simulation (Keeling & Rohani, 2008; Grimm et al., 2010). An illustrative flowchart of how three subroutines are connected is presented in Fig. 1.
Fig. 1.

ABM diagram and subroutine description. Note: the three hierarchical subroutines (QUS, TDS, and TRS) together form the ABM in this study. Different initial pathogen distributions and feedback/non-feedback queues are not shown in this illustrative diagram, but will be incorporated into the ABM.
2.1 Contact process as a queueing system: the queueing subroutine
Since stochastic queues consider system variability in events such as actual inter-arrival rate and contact duration, they represent real-world contact processes more accurately than deterministic queues. Deterministic queue (e.g. D/D/1 queue), on the other hand, represents very specific systems where inter-arrival and contact follow strict schedule and has no variability (deterministic), and D/D/1 model can be written as ordinary differential equations. A stochastic queue in which both the mean arrival time (i.e. the inverse of inter-arrival rate) and contact duration follow exponential distributions is known as the M/M/1 queue, where  denotes the Markov property (i.e. memory less) of the exponential distribution. The M/M/1 queue is a well-studied type of queue, relatively easy to simulate, and is considered as a good approximation of many waiting/arriving and serving processes (Keeling & Rohani, 2008; Huslage et al., 2010; Huslage et al., 2013). Thus, we assume both service rate and inter-arrival rate have the Markovian property in order to develop the M/M/1 queue. The queueing systems in this study are restricted to queues that have a stable steady state (i.e. stable queues), a condition easily met in this study where mean inter-arrival time is longer than mean service time. The following terminology will facilitate understand the way we model the contact between environment and hosts using the queueing theory representation:
Server: a fixed agent in the system that provides a service for a certain amount of time. In this study, we define a server as a specific environment in the hospital setting such as a bedrail, door knob, etc.
Customer: an incoming (and outgoing) agent that is served by a server in the system. We define a customer as a host who touches the environment for a certain period of time, such as a patient or healthcare worker.
Inter-arrival rate (
 : the rate at which a customer arrives, assumed in this study to follow a Poisson process (stochastic/Markovian).
Contact duration (D): the mean time duration that a customer is served by a server. The underlying contact duration distribution follows an exponential distribution, thus also stochastic and Markovian.
Server utilization (
 :
:  , the proportion of the total time that a server is busy or, in this study, the overall percent of time that an environment is in contact with hosts.
In this study, we focus on two types of in-hospital environmental surfaces (i.e. servers) that differ with respect to frequency of contact: high-touch vs low-touch. To distinguish these two servers from one another in the model, we use different queuing parameter values for each. The low-touch server and associated queue corresponds to a smaller inter-arrival rate, relative to the high-touch queue.
(1) Queue with a low-touch server. In the studies we examined, examples of low-touch environments included armchairs, feeding tube pumps, and light switches in a hospital and corresponded on average to one contact per 5 min and a contact duration of 1 min (both follow exponential distributions; Huslage et al., 2010, 2013; Satta & Maillard, 2013; Cheng et al., 2015). Thus, we accordingly parameterize for the queue with a low-touch server the inter-arrival rate as
 0.2/min and the contact duration as
  1 min.
(2) Queue with a high-touch server. Some environmental surfaces in the hospital are more frequently touched but for briefer contact times. Bed rails, bed surfaces and supply carts were categorized as the ‘high-touch’ surfaces/environments (Catalano et al., 1999; Huslage et al., 2010) because they had the highest inter-arrival rate (i.e. shortest mean waiting time) among 52 total surfaces (28 in an intensive care unit and 24 in a surgical unit). These environmental surfaces were also categorized as high-touch by other studies in different hospital environments and children day-care centres (Cheng et al., 2015; Fraser et al., 2015). In Huslage et al. (2010), it was suggested that the inter-arrival rate was on average one contact per minute, motivating us to set the inter-arrival rate parameter to
 1/min for the queue with a high-touch server. In addition, Cheng et al. (2015) suggested an average contact duration of 0.2 min for this setting, allowing us to set
  0.2 min. for the queue with a high-touch server.
According to queueing theory, if the running time is long enough for the system to reach a steady state then these two queues will exhibit exactly the same server utilization defined as  , since 0.2/min*1min
  1/min*0.2min
  0.2. Theoretically, this means both environments are in contact with hosts on average for 20% of the total time and, since server utilization is less than 1, the queues in this study have stable steady states. To highlight the differences in the contact patterns between high-touch versus low-touch servers, we chose to consider two servers with exactly the same utilization but arose from different parameter settings. To map contact duration to the percentage of transferred pathogen, we define a mathematical function governing the transfer. If we assume that pathogen transfer does not occur during inter-arrival time, since pathogen transfer is dependent on contact duration (
 , then the percentage of pathogen transferred during the contact process can be tracked explicitly according to the transfer function on contact duration. Three different transfer functions are considered and will be discussed in the next section (also see Fig. 1).
Lastly, for the queueing subroutine, we consider two types of queues: feedback and non-feedback queues. In queueing theory, a feedback queue is the queue in which a customer can return to the same server indefinitely many times, whereas in a non-feedback queue a customer is discharged from the system forever after being served. Consequently, these two queue types are modelled differently: for feedback queues, only a finite known number of hosts are in the system and the same host can contact the server multiple times; for non-feedback queues, each individual host contacts the server exactly once before discharged. Thus, feedback queues can represent patients and healthcare workers in semi-closed facilities, such as long-term care facilities, while non-feedback queues can represent the incoming and outgoing stream of short-term (or one-time) hosts, such as emergency room/department. We aim to distinguish the difference in potential pathogen transfer for these two types of systems, their associated contact patterns, and in light of different transfer functions which are discussed next.
2.2 Pathogen transfer and decay: the transfer/decay subroutine
The relationship between contact duration and the amount of pathogen transfer depends on the specific environments and settings considered. For example, the relationship between contact duration and bacterial colony count (measured in colony forming unit, CFU) on hands or gloves can be described by a mathematical function whose form differs in various hospital wards (Pittet et al., 1999, 2000; Pujol et al., 2009; Rutala & Weber, 2013). Thus, to comprehensively bracket the potential pathogen transfer functions on contact duration, we explore three different forms for the transfer function. Table 1 provides detailed description of these function choices, labelled F , F
, F and F
and F , the graphs of which are shown in Fig. 1 (middle panel). The forms of the three functions are chosen to generally represent possible differing rates of change of transfer as contact duration increases. For instance, function F
 has a slower increase in percent transferred as contact duration increases compared to F
 and F
and F and F
and F has a much faster increase in percent transferred as contact duration increases compared to functions F
 and F
and F . Thus,in the transfer/decay subroutine we address the quantitative side regarding the percentage of pathogen that can be potentially transferred in each contact via simulation and the effect of each transfer function on actual pathogen transfer is assessed in the queueing subroutine (QUS) of the ABM. A complete description of the parameters and variables of each server/queue system considered is provided in Table 2.
Table 1.
Description of different server/queue systems in the simulation

|

|
Average inter-arrival time (min) | Average contact duration (min) | Transfer function 
|
Function type |
|---|---|---|---|---|---|
| 0.2 | 1 | Long (5) | Long (1) |

|
Linear |
| 0.2 | 1 | Long (5) | Long (1) |

|
Concave |
| 0.2 | 1 | Long (5) | Long (1) |

|
Convex |
| 1 | 0.2 | Short (1) | Short (0.2) |

|
Linear |
| 1 | 0.2 | Short (1) | Short (0.2) |

|
Concave |
| 1 | 0.2 | Short (1) | Short (0.2) |

|
Convex |
Note:
 inter-arrival rate, reciprocal to waiting time;
  : mean service time (contact duration). The two queues (high- and low-touch) have exactly the same server utilization (
 0.2).
0.2).
Table 2.
Parameter, function and symbol interpretations
| Parameters | Interpretation | Value | Note |
|---|---|---|---|

|
Mean inter-arrival rate | 0.2; 1 | Inverse of inter-arrival time |
| (Mean contact frequency) | |||
| D | Mean service time | 1; 5 | |
| (Mean contact duration) | |||

|
Server utilization | 0.2 | |
| (Percent of time in contact) | |||
| T | Total time of simulation | 10,000 | Unit in minutes |
S

|
Initial environment pathogen | 100 | Unit in CFU |
s

|
Mean initial host pathogen | 10 | Mean value from exponential distribution |
N

|
Number of total servers | 1 | Single server condition (M/M/1) |
N

|
Number of total hosts | 30 | Only applicable for the feedback queue condition |
| Function | Interpretation | Note | |
F
 (x)
(x)
|
Pathogen transfer | As a function of contact duration | |
| h(t) | Pathogen decay | As a function of inter-arrival time | |
| Symbol | Interpretation in queueing theory | Interpretation in health system | |
| C | Customer | Host | |
| S | Server | Environment |
Each transfer function is required to be a monotonically increasing function of contact duration, as longer contact should always result in more pathogen transfer. Additionally, since pathogen transfer is described as a percentage, we decided to also scale the contact durations to be elements of [0, 1]. Thus, all three transfer functions are also required to pass through the points (0, 0) and (1, 1). In order to scale the simulated contact durations, we define a maximum threshold value for contact duration of 30 min (according to Pittet et al., 1999) and then scale all the simulated contact durations to this threshold. Thus, any contact duration longer than the threshold (30 min) will be truncated, resulting pathogen transfer a value of 1. According to probability theory regarding the cumulative distribution function of the exponential distribution, the probability of observing a contact duration longer than 30 min for high- and low-touch queue systems is less than 10 and 2.5*10
 , respectively. Thus, at most, only 0.25% simulated contact durations are truncated. Since the range of the transfer function is also [0,1], if the contact duration is greater than or equal to 30 min, the pathogen transfer efficacy is 100% (maximum), meaning all pathogens present on the surface contacted are transferred.
Thus far, we have established the link between pathogen transfer and contact durations. The natural decay of pathogen could also occur during the inter-arrival time (Catalano et al., 1999) and this can be easily simulated as well, assuming contact duration is much shorter than inter-arrival time (which ensures stable steady state of the system) and therefore, pathogen decay during the duration of a contact can be neglected. Here, we use a widely adopted negative exponential function to model pathogen decay against time. During the inter-arrival time, pathogen decays and the percentage of loss is determined by an exponential function of inter-arrival time, t, given as  exp(-t/150),where the value of
  at any time
  represents the percentage (i.e. 0–100%) of pathogen decay. The actual quantity of pathogen that decays out of the queue is based on this percentage and the amount of pathogen currently present in the server. Similar to the scaling done for the transfer function, a maximum allowed inter-arrival time of 150 min is set and all simulated inter-arrival times are then scaled with respect to this maximum value. We suggest that 150 min is an appropriate maximum for scaling since the probability of observing an inter-arrival time longer than 150 min is sufficiently small (i.e. < 10
 for both low- and high-touch servers).
2.3 Host–environment interactions: the tracking subroutine
To simulate the effects of each host’s interaction with the environment, we model hosts and the environment as individual ‘agents’ of the system through the tracking subroutine (TRS), which is the core of the subroutines within the ABM framework which relies on the output of previous subroutines QUS and transfer/decay subroutine (TDS). For instance, the characteristics of contact and contact duration of hosts with the environment are determined in the QUS and the characteristic governing transfer and decay are defined in TDS. Here, in the TRS, these characteristics are used to model the bi-directional transfer of the pathogen between hosts and environment, where we assume that hosts and environment each carry a certain quantity of pathogen (measured in CFU) which changes based on contact process. The TRS tracks these amounts for each host and the environment.
We set up the following rules of transfer when a host comes into contact with an environment: if a host carries a larger amount of pathogen than the environment then the transfer is from the host to the environment; and if the environment carries more pathogen than the host then the direction of transfer is reversed. For example, assume that an arriving host has 10 CFU pathogen and that this host is in contact for one minute with an environment that has a pathogen amount of 10
 CFU, then the pathogen will transfer from the environment to the host based on the rules of transfer; and the net pathogen transfer amount will be
  (1/30)*10
 CFU, where
  (t) is a transfer function and 30 is the maximum contact duration threshold. If, instead, the host carries 10
 CFU pathogen, then the transfer will be from the host to the environment with a net pathogen transfer amount of
  (1/30)*10
 .
.
2.4 Collective integration of QUS, TDS, and TRS and initialization of simulations
In summary, the contact duration and inter-arrival times are determined according to the QUS, where we explore both low- and high-touch servers. Then, the percentage of pathogen transfer and pathogen decay are computed during contact and inter-arrival time, respectively, through the functions defined in the TDS, where three different transfer functions are explored. Finally, we use the percentages from the TDS together with the contact process characteristics defined by the QUS and the corresponding rules of transfer in the TRS to update the pathogen amount in each of the individual hosts and in the environment based on current pathogen amounts in each. Also, the TRS is setup to run as either a feedback or a non-feedback system as described earlier. To initiate the amounts of pathogen in each host in the TRS at the beginning of the simulation, initial pathogen amounts follow an exponential distribution, so as to reflect variability in carriage among hosts. The environment is initialized with a fixed value of colony forming unit, CFU counts (10 CFU) which is used as the initial value for all the simulations. In this study, since we focus on an M/M/1 queue, there is only one environment; however, this can be readily extended to include multiple environments and the initial pathogen amount on each of the environments can vary as well.
With respect to the amount of pathogen in each host at the start of a simulation we explore various initial conditions. First, we simulate scenarios in which hosts and the environment are initialized with positive amounts of pathogen, where hosts have varying pathogen amounts according to an exponential distribution with shape parameter 10 (corresponding to the mean pathogen amount in hosts is 10 CFUs), and the environment (server) has a fixed initial value of 10
 CFUs pathogen amount. As a second initial condition, we set the initial pathogen amount in the environment to be as in the first scenario (i.e. 10
 CFUs) but now all the hosts are thoroughly sanitized such that hosts carry zero CFU initially. The third and last initial condition considers a thoroughly sanitized environment such that there are zero CFU in the environment initially but now the hosts have an exponentially distributed pathogen amount on them, with a mean of 10 CFUs. These different initial conditions simulate and assess the effectiveness of various decontamination and sanitizing strategies to control nosocomial infection (Pittet, 2003; Bhalla et al., 2004; Dancer, 2009; Satta & Maillard, 2013; Weber & Rutala, 2013).
Given the various options we consider in the three subroutines as well as the three different initialization scenarios, there are four sources of potential variability in this study: low- and high-touch queues, associated with QUS; three different transfer functions, associated with TDS; and feedback versus non-feedback system along with three different initial conditions, associated with TRS. Thus, there are a total of 36 combinations ( ) of simulation settings to consider.
The ABM simulation starts at time 0 and runs for 10,000 time units. At the end of each simulation, we provide the simulated server utilization and theoretical utilization (i.e. 0.2) to verify whether the simulated queueing systems behave as they should. Several important metrics are recorded and compared across those different scenarios. These metrics include mean pathogen amount in the environment and in hosts at any given minute, total pathogen transfer from/to hosts, and the average pathogen transfer from/to hosts per contact. Note that the average pathogen transfer is irrelevant to time and is only related to the number of contacts, regardless of duration of each contact. We also test whether an environment with higher mean pathogen amount is associated with more pathogen transfer to the hosts. We also test whether there are significant differences in these metrics given the variability (low- and high-touch queues, transfer functions, etc.) in the system through multivariate analysis of variance (MANOVA).The dependent variables are the metrics and we do not consider potential interactions independent variables in MANOVA (four sources of variability, e.g. queue types, transfer functions, etc). A comprehensive Overview, Design Concepts, Detail protocol describing the ABM (Grimm et al., 2010) is provided as Supplementary material. The models and subsequent analyses are formulated in  (version 3.1). The codes are freely available upon request.
2.5 Model verification
The queueing subroutine (QUS) generates all the timing information in the system (e.g. length of each contact duration and inter-arrival time). The histograms of simulated server utilization in low- and high-touch systems are shown in Fig. 2. The mean simulated utilization (vertical blue lines) approximates the theoretical value of the server utilization (vertical red lines) very well, with errors less than 0.005 for both low- and high-touch queue systems. Thus, we conclude that the QUS works properly and the outputs from QUS can be readily used in the TDS and TRS.
Fig. 2.
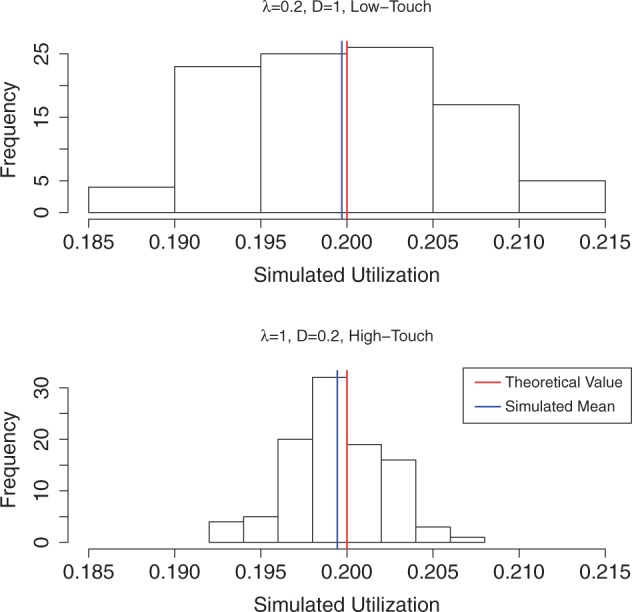
Simulated and theoretical server utilization under low- and high-touch systems. Note: Both systems have the same theoretical utilization (0.2), and simulated means (from 100 realizations) are very good approximation of the theoretical value.
The numeric values of contact durations generated from QUS (for both low-touch and high-touch environments) are evaluated individually by the transfer function used in TDS of which three are considered. One single decay function is applied during inter-arrival time to evaluate pathogen decay, and the percent of pathogen loss during the inter-arrival times is independent of the transfer functions. We provide the actual distribution of pathogen transfer percent of low-touch and high-touch environments in Figs. 3 and 4, respectively. Since we associate a low-touch environment with a longer average contact duration of  1, it is not surprising that the percent of pathogen transfer is higher in low-touch environment than the high-touch counterpart which is associated with a shorter average contact duration of
  0.2. This characteristic is seen in Figs. 3 and 4 for each of the three transfer functions. Overall, when comparing among the three transfer functions, the concave function (
 yields the largest percent of pathogen transfer among the three functions considered, and the convex function (
 yields the least of the three. These outcomes are consistent for both low- and high-touch environments.
Fig. 3.

Distribution of percent of pathogen transfer per contact–-low-touch system ( ). Note: Vertical bar represents the mean value. The three functions have exactly the same inputs (contact durations). The outputs are significantly different for the three functions.
Fig. 4.

Distribution of percent of pathogen transfer per contact—high-touch system ( ). Note: Vertical bar represents the mean value. The three functions have exactly the same inputs (contact durations). The outputs are significantly different for the three functions.
2.6 Investigating the relationship between mean pathogen in environment and total potential transfer
In practice, it is difficult to track and measure the total amount of pathogen that has been transferred from the environment to hosts (or from hosts to the environment) over a certain period of; yet it is an important factor to assess the potential of nosocomial infections to occur. On the other hand, it is relatively straightforward to quantify the amount of pathogen in the environment such as how many CFU of pathogen or spores are on a given surface. Thus, our simulation study will aim to quantify the relationship between mean pathogen in environment and total amount of potential pathogen transfer in a given period of time to reveal any potential link between them. For this exploration, we expand the server utilization ( to three different levels: 0.2, 0.4, and 0.6 while also considering high- and low-touch environments, three transfer functions as described before, but only one initialization where both the environment and the hosts have positive levels of pathogen initially (10
 CFU for the environment; and an amount exponentially distributed with mean 10 CFU for the hosts). Thus, to investigate the relationship between mean pathogen in environment and total potential transfer, we consider 18 (
 ) different simulation settings. To simplify this case, we also assume that there is no pathogen decay during the inter-arrival time (i.e.
  (t)
(t) 0). The outputs of interest here are the total pathogen transfer from environment to hosts, as well as transfer from hosts to environment.
3. Results
3.1 Quantifying pathogen transfer difference in different conditions
We showed the mean pathogen in environment, total pathogen transferred to hosts, and total pathogen transferred to environment for all the simulated scenarios in Fig. 6. The conditions with no pathogen input from incoming hosts (the null host cases, corresponding to condition number 13–24), have the lowest values of the three metrics as well as very small variability (demonstrated by the quartiles, i.e. the ‘boxes’ in Fig. 5) among all the 36 conditions. The top three conditions for mean pathogen in the environment are 6, 33 and 30, corresponding to HT/NF/BOTH/Concave; LT/F/NULL ENV/Concave; and HT/NF/NULL ENV/Concave conditions (Fig. 6, top panel). The top three conditions for total pathogen transfer to hosts are 5, 32 and 29, corresponding to HT/NF/BOTH/Convex; LT/F/NULL ENV/Convex; and HT/NF/NULL ENV/Convex conditions (Fig. 5 middle panel). Note these top three conditions for total pathogen transfer to hosts are the counterparts (convex vs concave) of the top three conditions for mean pathogen in the environment. In other words, convex transfer functions tend to preserve more pathogen in the environment, but concave transfer functions tend to circulate more pathogen while maintaining less pathogen in the environment. Besides, the top three conditions are not numerically distinct from lower ranked conditions (i.e. the values are not substantially larger) in mean pathogen and total pathogen transfer to hosts (Fig. 6, upper and middle panels). In contrast, the top three conditions for pathogen transfer from hosts to environments (conditions 26, 2, 8, corresponding to LT/NV/NULL ENV/Convex, LT/NF/BOTH/Convex, and LT/F/BOTH/Convex conditions) are numerically distinct even with the 4th condition right after (condition 8 vs condition 32, approximately 1500 vs less than 750; or the lowest number in condition 8 is almost as much as the largest number in condition 32, see Fig. 5, lower panel). These results show that complicated interactions between contact frequency (low- or high-touch), transfer functions, and initial pathogen distribution substantially alter pathogen flow pattern between hosts and environment.
Fig. 6.

Relationship between mean pathogen in environment and total pathogen transfer to hosts and to environment. Note: Left panel: total pathogen transfer from environment to hosts; right panel: total pathogen transfer from hosts to environment. Note the high correlation between these two panels (despite the range/scale differences in  -axis).
Fig. 5.

Comparison of mean pathogen in environment, total pathogen transfer to hosts, and total pathogen transfer to environment in all simulated conditions. Low-touch (LT) vs high-touch (HT); Non-feedback (NF) vs Feedback (F); Initial pathogen on both hosts and environment (BOTH) vs no initial pathogen on hosts (NULL HOSTS) vs no initial pathogen on environment (NULL ENV). 1–3 are for linear, convex, and concave functions. And this sequence is the same for all conditions hereafter (e.g., 4–6, 7–9 are linear, convex, concave, linear, convex, concave). Conditions 1–3: LT/NF/BOTH; conditions 4–6: HT/NF/BOTH; conditions 7–9: LT/F/BOTH; conditions 10–12: HT/F/BOTH; conditions 13–15: LT/NF/ NULL HOSTS; conditions 16–18: HT/NF/NULL HOSTS; conditions 19–21: LT/F/ NULL HOSTS; conditions 22–24: HT/F/ NULL HOSTS; conditions 25–27: LT/NF/ NULL ENV; conditions 28–30: HT/NF/NULL ENV; conditions 31–33: LT/F/NULL ENV; conditions 34–36: HT/F/NULL ENV.
We validate the assumptions of MANOVA beforehand (normality, homoscedasticity). Results show that all four factors (low- and high-touch, transfer functions, initial pathogen distribution, and queue types) have significant impacts ( < 0.01, Wilks test) on response metrics (mean pathogen in environment, total pathogen transferred to/from hosts, and average pathogen transferred to/from hosts per contact). Thus, we conclude that all these different factors will lead to very different pathogen transfer and circulation pattern in the simulated health care settings. The more comprehensive, aggregated numeric results and interpretations for pathogen transfer and other metrics in this study for all 36 conditions are provided in Supplementary Fig. S1 through Supplementary Fig. S3.
3.2 The relationship between mean pathogen in environment and total pathogen transfer
The relationship between mean pathogen in environment and total pathogen transferred in various conditions are shown in Fig. 6. In general, conditions with convex transfer functions (colour coded with green) have substantially lower total pathogen transfer (both from environment to hosts and from hosts to environment) than linear and convex transfer functions (colour coded with black and red, respectively). Besides, conditions with convex functions also retain the most pathogen in the environment as well. Conditions with concave functions have the largest amount of pathogen transfer (both from and to hosts). Low-touch conditions (coded as hollow symbols) are always accompanied with higher total pathogen transfer (both from and to hosts) and lower mean pathogen in environment than their high-touch counterparts (coded as filled symbols). Server utilizations ( values, coded with different shapes) do not have a clear and definitive relationship with mean pathogen load and total pathogen transfer. Thus if we determine mean pathogen in environment, it is possible that we establish a quantitative link with pathogen transfer to and from hosts in a given period of time, or at least a potential interval estimation. Furthermore, there is a highly positive correlation between total pathogen transfer to and from hosts (with Pearson correlation
  > 0.95), and intuitively it means the more the system transfers pathogen to the hosts, the more the hosts transfer pathogen back.
3.3 Other important discovery in this study
Our important finding in this study is that the total amount of pathogen transfer from environment to host can be 300–600 times higher than the average pathogen amount within the environment (mid-left panel vs top-right panel in both Supplementary Figs S1 and S3). For example, while non-feedback high-touch environment has an average of 3.3*10CFU pathogen at any given moment, there can be as much as 2.2*10 CFU pathogen transferred during the period of 10,000 min (approximately 1 week). This is due to the ‘pathogen flow’ between environment and hosts in the system. We discuss more implications of this finding in the second paragraph of Section 4 in this article.
4. Discussion
In this study, we have systematically explored and demonstrated how queueing theory can be coupled with ABM approach to model and understand complicated heterogeneous host-environment contact structure and nonlinear pathogen transfer in various health-care settings. We provide a comprehensive, modularized, and user-customizable modelling framework that consists of three easy to adjust and manipulate subroutines for real-world scenarios. We demonstrate that different contact scenarios (low- and high-touch, feedback and non-feedback examples) can yield substantially different amount of pathogen transfer under various pathogen transfer. In general, there is no definitive answer as to which contact scenario is consistently more important in host-environment contact. For instance, while low-touch system maintains less pathogen in the environment in the long-run, the total amount of pathogen transferred to hosts is higher than the high-touch system given the same utilization  . This finding is an important complementary to our current knowledge (Baraboutis et al., 2011; Satta & Maillard, 2013). Besides, initial conditions also substantially change the dynamics of the systems as well and shed light to potential mitigation strategies of nosocomial pathogen (Dancer, 2009; Weber & Rutala, 2013). Thus, there is an emergent need to further study the realistic transfer function between contact duration and pathogen transfer in health-care settings.
We have discovered that the total pathogen transfer can be hundreds of times higher than the mean pathogen load in the environment. How could that be? It actually lies in the fact that the system is dynamic and pathogen can transfer bi-directionally, both from host to environment and from environment to host (and subject to the initial condition, as we have demonstrated above, if there is no initial pathogen in the hosts, then the system is unidirectional and pathogen can only transfer to the hosts, NOT from the hosts). An analogue in ecology is the concepts of ‘source’ and ‘sink’ in meta-population models (Keeling & Rohani, 2008), and the role of ‘source’ and ‘sink’ is not permanent for environment and host for some cases in this study (but permanent for the case where no initial pathogen presents in hosts). When environment pathogen decreases and is less than that of an incoming host, host automatically becomes the ‘source’ and nourishes the environment by transferring pathogen back to the environment, which creates a ‘pathogen flow’ in this system. Thus, although the pathogen amount in environment can be relatively low (e.g. below certain threshold or limit), the potential of pathogen transfer to the hosts can be significantly higher.
Because of the flexibility of this modelling framework, researchers can integrate various hygiene practices into this model and quantitatively assess their effectiveness (Pittet, 2003; Satta & Maillard, 2013). For example, hygiene practice could be modelled as a special process of decay of pathogen in the environment. Currently there is only one type of customer (the host) in this model, and our model can accommodate health-care staff that carries out the regular hygiene practice (i.e. carry out at fixed scheduled time). This can be easily modelled as the server interruption and a hybrid queue (contains both stochastic and deterministic inter-arrival and contact durations).Since QUS and TDS/TRS are separate subroutines, we can further work on various hygiene efficacy scenarios. Thus, it can lead to more efficient and accurate design of hygiene practice, and evaluation of the potential risk of pathogen transfer due to healthcare staff.
While the M/M/1 queue studied in this paper is a simple model, it serves as the foundation of complex queues (e.g. the hybrid queue mentioned above) and more realistic queueing networks, which contain an array of different inter-connected servers (Allen, 2011).We can apply the basic ideas, concepts and modelling framework in this study to investigate how pathogens transfer between multiple hosts and various environments. As the results of this study have already demonstrated, both low- and high-touch environments exist in health-care settings and are responsible for pathogen transfer. Thus we can expand the single-server condition in this study to queueing network with various servers, each of which has its own distinctive parameters (e.g.  and
and  . We can track and model the sequence of the contacts between hosts and these various environments and develop a more accurate model for tracking pathogen transfer in health-care settings. Besides, this study utilizes the homogeneous Poisson process (HPP) to build the QUS (i.e.
  and
and  do not change through time), however these parameters can actually change through time. For instance, the inter-arrival rate should be much lower during night than day. This can be easily adjusted in our modelling framework by adopting the non-homogeneous Poisson process (NHPP) instead of HPP, and NHPP has been studied extensively in applied queueing theory literature (Lee et al., 1991).
Besides the practical usefulness and advantage of our proposed modelling framework, there is a theoretical discovery as well. We have demonstrated that the total pathogen transferred from environment to hosts (in just single-server scenario) can be hundreds of times more than the environment’s carrying capacity of the pathogen, in a certain period of time. Such a pattern of rapid circulation of pathogen can create risk of infection and transmission in health-care settings (Codeco, 2001; Breban, 2013; Chen et al., 2013; note that we only discuss pathogen transfer but NOT infection or transmission). We have already quantified the importance of heterogeneity and nonlinearity for pathogen transfer between host and environment in this study, and new infection can be modelled as another nonlinear response based on the amount of pathogen transfer (as well as host-specific susceptibility).
Funding
This work was supported by the joint NSF/NIGMS Mathematical Biology Program through NIH award R01GM113239. The research work of C.L. is partially supported by the U. S. Army Research Office under grant (No. W911NF1410216).
Supplementary material
Supplementary material is available at http://imammb.oxfordjournals.org.
References
- Allen T. T. (2011) Introduction to Discrete Event Simulation and Agent-Based Modeling. London: Springer. [Google Scholar]
- Baraboutis I. G. et al. (2011) Length of exposure to the hospital environment is more important than antibiotic exposure in healthcare associated infections by methicillin-resistant Staphyloccoccus aureus: a comparative study. Braz. J. Infect. Dis., 15, 426–435. [DOI] [PubMed] [Google Scholar]
- Bhalla A. et al. (2004) Which strategies follow from the surveillance of multidrug-resistant bacteria to strengthen the control of their spread? A French experience. Infect. Control Hosp. Epidemiol., 25, 164–167. [DOI] [PubMed] [Google Scholar]
- Boots M. (1999) A general host–pathogen model with free-living infective stages and differing rates of uptake of the infective stages by infected and susceptible hosts. Res. Popul. Ecol., 41, 189–194. [Google Scholar]
- Boyce J. M. (2007) Environmental contamination makes an important contribution to hospital infection. J. Hosp. Infect., 65, s50–s54. [DOI] [PubMed] [Google Scholar]
- Breban R. (2013) Role of environmental persistence in pathogen transmission: a mathematical modeling approach. J. Math. Biol., 66, 535–546. [DOI] [PMC free article] [PubMed] [Google Scholar]
- Breban R. et al. (2009) The role of environmental transmission in feedback avian influenza epidemics. PLoS Comput. Biol., 5, e1000346. [DOI] [PMC free article] [PubMed] [Google Scholar]
- Catalano M. et al. (1999) Survival of Acinetobacter baumannii on bed rails during an outbreak and during sporadic cases. J. Hosp. Infect., 42, 27–35. [DOI] [PubMed] [Google Scholar]
- Chen S. et al. (2013) Temporal-spatial heterogeneity in animal-environment contact: implications for the exposure and transmission of pathogens. Sci. Rep., 3, 1112.. [DOI] [PMC free article] [PubMed] [Google Scholar]
- Cheng V. C. C. et al. (2015) Hand-touch contact assessment of high-touch and mutual-touch surfaces among healthcare workers, patients, and visitors. J. Hosp. Infect., 90, 220–225. [DOI] [PubMed] [Google Scholar]
- Codeco C. (2001) Endemic and epidemic dynamics of cholera: the role of the aquatic reservoir. BMC Infect. Dis., 1, 1. [DOI] [PMC free article] [PubMed] [Google Scholar]
- Dancer S. J. (2009) The role of environmental cleaning in the control of hospital-acquired infection. J. Hosp. Infect., 73, 378–385. [DOI] [PubMed] [Google Scholar]
- Eisenberg J. N. S. et al. (2007) Environmental determinants of infectious disease: a framework for tracking causal links and guiding public health research. Environ. Health Persp., 115, 1216–1223. [DOI] [PMC free article] [PubMed] [Google Scholar]
- Falk P. S. et al. (2000) Outbreak of vancomycin-resistant enterococci in a burn unit. Infect. Control, 21, 575–82. [DOI] [PubMed] [Google Scholar]
- Fraser A. et al. (2015) An observational study of frequency of provider hand contacts in child care facilities in North Carolina and South Carolina. Am. J. Infect. Control, 43, 107–111. [DOI] [PubMed] [Google Scholar]
- Grimm V. et al. (2010) The ODD protocol: a review and first update. Ecol. Model., 221, 2760–2768. [Google Scholar]
- Guerrero D. M. et al. (2012) Acquisition of spores on gloved hands after contact with the skin of patients with Clostridium difficile infection and with environmental surfaces in their rooms. Am. J. Infect. Control, 40, 556–558. [DOI] [PubMed] [Google Scholar]
- Hernandez-Suarez C. M. et al. (2010) An application of queueing theory to SIS and SEIS epidemic models. Math. Biosci. Eng., 7, 809–823. [DOI] [PubMed] [Google Scholar]
- Huslage K. et al. (2010) A quantitative approach to defining “high-touch” surfaces in hospitals. Infect. Control Hosp. Epidemiol., 31, 850–853. [DOI] [PubMed] [Google Scholar]
- Huslage K. et al. (2013) Microbial assessment of high-, medium-, and low-touch hospital room surfaces. Infect. Control Hosp. Epidemiol., 34, 211–212. [DOI] [PubMed] [Google Scholar]
- Keeling M. J. & Rohani P. (2008) Modeling Infectious Disease in Humans and Animals. Princeton, NJ, 08540, USA: Princeton University Press. [Google Scholar]
- Landelle C. et al. (2014) Contamination of health care workers’ hands with Clostridium difficile spores after caring for patients with C. difficile infection. Infect. Control Hosp. Epidemiol., 35, 10–15. [DOI] [PubMed] [Google Scholar]
- Lanzas C. & Chen S. (2015) Complex system modeling for veterinary epidemiology. Prev. Vet. Med., 118, 207–214. [DOI] [PubMed] [Google Scholar]
- Lee S., Wilson J. R. & Crawford M. M. (1991) Modeling and simulation of a nonhomogeous Poisson process having cyclic behavior. Commun. Statist., 20, 777–809. [Google Scholar]
- Levin P. D. et al. (2009) Contamination of portable radiograph equipment with resistant bacteria in the ICU. Chest J., 136, 426–432. [DOI] [PubMed] [Google Scholar]
- Matsuo M., Oie S., & Furukawa H. (2013) Contamination of blood pressure cuffs by methicillin-resistant Staphylococcus aureus and preventive measures. Ir. J. Med. Sci., 182, 707–709. [DOI] [PMC free article] [PubMed] [Google Scholar]
- Michelusi N. et al. (2016) Queuing models for abstracting interactions in bacterial communities. IEEE J. Selected Areas Commun., 34, 584–599. [Google Scholar]
- Otter J. A., Saber Y. & French G. L. (2011) The role played by contaminated surfaces in the transmission of nosocomial pathogens. Infect. Control Hosp. Epidemiol., 32, 687–699. [DOI] [PubMed] [Google Scholar]
- Pittet D. (2003) Hand hygiene: improved standards and practice for hospital care. Curr. Opin. Infect. Dis., 16, 327–335. [DOI] [PubMed] [Google Scholar]
- Pittet D., Dharan S., & Touveneau S. (1999) Bacterial contamination of the hands of hospital staff during routine patient care. Arch. Intern. Med., 159, 821–826. [DOI] [PubMed] [Google Scholar]
- Pittet D. et al. (2000) Effectiveness of a hospital-wide programme to improve compliance with hand hygiene. Lancet, 356, 1307–1312. [DOI] [PubMed] [Google Scholar]
- Pujol J. M. et al. (2009) The effect of ongoing exposure dynamics in dose response relationships. PLoS Comput. Biol., 5, e1000399. [DOI] [PMC free article] [PubMed] [Google Scholar]
- Russotto V. et al. (2015) Bacterial contamination of inanimate surfaces and equipment in the intensive care unit. J. Intensive Care, 3, 54. [DOI] [PMC free article] [PubMed] [Google Scholar]
- Rutala W. & Weber D. J. (2013) Role of the hospital environment in disease transmission, with a focus on Clostridium difficile. Healthcare Infect., 18, 14–22. [Google Scholar]
- Sankaranarayanan K. et al. (2012) Behavioral queueing: an agent-based modeling approach. Int. J. Model. Optim., 2, 408–412. [Google Scholar]
- Satta S. A. & Maillard J. (2013) The crucial role of wiping in decontamination of high-touch environmental surfaces: review of current status and directions for the future. Am. J. Infect. Control., 41, S97–S104. [DOI] [PubMed] [Google Scholar]
- Siebers P. O. et al. (2010) Discrete-event simulation is dead, long live agent-based simulation! J. Simul., 4, 204–210. [Google Scholar]
- Sui Y. S. et al. (2012) Effectiveness of bacterial disinfectants on surfaces of mechanical ventilator systems. Respir. Care, 57, 250–256. [DOI] [PubMed] [Google Scholar]
- Trapman P. & Bootsma M. C. J. (2009) A useful relationship between epidemiology and queueing theory: the distribution of the number of infectives at the moment of the first detection. Math. Biosci., 219, 15–22 [DOI] [PubMed] [Google Scholar]
- Weber D. J. & Rutala W. A. (2013) Understanding and preventing transmission of healthcare-associated pathogens due to the contaminated hospital environment. Infect. Control Hosp. Epidemiol., 34, 449–452. [DOI] [PubMed] [Google Scholar]
- Weber D. J. et al. (2010) Role of hospital surfaces in the transmission of emerging health care-associated pathogens: norovirus, Clostridium difficile, and Acinetobacter species. Am. J. Infect. Control., 38, S25–S33. [DOI] [PubMed] [Google Scholar]
- Xiao Y. N. et al. (2005) Understanding the dynamics of Salmonella infections in dairy herds: a modelling approach. J. Theor. Biol., 233, 159–175. [DOI] [PubMed] [Google Scholar]