

Abstract
There are currently no standardized protocols for pre-analytical handling of urine to best preserve small RNA for miRNA profiling studies. miRNA is an attractive candidate as a potential biomarker because of the high level of stability in body fluids and its ability to be quantified on multiple high-throughput platforms. We present a comparison of small RNA recovery and stability in urine under alternate pre-analytical handling conditions and extend recommendations on what conditions optimize yield of miRNA from cell-free urine and urine extracellular vesicles (EVs). Using an affinity slurry for isolation of small RNA from urine, we found that urine samples held at room temperature (20°C) for up to 8 hours before processing yield the highest amounts of intact small RNAs from EVs. Some miRNA is lost from urine samples when held 2°C to 4°C and/or frozen before EV isolation, likely because of EV entrapment in uromodulin precipitates. However, we found that a simple 5-minute incubation of urine containing cold-induced precipitate at 37°C resolubilizes much of this precipitate and results in an increased recovery of EVs and miRNAs. Finally, small RNA integrity can be compromised when whole urine is held at 37°C for as little as 4 hours and is not conducive to efficient miRNA profiling.
CME Accreditation Statement: This activity (“JMD 2018 CME Program in Molecular Diagnostics”) has been planned and implemented in accordance with the accreditation requirements and policies of the Accreditation Council for Continuing Medical Education (ACCME) through the joint providership of the American Society for Clinical Pathology (ASCP) and the American Society for Investigative Pathology (ASIP). ASCP is accredited by the ACCME to provide continuing medical education for physicians.
The ASCP designates this journal-based CME activity (“JMD 2018 CME Program in Molecular Diagnostics”) for a maximum of 18.0 AMA PRA Category 1 Credit(s)™. Physicians should claim only credit commensurate with the extent of their participation in the activity.
CME Disclosures: The authors of this article and the planning committee members and staff have no relevant financial relationships with commercial interests to disclose.
Extracellular vesicles (EVs) are lipid bilayer vesicles secreted by most cell types and can be found in a variety of body fluids, including blood, saliva, amniotic fluid, cerebrospinal fluid, breast milk, and urine.1 EVs have garnered much interest during the last decade and are involved in many cellular processes, such as cell-to-cell communication2 and innate immune function,3, 4, 5 as well as being potential vectors for small molecule and drug delivery.6 In addition, EVs and their contents may be useful as biomarkers of disease.7, 8, 9, 10 EVs contain various molecular constituents of their cell of origin, including proteins, lipids, mRNAs, long noncoding RNAs, and small noncoding RNAs. One such class of noncoding RNAs, miRNAs, are molecules of 19 to 24 nucleotides in length that regulate gene expression through posttranscriptional, RNA interference and gene silencing pathways.11 miRNAs are enticing candidates as biomarkers because of the high level of stability in EVs within body fluids and their ability to be quantified on multiple platforms,12 including high-throughput efforts, such as microarrays, RNA sequencing, and NanoString nCounter (NanoString Technologies, Seattle, WA). Some investigators suggest using panels of miRNAs from EVs for discovering new biofluid-based biomarkers for pancreatic cancer13 and colorectal cancer.14
Urine is an appealing biofluid source for clinical analysis and biomarker studies because of its completely noninvasive sampling, high-volume collection, and ease of repeat measurements. The goal of this study is to assess the feasibility of the detection of miRNAs in urine EVs under different pre-analytical handling conditions as might be encountered in freshly collected samples in a clinical laboratory or biobanked urine specimens.
Materials and Methods
This study was approved by the Committee for the Protection of Human Subjects at the Geisel School of Medicine at Dartmouth (approval number 22781). Urine samples were obtained from volunteers after they provided written and informed consent, and all spot urine samples were collected between the hours of 7 and 10 am. Donors for this study included healthy volunteers (n = 9; 4 men and 5 women; means ± SD age, 33.56 ± 13.15 years) and, to explore potential applicability to disease, patients with cystic fibrosis (CF) (n = 8; 4 men and 4 women; homozygous for the F508del phenotype; means ± age, 26.75 ± 6.63 years) and patients with renal transplant or chronic kidney disease (CKD) (n = 10; 7 men and 3 women; means ± age, 54.0 ± 19.26 years).
Urine Handling, Processing, and Storage
Assorted handling conditions (time and temperature) were tested to simulate numerous scenarios that researchers and laboratory medicine personnel may encounter in the pre-analytical phase of urine collection for miRNA analysis. Whole urine is defined as spot urine with no centrifugation or filtration steps to eliminate cells and debris. Whole urine is commonly encountered in biobanked urine samples and with clinical laboratory investigations. A primary concern with the use of whole urine samples for analysis is the issue of multiple freeze-thaws, with residual cells rupturing and releasing intracellular contents into the biofluid. The term preprocessing refers to a two-step centrifugation process at 200 × g for 10 minutes followed by 1000 × g for 10 minutes to eliminate cells and debris to generate a cell-free urine sample. With cells and cell debris removed, this cell-free urine can be stored long term at −80°C as necessary, without the concern of the effects of multiple freeze-thaws on cell lysis.
To simulate alternate urine handling circumstances the following conditions were reproduced in vitro: i) whole urine was stored at 2°C to 4°C for up to 24 hours before preprocessing; ii) whole urine was stored at 20°C for up to 24 hours before preprocessing; iii) whole urine was frozen followed by a one-time freeze-thaw before preprocessing; iv) frozen urine was thawed and then equilibrated for 5 minutes at 37°C; and v) whole urine was stored for up to 8 hours at 37°C followed by 6 hours at 2°C to 4°C before preprocessing.
EV and Small RNA Analysis
EVs and small RNA were isolated via Norgen B1 slurry and the Norgen Exosome RNA Isolation Kit (Norgen Biotek, Thorold, Ontario, CA) according to the manufacturer's instructions. In brief, 325 μL of B1 slurry is added to 5 mL of cell-free urine in a 15-mL conical tube, vortexed, and allowed to equilibrate at 20°C for 20 minutes with occasional vortexing. Samples are centrifuged at 1000 × g for 5 minutes, supernatant is drawn off, and the pellet is drained of excess volume by inversion. Pellet is resuspended in 325 μL of lysis buffer, vortexed, and allowed to equilibrate 15 minutes at 20°C. The pellet suspension is then combined with 325 μL of 67% isopropanol, vortexed, and transferred to a minispin column. Three successive washes with 400 μL of wash solution are followed by a drying spin (microfuge, 15,000 × g for 2 minutes) and elution in 100 μL of elution buffer. miRNA was then purified and concentrated using Amicon Ultra 0.5 columns (Millipore, Billerica, MA) and a Speed Vac as previously described.15 A slightly modified protocol was used in isolation of EVs for transmission electron microscopy (TEM) and nanoparticle tracking analysis (NTA), whereby the EVs in urine were first allowed to bind to the affinity slurry and then eluted intact in 100 μL of 1× phosphate-buffered saline (PBS). Negative staining TEM was performed using the drop wash method with uranyl formate as previously described.16 Briefly, a 10-μL aliquot of EVs in 1× PBS was placed on top of formvar-coated 300 mesh Cu grids (Electron Microscopy Science, Hatfield, PA) for 1 minute. The grid was then placed in succession (<1 second each) on two separate drops of PBS, two drops of H2O, followed by two drops of 2% uranyl formate, and then left on a final drop of uranyl formate for 30 seconds. All TEM images were taken at 100 kV on a JEOL TEM1010 equipped with a XR-41B AMT digital camera and capture engine software (AMT version 602; Advanced Microscopy Techniques, Woburn, MA).
Small RNA was quantified with the Bio-Analyzer 2100 (Agilent, Santa Clara, CA) and the small RNA chip. miRNA profiling was performed using the NanoString nCounter miRNA assay version 3.0.15 Real-time quantitative PCR was performed on a Bio-Rad CFX96 Real Time system with a C1000 thermocycler and analyzed with CFX Manager software version 1.6 (Bio-Rad, Hercules, CA) using TaqMan Advanced miRNA assays (Thermo Fisher Scientific, Waltham, MA) according to manufacturer's instructions. Specific miRNAs were selected based on the presence of high read counts in prior Nanostring nCounter analyses. NTA with the Nanosight NS300 instrument (Malvern, Worcestershire, UK) was used to determine mean EV particle size and concentrations as previously described.17 For NTA, EV samples were diluted in PBS and introduced into the sample chamber via syringe pump. The following script was used for EV measurements: PRIME, DELAY 120, CAPTURE 30, REPEAT 3. Other acquisition settings included the following: camera level, 14; camera shutter speed, 13 milliseconds; camera gain, 360, and laser, blue 488. NTA postacquisition settings were optimized and kept constant among samples. Software used was NTA version 3.2 Dev. Build 3.2.16 (Malvern).
Statistical Analysis
All data were presented as means ± SD. Graph Pad Prism version 7.0 (GraphPad Software, San Diego, CA), Cluster/TreeView, t-tests, Tukey-Kramer honestly significant difference, and Spearman correlations were used along with Partek Genomics Suite 6.6 (Partek, St. Louis, MO) for paired sample t-test to determine differential miRNA expression.
Results
Characterization of Urine EVs
TEM and NTA (NanoSight NS300) were used to visualize isolated EVs (Figure 1, A and B, and Supplemental Video S1). EVs were 50 to 600 nm in diameter. Donors for this study included healthy volunteers and, to explore potential applicability to disease, patients with CF as a disease model. NTA of EVs isolated from urine obtained from healthy individuals and individuals with CF had mean particle counts in the range of 5 to 23 × 107/mL of cell-free urine and did not differ significantly between healthy and CF biospecimens (Figure 1C). In addition, mean particle size range was 140 to 180 nm in diameter and again did not differ significantly between healthy and CF biospecimens (Figure 1D). Moreover, to examine single donor EV variability and assess short-term EV storage stability, urine was collected for several days from one healthy donor during a period of 10 days. EVs were isolated at days 1, 2, 3, 6, and 10, stored at 4°C, counted, and sized on day 11. No major differences in concentration or size were observed among these samples or with a 10-day short-term storage at 4°C (Figure 1, E and F).
Figure 1.

Visualization, particle counting, and particle sizing of urine extracellular vesicles (EVs). EVs were isolated from cell-free urine via Norgen affinity slurry B1 (Materials and Methods).15A and B: Particles were imaged using both negative staining transmission electron microscopy (A) and nanoparticle tracking analysis (NTA) (B). NTA was also used for particle counting and particle sizing. Urine EVs were isolated from healthy controls and patients with cystic fibrosis (CF). C: Particle counts ranged from 50 million to 230 million/mL of cell-free urine (P = 0.224). D: Mean particle size range was 140 to 185 nmol/L (P = 0.071). E and F: In addition, urine EVs were collected from one donor during a period of 10 days to examine variability and storage stability for particle count (E) and particle sizing (F). Data are expressed as means ± SEM (C–F). n = 6 healthy controls; n = 5 patients with CF. Scale bar = 150 nm (A). Original magnification, ×5000 (B).
As a proof of principal assay, to test for broader applicability of the EV isolation procedure, urine EVs were isolated from patients with renal transplant and CKD (n = 10). The EV content of spot urine (<24 hours of origin) was examined from these individuals using NTA. Means ± SD EV particle count was 9.99 ± 4.45 × 10⁷/mL of cell-free urine, and means ± SD particle size was 172.23 ± 19.68 nm (Supplemental Figure S1, A and B). In addition, miRNA quantity from these samples was measured via the Bio-Analyzer. These data are presented as a small RNA gel image in Supplemental Figure S1C and electropherograms in Supplemental Figure S1D. Clinical status and other characteristics of individuals with renal transplant and CKD used in this pilot study are summarized in Supplemental Table S1.
miRNA Recovery
Both small RNA and miRNA recovery from whole urine EVs decreases over time at the temperatures examined. Small RNA, defined as all RNA of 150 nucleotide length or smaller, as well as miRNA were quantified with the Agilent Bio-Analyzer 2100 and the small RNA chip. The miRNA quantity recovered per individual varied greatly. Mean miRNA recovery from urine at 20°C was 79.01 total ng from 5 mL of cell-free urine (range, 17.4 to 258.11 ng). At 2°C, there was a notable decrease in miRNA recovery in as little as 4 hours (>55%) (Figure 2A), which then stabilized through the 24-hour period tested. At a storage temperature of 20°C, the loss of miRNA was not nearly as evident during a 24-hour period with an 18% decrease in small nucleic acid yield observed compared with a companion sample processed immediately on collection (Figure 2A). To confirm an apparent cold temperature–dependent loss of small RNA, whole urine samples were obtained from several healthy donors (n = 5), separated into duplicate aliquots, and allowed to equilibrate at 2°C or 20°C for 4 hours. Small RNA was isolated and quantitated (Figure 2B). A precipitate was typically noted in urine samples equilibrated at 2°C within 2 hours. Consequently, this precipitate was cleared by low speed centrifugation (1000 × g, 5 minutes) to allow maximum binding efficiency of EVs to the slurry reagent (manufacturer recommendation). TEM reveals that this precipitate contains thread-like structures (data not shown), similar to what others have claimed to be Tamm-Horsfall protein (THP) or uromodulin.18 Urine is rich in large amounts of a polymeric network formed by THP, which traps exosomes.19 The decrease in miRNA yield coincided with this precipitate formation, and EVs were seen associated with this thread-like structure by TEM. Therefore, we conclude—as a point of caution—that cold temperature storage of urine with sample precipitation may result in decreased EVs and miRNA for downstream analysis.
Figure 2.

Different pre-analytical handling conditions result in altered miRNA recovery from urine extracellular vesicles (EVs). Whole urine was equilibrated at 2°C (on ice) or 20°C for up to 24 hours. At the conclusion of each time point, two low-speed centrifugations (200 × g and 1000 × g; 10 minutes each) were performed to eliminate cells and cell debris. miRNA concentrations were measured via the Agilent 2100 Bio-Analyzer. A: Recovery of miRNAs from urine at 2°C was markedly decreased over time compared with immediate processing. B: Equilibration of urine at 20°C resulted in greater recovery of miRNA compared with a cold (2°C) pre-analytical handling condition. Each time point was run in triplicate from healthy donors. Because of the large volume of biofluid needed for the time course (TC) study, one healthy donor sample was used for 2the °C TC and another healthy donor was used for the 20°C TC. In addition, small RNA and miRNA recovery was measured from multiple donors after sample equilibration at 2°C or 20°C for 4 hours. C: Less small RNA and miRNA is recovered from all donors when samples were held at 2°C compared with 20°C. Each of the five donors is represented by a different color, with small RNA shown as a continuous line and miRNA represented by a dashed line. RNA quantity is plotted as log2 relative concentration because of the variability of RNA yield among donors. Each line is an individual sample. Graph represents directional change across the study population. NanoString nCounter miRNA assay reveals good correlation of miRNA read counts between fresh urine sample and total urine with a one-time freeze/thaw (TUFT) from the same donor (patient with cystic fibrosis) with a normalized input quantity. D: miRNA recovery is partially rescued when precipitate is solubilized at 37°C for 5 minutes from freeze/thaw samples. Each time point was run in triplicate from one healthy donor. Graph shown is representative of multiple experiments. Data are expressed as means ± SD (A and D). n = 5 donors (B). ∗∗∗∗P < 0.0001 (Tukey-Kramer honestly significant difference).
Furthermore, because freezing whole urine at −80°C is a common step in pre-analytical biobanking, the effect of freezing whole urine was examined on small RNA recovery. This in vitro sham sample condition is referred as total urine with a one-time freeze/thaw (TUFT). Small RNA was quantitated from parallel samples from the same individual either processed immediately or as TUFT, followed by two successive centrifugations to remove cells and cell debris and to generate a TUFT–cell-free urine sample. A one-time freeze/thaw consistently resulted in sample precipitate and reduced small RNA recovery. However, even though there is a reduced recovery of small RNA on sample freezing, miRNA profiling analysis comparing fresh urine to TUFT urine with a normalized input quantity demonstrated good correlation of measurable miRNAs from both sources (r = 0.99, P < 0.0001) (Figure 2C). Interestingly, related to urine samples that exhibit cold-induced precipitate, a simple reequilibration of the urine sample at 37°C for 5 minutes can result in a visible solubilization of the precipitate and increased EV and miRNA recovery (Figure 2D).
In addition, to further characterize the miRNA from urine EVs, quality was assessed by measuring miRNA abundance via real-time quantitative PCR. Four miRNA targets were selected for real-time quantitative PCR, based on pilot studies illustrating high read counts for these specific targets in NanoString microRNA assays, including miR-1285-5p, miR-451a, miR-4454, and miR-320e. Mean Ct values per target miRNA are shown in Supplemental Figure S2. miRNAs miR-1285-5p and miR-320e were readily detectable in all samples examined. miR-451a and miR-4454 were detectable in only a subset of the individuals.
Simulated Overnight Pad Collection of Urine
To mimic handling conditions of infant diaper pad overnight urine collection, whole urine was incubated at 37°C for up to 8 hours, followed by refrigeration at 4°C for 6 hours. This resembles conditions of a diaper pad next to an infant body overnight followed by transfer of the urine sample into a refrigerated cooler pack for transport to medical personnel for long-term storage at a biobank. Within as little as 4 hours, visible changes are notable in the small RNA banding patterns recognized on the Bio-Analyzer gel image (Figure 3A). In addition, miRNA concentrations decrease with time at 37°C as seen in the electropherograms (Figure 3B). Finally, the NanoString nCounter miRNA assay was performed on this set of samples to examine stability of specific miRNAs. A heatmap of the 65 most variable miRNA species (Figure 3C) shows distinct clustering of treatment groups associated with increased incubation times at 37°C.
Figure 3.

Small RNA and miRNA stability at 37°C. To simulate possible handling conditions of infant urine diaper pad collection overnight (temperature and time), whole urine was incubated at 37°C for up to 8 hours followed by 4°C for 6 hours. A: Bio-Analyzer gel image demonstrates clear alterations in small RNA density patterns with increasing time at 37°C. B: Electropherograms showing miRNA peak (approximately 20 to 25 nucleotides) and concentrations. C: Nanostring miRNA assay heat map of most variable miRNAs across incubation times. One sample from a donor with cystic fibrosis was used in this experiment; each condition was run in triplicate.
Discussion
The goal of this study was to analyze the recovery of small RNA from urine EVs for downstream miRNA profiling, specifically evaluating pre-analytical handling conditions that might be encountered with urine samples in clinical laboratory investigations or samples designated for biobanking. Urine biospecimens have gained attention recently because urine EVs have been touted as a potential rich source of biomarkers for multiple diseases, including lung20 and prostate cancer,21 brain diseases,9 and CKD22 among others. Multiple studies have addressed or reviewed improved methods for isolation of small RNA19, 23, 24, 25, 26; however, limited studies have examined the importance of pre-analytical urine handling conditions for downstream biomolecule analysis. Collins et al27 examined the stability of the urinary protein albumin under a variety of pre-analytical handling conditions related to renal failure and cardiovascular disease biomarker studies. Ribeiro28 investigated the influence of refrigeration on abnormal constituents and sediment urine analysis testing. However, to our knowledge, this study is the first that examines small RNA recovery related to pre-analytical sample handling conditions from urine EVs.
We report that some pre-analytical handling conditions are better for small RNA recovery and miRNA profiling than others. Specifically, for pre-analytical urine sample handling, it is recommended to spin out cells and debris and isolate miRNA from the cell-free biofluid immediately after collection. If this is not possible, the next best scenario would be to hold the sample at room temperature and process within 8 hours. Urine that is held at 2°C or frozen/thawed one time is viable for high-throughput miRNA profiling; however, as a point of caution, uromodulin/THP precipitation at ≤2°C, entrapping EVs, can significantly decrease miRNA yield from these samples. Short 5-minute 37°C equilibration of cold or freeze/thawed urine often resolubilizes this temperature-dependent precipitate, increasing yield of EVs and miRNA. Others have used chemical or physical means to deal with the uromodulin/THP precipitate18, 24, 25 and cautioned about potential decreased EV yield.19, 29 In our hands, such chemical additions or physical separations do not appear to be required for increased miRNA recovery. Finally, it is recommended not to use urine held at or near body temperature for several hours before storage for analysis in miRNA profiling studies.
This study has a number of strengths. An affinity slurry extraction method is a useful tool for the isolation of EVs and miRNA from urine. In addition, efficient pre-analytical handling conditions for urine samples have been established for downstream miRNA profiling and probably most importantly demonstrated that a short 5-minute 37°C equilibration of cold or thawed urine often resolubilizes the temperature-dependent precipitate, allowing efficient recovery of miRNA from urine EVs. Finally, a urine handling condition (37°C, ≥4 hours) of biobanked samples that should not be used for downstream small RNA analysis have been identified.
This work, however, also has a number of limitations. Alternate prehandling conditions for biobanked urine may exist that have not been anticipated here and as such their suitability may need to be addressed in future studies. Finally, only biospecimen samples of two disease types have been examined in this study. Other disease-state urine samples may or may not perform as the disease-associated samples here; however, it may be a worthwhile model for examining miRNA profiling in cancers, especially from genitourinary cancer cases.
In conclusion, urine EVs can be a viable source of miRNA for high-throughput miRNA profiling; however, pre-analytical sample handling conditions need to be carefully considered before any analysis. The optimal handling condition is sample storage at a room temperature of 20°C and processing as soon as possible after collection. However, this is often not practical. Alternately, urine held at 2°C to 4°C and processed within 24 hours, as well as one-time freeze-thaw samples, may be used for miRNA profiling; however, as a point of caution, a 5-minute 37°C sample equilibration to solubilize any precipitation for increased miRNA recovery is recommended. Urine samples held at 37°C for as little as 4 hours are significantly compromised and are not conducive to miRNA profiling.
Acknowledgments
We thank the members of the Department of Pulmonary and Critical Care Medicine at Dartmouth Hitchcock Medical Center in Lebanon and Manchester, NH, for coordination of collection and distribution of clinical samples used in this work. Clinical coordinators include Dana Dorman, Brian Aldrich, Molly Williams, Barbara Rogers, Nicola Felicitti, and Lynn Freeman.
D.A.A. is the guarantor of this work and, as such, had full access to all the data in the study and takes responsibility for the integrity of the data and the accuracy of the data analysis.
Footnotes
Supported by NIH grant R01HL122372 (A.A.).
Disclosures: None declared.
Supplemental material for this article can be found at https://doi.org/10.1016/j.jmoldx.2018.04.003.
Supplemental Data
Particle counting and sizing and miRNA quantitation of urine extracellular vesicles (EVs) of patients with chronic kidney disease (CKD). As a proof-of-principal assay, EVs were isolated from an alternate disease group: patients with CKD. Nanoparticle tracking analysis was used for particle counting and particle sizing. EVs were isolated from the urine (<24 hours of origin) of patients with CKD. A: Means ± SD particle count was 99.9 ± 4.45 × 10⁶/mL, with a range of 41 million to 191million/mL of cell-free urine. B: Means ± SD particle size was 172.23 ± 19.68 nm, with a range of 149 to 215 nm. C and D: In addition, miRNA quantity from these samples was measured via Bio-Analyzer. Small/miRNA gel image (C) and electropherograms with miRNA quantitation (D). Data are expressed as means ± SD (A and B). n = 10.
Supplemental Figure S2.
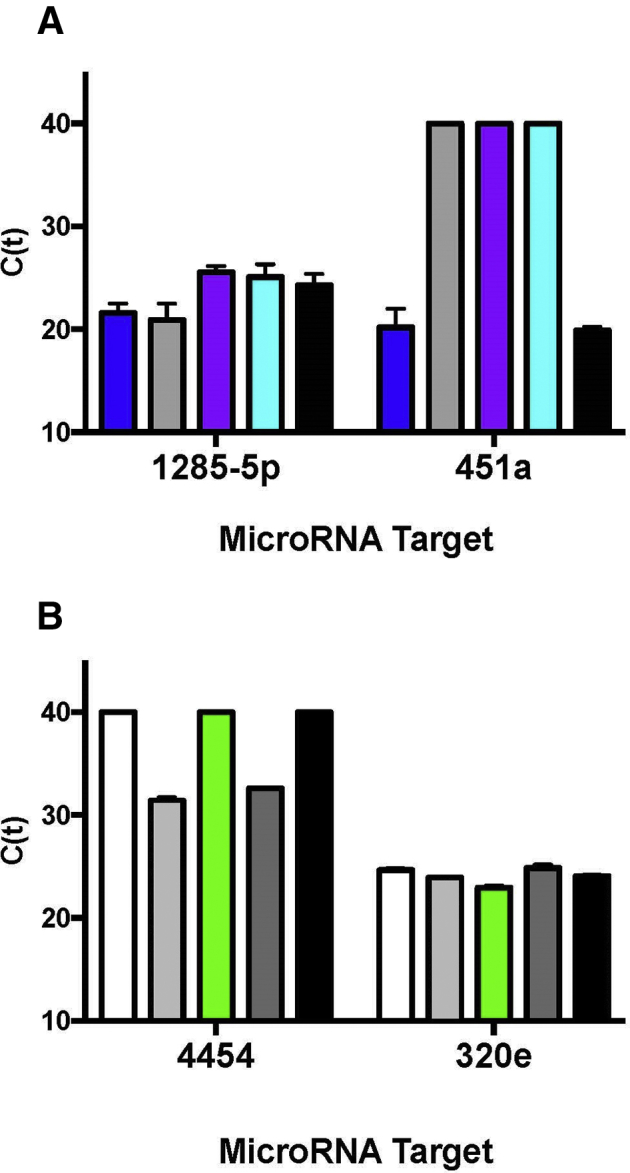
Analysis of urine extracellular vesicle (EV) miRNA by real-time quantitative PCR (qPCR). A: EVs and miRNA were isolated from two groups of individuals. miRNA was assayed by qPCR as a quality control measure of recovered RNA quality. miRNA targets hsa-miR-1285-5p and hsa-miR-451a were measured in one group of individuals. B: Each bar represents an individual. miRNA targets hsa-miR-4454 and hsa-miR-320e were assayed in another group of individuals. TaqMan advanced miRNA assays were used for qPCR. All samples were run in triplicate. Mean Ct values are shown for each participant. Data are expressed as means ± SD (A and B). n = 5 in each group.
Nanoparticle tracking analysis (NTA) of urine extracellular vesicles (EVs). Urine extracellular vesicles were measured by NTA. EVs were isolated via affinity resin, diluted in phosphate-buffered saline, and introduced into the NanoSight NS300 sample chamber via syringe pump. The following script was used for EV measurements: PRIME, DELAY 120, CAPTURE 30, REPEAT 3. Other acquisition settings included the following: camera level, 14; camera shutter speed, 13 milliseconds; camera gain, 360; and laser, blue 488. NTA postacquisition settings were optimized and kept constant among samples. Software used was NTA version 3.2 Dev. Build 3.2.16.
References
- 1.Properzi F., Logozzi M., Fais S. Exosomes: the future of biomarkers in medicine. Biomark Med. 2013;7:769–778. doi: 10.2217/bmm.13.63. [DOI] [PubMed] [Google Scholar]
- 2.Butz H., Nofech-Mozes R., Ding Q., Khella H.W.Z., Szabo P.M., Jewett M., Finelli A., Lee J., Ordon M., Stewart R., Krylov S., Yousef G.M. Exosomal microRNAs are diagnostic biomarkers and can mediate cell-cell communication in renal cell carcinoma. Eur Urol Focus. 2016;2:210–218. doi: 10.1016/j.euf.2015.11.006. [DOI] [PubMed] [Google Scholar]
- 3.He X., Jing Z., Cheng G. MicroRNAs: new regulators of Toll-like receptor signalling pathways. Biomed Res Int. 2014;2014:945169. doi: 10.1155/2014/945169. [DOI] [PMC free article] [PubMed] [Google Scholar]
- 4.Olivieri F., Rippo M.R., Prattichizzo F., Babini L., Graciotti L., Recchioni R., Procopio A.D. Toll like receptor signaling in “inflammaging”: microRNA as new players. Immun Ageing. 2013;10:11. doi: 10.1186/1742-4933-10-11. [DOI] [PMC free article] [PubMed] [Google Scholar]
- 5.Wu X.Q., Dai Y., Yang Y., Huang C., Meng X.M., Wu B.M., Li J. Emerging role of microRNAs in regulating macrophage activation and polarization in immune response and inflammation. Immunology. 2016;148:237–248. doi: 10.1111/imm.12608. [DOI] [PMC free article] [PubMed] [Google Scholar]
- 6.Jiang X.C., Gao J.Q. Exosomes as novel bio-carriers for gene and drug delivery. Int J Pharm. 2017;521:167–175. doi: 10.1016/j.ijpharm.2017.02.038. [DOI] [PubMed] [Google Scholar]
- 7.Khurana R., Ranches G., Schafferer S., Lukasser M., Rudnicki M., Mayer G., Huttenhofer A. Identification of urinary exosomal noncoding RNAs as novel biomarkers in chronic kidney disease. RNA. 2017;23:142–152. doi: 10.1261/rna.058834.116. [DOI] [PMC free article] [PubMed] [Google Scholar]
- 8.Street J.M., Koritzinsky E.H., Glispie D.M., Star R.A., Yuen P.S. Urine exosomes: an emerging trove of biomarkers. Adv Clin Chem. 2017;78:103–122. doi: 10.1016/bs.acc.2016.07.003. [DOI] [PubMed] [Google Scholar]
- 9.An M., Gao Y. Urinary biomarkers of brain diseases. Genomics Proteomics Bioinformatics. 2015;13:345–354. doi: 10.1016/j.gpb.2015.08.005. [DOI] [PMC free article] [PubMed] [Google Scholar]
- 10.Argyropoulos C., Wang K., Bernardo J., Ellis D., Orchard T., Galas D., Johnson J.P. Urinary microRNA profiling predicts the development of microalbuminuria in patients with type 1 diabetes. J Clin Med. 2015;4:1498–1517. doi: 10.3390/jcm4071498. [DOI] [PMC free article] [PubMed] [Google Scholar]
- 11.Catalanotto C., Cogoni C., Zardo G. MicroRNA in control of gene expression: an overview of nuclear functions. Int J Mol Sci. 2016;17 doi: 10.3390/ijms17101712. pii:E1712. [DOI] [PMC free article] [PubMed] [Google Scholar]
- 12.Mestdagh P., Hartmann N., Baeriswyl L., Andreasen D., Bernard N., Chen C. Evaluation of quantitative miRNA expression platforms in the microRNA quality control (miRQC) study. Nat Methods. 2014;11:809–815. doi: 10.1038/nmeth.3014. [DOI] [PubMed] [Google Scholar]
- 13.Debernardi S., Massat N.J., Radon T.P., Sangaralingam A., Banissi A., Ennis D.P., Dowe T., Chelala C., Pereira S.P., Kocher H.M., Young B.D., Bond-Smith G., Hutchins R., Crnogorac-Jurcevic T. Noninvasive urinary miRNA biomarkers for early detection of pancreatic adenocarcinoma. Am J Cancer Res. 2015;5:3455–3466. [PMC free article] [PubMed] [Google Scholar]
- 14.Hur K., Toiyama Y., Schetter A.J., Okugawa Y., Harris C.C., Boland C.R., Goel A. Identification of a metastasis-specific MicroRNA signature in human colorectal cancer. J Natl Cancer Inst. 2015;107 doi: 10.1093/jnci/dju492. pii:dju492. [DOI] [PMC free article] [PubMed] [Google Scholar]
- 15.Armstrong D.A., Nymon A.B., Ringelberg C.S., Lesseur C., Hazlett H.F., Howard L., Marsit C.J., Ashare A. Pulmonary microRNA profiling: implications in upper lobe predominant lung disease. Clin Epigenetics. 2017;9:56. doi: 10.1186/s13148-017-0355-1. [DOI] [PMC free article] [PubMed] [Google Scholar]
- 16.Rames M., Yu Y., Ren G. Optimized negative staining: a high-throughput protocol for examining small and asymmetric protein structure by electron microscopy. J Vis Exp. 2014:e51087. doi: 10.3791/51087. [DOI] [PMC free article] [PubMed] [Google Scholar]
- 17.Oosthuyzen W., Sime N.E., Ivy J.R., Turtle E.J., Street J.M., Pound J., Bath L.E., Webb D.J., Gregory C.D., Bailey M.A., Dear J.W. Quantification of human urinary exosomes by nanoparticle tracking analysis. J Physiol. 2013;591:5833–5842. doi: 10.1113/jphysiol.2013.264069. [DOI] [PMC free article] [PubMed] [Google Scholar]
- 18.Fernandez-Llama P., Khositseth S., Gonzales P.A., Star R.A., Pisitkun T., Knepper M.A. Tamm-Horsfall protein and urinary exosome isolation. Kidney Int. 2010;77:736–742. doi: 10.1038/ki.2009.550. [DOI] [PMC free article] [PubMed] [Google Scholar]
- 19.Alvarez M.L., Khosroheidari M., Kanchi Ravi R., DiStefano J.K. Comparison of protein, microRNA, and mRNA yields using different methods of urinary exosome isolation for the discovery of kidney disease biomarkers. Kidney Int. 2012;82:1024–1032. doi: 10.1038/ki.2012.256. [DOI] [PubMed] [Google Scholar]
- 20.Zhang H., Cao J., Li L., Liu Y., Zhao H., Li N., Li B., Zhang A., Huang H., Chen S., Dong M., Yu L., Zhang J., Chen L. Identification of urine protein biomarkers with the potential for early detection of lung cancer. Sci Rep. 2015;5:11805. doi: 10.1038/srep11805. [DOI] [PMC free article] [PubMed] [Google Scholar]
- 21.Wei J.T. Urinary biomarkers for prostate cancer. Curr Opin Urol. 2015;25:77–82. doi: 10.1097/MOU.0000000000000133. [DOI] [PMC free article] [PubMed] [Google Scholar]
- 22.Hsu C.Y., Xie D., Waikar S.S., Bonventre J.V., Zhang X., Sabbisetti V., Mifflin T.E., Coresh J., Diamantidis C.J., He J., Lora C.M., Miller E.R., Nelson R.G., Ojo A.O., Rahman M., Schelling J.R., Wilson F.P., Kimmel P.L., Feldman H.I., Vasan R.S., Liu K.D., CRIC Study Investigators. CKD Biomarkers Consortium Urine biomarkers of tubular injury do not improve on the clinical model predicting chronic kidney disease progression. Kidney Int. 2017;91:196–203. doi: 10.1016/j.kint.2016.09.003. [DOI] [PMC free article] [PubMed] [Google Scholar]
- 23.Alvarez M.L. Isolation of urinary exosomes for RNA biomarker discovery using a simple, fast, and highly scalable method. Methods Mol Biol. 2014;1182:145–170. doi: 10.1007/978-1-4939-1062-5_13. [DOI] [PubMed] [Google Scholar]
- 24.Musante L., Tataruch D., Gu D., Benito-Martin A., Calzaferri G., Aherne S., Holthofer H. A simplified method to recover urinary vesicles for clinical applications, and sample banking. Sci Rep. 2014;4:7532. doi: 10.1038/srep07532. [DOI] [PMC free article] [PubMed] [Google Scholar]
- 25.Musante L., Tataruch-Weinert D., Kerjaschki D., Henry M., Meleady P., Holthofer H. Residual urinary extracellular vesicles in ultracentrifugation supernatants after hydrostatic filtration dialysis enrichment. J Extracell Vesicles. 2017;6:1267896. doi: 10.1080/20013078.2016.1267896. [DOI] [PMC free article] [PubMed] [Google Scholar]
- 26.Barreiro K., Holthofer H. Urinary extracellular vesicles: a promising shortcut to novel biomarker discoveries. Cell Tissue Res. 2017;369:217–227. doi: 10.1007/s00441-017-2621-0. [DOI] [PMC free article] [PubMed] [Google Scholar]
- 27.Collins A.C., Sethi M., MacDonald F.A., Brown D., Viberti G.C. Storage temperature and differing methods of sample preparation in the measurement of urinary albumin. Diabetologia. 1993;36:993–997. doi: 10.1007/BF02374489. [DOI] [PubMed] [Google Scholar]
- 28.Ribeiro K.C.B. Urine storage under refrigeration preserves the sample in chemical, cellularity and bacteriuria analysis of ACS. J Bras Patol Med Lab. 2013;49 [Google Scholar]
- 29.Wachalska M., Koppers-Lalic D., van Eijndhoven M., Pegtel M., Geldof A.A., Lipinska A.D., van Moorselaar R.J., Bijnsdorp I.V. Protein complexes in urine interfere with extracellular vesicle biomarker studies. J Circ Biomark. 2016;5:4. doi: 10.5772/62579. [DOI] [PMC free article] [PubMed] [Google Scholar]
Associated Data
This section collects any data citations, data availability statements, or supplementary materials included in this article.
Supplementary Materials
Particle counting and sizing and miRNA quantitation of urine extracellular vesicles (EVs) of patients with chronic kidney disease (CKD). As a proof-of-principal assay, EVs were isolated from an alternate disease group: patients with CKD. Nanoparticle tracking analysis was used for particle counting and particle sizing. EVs were isolated from the urine (<24 hours of origin) of patients with CKD. A: Means ± SD particle count was 99.9 ± 4.45 × 10⁶/mL, with a range of 41 million to 191million/mL of cell-free urine. B: Means ± SD particle size was 172.23 ± 19.68 nm, with a range of 149 to 215 nm. C and D: In addition, miRNA quantity from these samples was measured via Bio-Analyzer. Small/miRNA gel image (C) and electropherograms with miRNA quantitation (D). Data are expressed as means ± SD (A and B). n = 10.
Nanoparticle tracking analysis (NTA) of urine extracellular vesicles (EVs). Urine extracellular vesicles were measured by NTA. EVs were isolated via affinity resin, diluted in phosphate-buffered saline, and introduced into the NanoSight NS300 sample chamber via syringe pump. The following script was used for EV measurements: PRIME, DELAY 120, CAPTURE 30, REPEAT 3. Other acquisition settings included the following: camera level, 14; camera shutter speed, 13 milliseconds; camera gain, 360; and laser, blue 488. NTA postacquisition settings were optimized and kept constant among samples. Software used was NTA version 3.2 Dev. Build 3.2.16.