

Abstract
Background
Abuse of prescription opioids [opioid use disorder (OUD), poisoning, and fatal and non-fatal overdose] is a public health and economic challenge that is associated with considerable morbidity and mortality in the USA and globally.
Objective
To systematically review and summarize the health economics literature published over the last 5 years that describes the economic burden of abuse of prescription opioids.
Methods
Findings from searches of databases including MEDLINE, Embase, and Cochrane CENTRAL as well as hand searches of multiple conference abstracts were screened against predefined inclusion criteria to identify studies reporting cost and healthcare resource utilization (HRU) data associated with abuse of prescription opioids.
Results
A total of 49 unique studies were identified. Most of the studies examined direct costs and HRU, which were substantially higher for abusers of prescription opioids than non-abuser controls in several matched cohort analyses (US$20,343–US$28,718 vs US$9716–US$14,079 for mean direct combined annual healthcare costs reported in 6 studies). Although only a small number of studies reported indirect costs, these findings suggest a high societal burden related to productivity losses, absenteeism, morbidity, and mortality among those who abuse opioids. Studies of medication-assisted treatment demonstrated that factors such as adherence, dose, formulation (film or tablet), and relapse during treatment, were associated with direct costs and HRU among treated patients.
Conclusions
This systematic literature review shows that abuse of prescription opioids is characterized by substantial direct healthcare costs, medical utilization, and related societal costs. Future research should further investigate the indirect costs of opioid abuse.
Electronic supplementary material
The online version of this article (10.1007/s40258-018-0402-x) contains supplementary material, which is available to authorized users.
Key Points for Decision Makers
| Abuse of prescription opioids imposes a substantial economic burden on society. |
| While the direct healthcare costs of opioid abuse have been well documented, considerably less research has focused on the indirect costs of abuse, which appear to be substantial. Further research to better quantify the burden of indirect costs of opioid abuse is warranted. |
Introduction
Abuse of prescription opioids [often referred to as opioid use disorder (OUD), poisoning, or fatal and non-fatal overdose, collectively] presents a growing public health and economic challenge. According to the National Survey on Drug Use and Health (NSDUH), in 2016 approximately 12 million people aged 12 years and older in the USA (just over 4% of the population) misused prescription pain relievers [1]. In addition, around 2 million people in the USA and approximately 16 million people worldwide have been reported as having an OUD, which is defined by the American Psychiatric Association as a problematic pattern of opioid use leading to clinically significant impairment or distress [1–3].
Between 1999 and 2016, the rate of age-adjusted drug overdose deaths attributable to natural and semisynthetic opioids has increased from 1.0 to 4.4 per 100,000 [4]. The clinical burden of abuse of prescription opioids is similarly considerable; in 2015 approximately 822,000 people in the USA received treatment for pain-reliever misuse as part of their most recent substance use treatment [5]. A number of US public health initiatives have been implemented to curb opioid abuse and provide treatment for those affected [6, 7]. Beyond the USA, OUDs are also a growing concern; for example, opioid dependence accounted for 0.4% of total Global Burden of Disease disability-adjusted life-years in 2010, a 73% relative increase from the estimated proportion in 1990 [2]. Countries with similar demography and economic status to the USA, such as the United Kingdom and Australia, report comparable rates of opioid dependence. Furthermore, similar rates of opioid dependence have also been observed in Western Europe, North Africa, and the Middle East [2].
The economic burden of abuse of prescription opioids is often demonstrated by highlighting the excess medical and drug expenses incurred by abusers compared with those among patients in the general insured population. For example, a 2009 analysis estimated that US$23.7 billion in excess medical care expenses were incurred because of opioid abuse in the USA [8]. Three prior systematic literature reviews summarized this economic burden from the mid-1990s to 2014 and their conclusions reflect the expanding impact of opioid abuse on patients, health systems, and payers [9–11]. These reviews have concluded that opioid abuse is characterized by high societal costs (over US$50 billion in the USA), and is associated with higher medical utilization and direct healthcare costs compared with the general insured population [9, 11].
The present study aimed to update the prior systematic literature reviews with the most recent evidence characterizing the global economic burden associated with abuse of prescription opioids. The review examined the health economics literature from 2012 to 2017, including studies that reported economic outcomes related to abuse of opioids, regardless of geographic location.
Methods
Literature Search and Screen
A systematic literature search for recently published or released health economic data on abuse of prescription opioids was conducted with methods consistent with the Preferred Reporting Items for Systematic Reviews and Meta-Analyses (PRISMA) reporting guidelines [12, 13].
Databases searched included Embase, MEDLINE (including MEDLINE In-Process), Cochrane Database of Systematic Reviews, Evidence-Based Medicine (EBM) Reviews (including the Center for Research and Dissemination Database of Health Technology Assessments, National Health Service Economic Evaluation Database), Cumulative Index to Nursing and Allied Health Literature (CINAHL), PsycINFO, and EconLit. Search terms for opioid misuse and abuse, resource use, costs, and economic outcomes were applied (the full search strategy has been provided in Online Appendix A). Electronic reviews of abstracts from several relevant congresses and hand searches of referenced publications were also undertaken. Searches were conducted in October 2017 and were restricted to the prior 5 years for database searches and the prior 2 years for conference proceedings.
Included studies assessed abuse of prescription opioids, including OUD, poisoning, and fatal and non-fatal overdose. Studies were required to report economic outcomes, such as healthcare resource utilization (HRU), direct healthcare costs, or indirect costs (e.g. work loss, disability, or family burden). Economic models could be included if they assessed budget impact and provided sufficient input cost details. Studies that did not provide specific data for the prescription opioid abusing subgroup of a broader population of licit and illicit substance users were excluded. Studies that reported economic outcomes that were specific to neonatal abstinence syndrome (NAS) were excluded as it could not be established that NAS was tied to prescription opioid abuse and not the abuse of other substances. Only English-language records were included; a complete list of criteria is provided in Online Appendix B.
Titles and abstracts of search results were screened by two independent reviewers (CP, NS). Studies meeting the criteria were assessed for inclusion based on full-text review, and any disputes were resolved through discussion between reviewers or consultation with a third reviewer (LS). For the two rounds of screening, the two independent reviewers (CP, NS) were required to agree on the reason for exclusion, with these disputes also resolved through discussion between reviewers (CP, NS) or consultation with a third reviewer (LS).
Data Extraction/Summary and Quality Assessment
Data from all selected articles were extracted by two independent reviewers (CP, NS); any discrepancies between extractions were verified for accuracy by an independent third reviewer (LS). The data extracted included study methodology; patient demographic and clinical characteristics; direct, indirect, and total costs; and resource utilization [total healthcare, inpatient, outpatient, emergency department (ED), rehabilitation facilities, and pharmacy].
Published checklists were used to assess the relevance and credibility of observational studies [14], retrospective database analyses [15], and economic model studies [16]. The full quality assessment checklists are provided in Online Appendix C.
Results
The search identified 937 records for screening. Of these, 49 references from 49 unique studies were identified that met the eligibility criteria (Fig. 1; eligibility criteria can be found in Online Appendix B). Of the included studies, 39 reported direct cost data (12 using a matched cohort design), 5 reported indirect cost data, and 34 reported HRU findings (5 using a matched cohort design). In addition, 5 included studies were economic models, 2 were government reports, and 9 reported data on economic outcomes for patients who were treated with medication-assisted treatment (MAT; e.g. methadone, naltrexone, buprenorphine). Nearly all included studies (47) were from the USA; in addition, 1 study each from Australia and Greece was included. Characteristics of all included studies are reported in Online Appendix D. Of the 49 unique studies, 12 included estimates from a public-payer perspective, 27 from a private-payer perspective, and 3 from a societal perspective. Furthermore, 44 studies assessed outcomes among patients with prescription opioid abuse, dependence, and/or overdose/poisoning, 2 among patients with “non-medical use of opioids”, and 3 among patients with “opioid use disorder”.
Fig. 1.
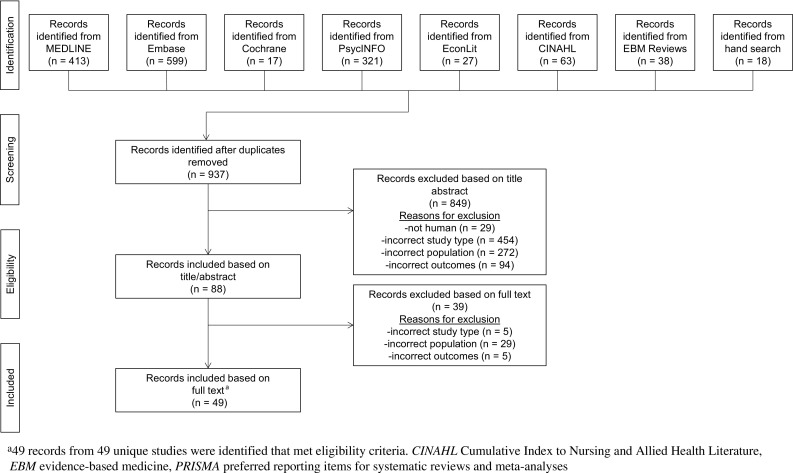
PRISMA flow diagram
Direct Healthcare Costs
Across all studies that used a matched cohort design, direct healthcare costs were substantially higher for prescription opioid abusers compared with matched controls (Table 1); this included individual components of direct costs (e.g. inpatient, outpatient, ED) as well as costs across all places of service. For example, among 6 matched cohort studies, mean direct combined annual healthcare costs ranged from US$20,343 to US$28,718 for opioid abusers compared with US$9716 to US$14,079 for non-abusers [17–22]. One study evaluated the costs of opioid abuse by diagnosis and found that total annual healthcare costs were substantially higher for patients diagnosed with opioid overdose/poisoning (US$47,591) compared with abuse (US$24,314) and dependence (US$27,194) [23]. Another study evaluated costs of opioid abuse over a 365-day post-diagnosis period and reported that total healthcare costs are highest for abusers in the privately insured US population (US$25,469), compared with abusers who are Medicare members aged ≥ 65 years (US$11,438) and abusers who are Medicare members aged < 65 years (US$18,438) [24].
Table 1.
Summary of direct healthcare costs associated with opioid abuse
| Author, country | Currency (adjusted year) | Direct costs, abusers vs non-abusers | ||||||
|---|---|---|---|---|---|---|---|---|
| Inpatient | Outpatient | ED | Rehabilitation facility | Pharmacy | Medical | Total | ||
| Baser et al. [38], USA | USD (2010) |
Patients prescribed an opioid
US$12,837 vs US$3436; p < 0.0001 Patients without an opioid prescription US$13,423 vs US$1680; p < 0.0001 Opioid-abuse related Patients prescribed an opioid US$9603 vs US$5; p < 0.0001 Patients without an opioid prescription US$7089 vs US$5; p < 0.0001 |
Patients prescribed an opioid
US$13,062 vs US$7801; p < 0.0001 Patients without an opioid prescription US$10,723 vs US$3864; p < 0.0001 Opioid-abuse related Patients prescribed an opioid US$2272 vs US$2; p < 0.0001 Patients without an opioid prescription US$2851 vs US$2; p < 0.0001 |
NR | NR |
Patients prescribed an opioid
US$2209 vs US$1741; p < 0.0001 Patients without an opioid prescription US$1229 vs US$593; p < 0.0001 Opioid-abuse related Patients prescribed an opioid US$368 vs US$171; p < 0.0001 Patients without an opioid prescription US$127 vs US$10; p < 0.0001 |
NR |
Patients prescribed an opioid
US$28,882 vs US$13,605; p < 0.0001 Patients without an opioid prescription US$25,197 vs US$6350; p < 0.0001 Opioid-abuse related Patients prescribed an opioid US$8956 vs US$218; p < 0.0001 Patients without an opioid prescription US$8733 vs US$20; p < 0.0001 |
| Cochran et al. [35], USA | USD (NR) | NR | NR | NR | NR |
Prescription drug copayment
OUD: US$8.69 (9.70); p < 0.0001 Non-OUD: US$5.84 (5.13) |
NR | NR |
| Electricwala et al. [60], USA | USD (NR) | NR | NR | NR | NR | NR |
Incremental direct medical costs associated with opioid overdose, PPPY
Prescription opioid users vs non-medical users: US$65,277 vs US$41,102; p < 0.05 Overdose-specific costs, PPPY Prescription opioid users vs non-medical users: US$12,111 vs US$11,070a |
NR |
| Howard et al. [17], USA | USD (2015) | NR | NR | NR | NR | NR | NR |
1-year healthcare costs
Opioid abusers: US$28,717 Matched controls: US$13,907 Difference: US$14,810 |
| Howard et al. [23], USA | USD (2015) |
Proportion of excess healthcare cost of abuse per patient, %
b
Dependence: 21.0 Abuse: 35.1 Overdose/poisoning: 31.3 |
Proportion of excess healthcare cost of abuse per patient, %
b
Dependence: 34.0 Abuse: 22.6 Overdose/poisoning: 20.7 |
Proportion of excess healthcare cost of abuse per patient, %
b
Dependence: 20.2 Abuse: 35.6 Overdose/poisoning: 38.2 |
Proportion of excess healthcare cost of abuse per patient, %
b
Dependence: 22.4 Abuse: 13.0 Overdose/poisoning: 2.1 |
NR | NR |
Annual healthcare costs, dependence
b
US$27,194 vs US$13,922 Difference: US$13,271a Annual healthcare costs, abuse b US$24,314 vs US$12,629 Difference: US$11,686a Annual healthcare costs, overdose/poisoningb US$47,591 vs US$15,425 Difference: US$32,166a |
| Howard et al. [22], USA | USD (2015) | Proportion of excess cost of abuse per patient, %; 36 | Proportion of excess cost of abuse per patient, %; 7 | Proportion of excess cost of abuse per patient, %; 10 | Proportion of excess cost of abuse per patient, %; 41 | Proportion of excess cost of abuse per patient, %; 5 | NR |
Annual healthcare costs
US$25,223 vs US$13,753 Difference: US$11,470a |
| Johnston et al. [34], USA | USD (2014) |
WC group
c
US$9824 (20,747) vs US$2327 (13,165); p < 0.001 STD group c US$14,540 (34,986) vs US$5614 (24,022); p < 0.001 |
Outpatient services healthcare costs
c
WC group c US$5236 (6879) vs US$2800 (6964); p < 0.001 STD group c US$8720 (10,886) vs US$6256 (9598); p < 0.001 Outpatient physician office visit costs c WC group US$1192 (996) vs US$590 (664); p < 0.001 STD group US$1480 (1310) vs US$739 (720); p < 0.001 |
WC group
c
US$830 (1780) vs US$217 (673); p < 0.001 STD group c US$1238 (3726) vs US$297 (921); p < 0.001 |
NR |
WC group
c
US$5302 (6887) vs US$1925 (3893); p < 0.001 STD group c US$4871 (6221) vs US$1804 (4116); p < 0.001 |
WC group
c
US$17,082 (23,813) vs US$5933 (16,582); p < 0.001 STD group c US$25,978 (40,788) vs US$12,907 (27,709); p < 0.001 |
WC group
c
US$22,384 (25,934) vs US$7859 (17,639); p < 0.001 STD group c US$30,849 (42,009) vs US$14,711 (28,541); p < 0.001 Median total all-cause healthcare costs c WC group US$14,038 vs US$3150a STD group US$18,185 vs US$7077a |
| Kirson et al. [18], USA | USD (2015) |
Pre-index
d
US$2647 (18,339) vs US$1918 (17,375) Difference: US$729a |
Pre-index
d
US$3728 (10,267) vs US$3144 (10,393) Difference: US$584a |
Pre-index
d
US$2401 (12,895) vs US$969 (6085) Difference: US$1431a |
Pre-index
d
US$345 (3380) vs US$71 (1350) Difference: US$274a |
Pre-index
d
US$1511 (6234) vs US$1445 (4934) Difference: US$66a |
NR |
Pre-index
d
US$10,632 (30,743) vs US$7548 (25,798) Difference: US$3084a |
|
Post-index
e
US$4235 (18,278) vs US$1355 (12,439) Difference: US$2880a |
Post-index
e
US$6692 (15,261) vs US$2786 (11,512) Difference: US$3906a |
Post-index
e
US$3141 (12,962) vs US$835 (5610) Difference: US$2306a |
Post-index
e
US$2369 (9871) vs US$45 (966) Difference: US$2324a |
Post-index
e
US$1649 (5510) vs US$1339 (4820) Difference: US$310a |
Post-index
e
US$18,086 (34,131) vs US$6359 (21,848) Difference: US$11,726a |
|||
| Scarpati et al. [21], USA | USD (2015) |
Pre-index
d
US$3491 (22,083) vs US$2020 (17,115) Difference: US$1471; p < 0.01 |
Pre-index
d
US$3271 (10,503) vs US$2900 (10,577) Difference: US$371; p < 0.01 |
Pre-index
d
US$1007 (5822) vs US$477 (3098) Difference: US$531; p < 0.01 |
Pre-index
d
US$579 (5132) vs US$77 (1799) Difference: US$503; p < 0.01 |
Pre-index
d
US$1554 (5996) vs US$1412 (5280) Difference: US$143; p < 0.01 |
Pre-index
d
US$8349 (28,173) vs US$5474 (22,584) Difference: US$2875; p < 0.01 |
Pre-index
d
US$9903 (29,390) vs US$6885 (23,972) Difference: US$3018; p < 0.01 |
|
Post-index
e
US$4877 (29,216) vs US$2448 (21,069) Difference: US$2429; p < 0.01 |
Post-index
e
US$3180 (9637) vs US$2895 (9768) Difference: US$284; p < 0.01 |
Post-index
e
US$1149 (4048) vs US$539 (2657) Difference: US$610; p < 0.01 |
Post-index
e
US$4281 (14,808) vs US$66 (1566) Difference: US$4215; p < 0.01 |
Post-index
e
US$1679 (5269) vs US$1247 (4518) Difference: US$432; p < 0.01 |
Post-index
e
US$13,486 (35,909) vs US$5947 (25,241) Difference: US$7539; p < 0.01 |
Post-index
e
US$15,165 (36,658) vs US$7194 (26,171) Difference: US$7971; p < 0.01 |
||
| Scarpati et al. [25], USA | USD (2015) |
Proportion of excess costs, %
6 months pre-index: 28 6 months post-index: “remained relatively stable” 6–12 months post-index: 16 12–18 months post-index: 20 |
Proportion of excess costs, %
6 months pre-index: 20 6 months post-index: 33 6–12 months post-index: 41 12–18 months post-index: 42 |
Proportion of excess costs, %
6 months pre-index: 40 6 months post-index: 19 6–12 months post-index: 21 12–18 months post-index: 16 |
Proportion of excess costs, %
6 months pre-index: 7 6 months post-index: 19 6–12 months post-index: 14 12–18 months post-index: 13 |
Proportion of excess costs, %
6 months pre-index: 6 6 months post-index: “remained relatively stable” 6–12 months post-index: 9 12–18 months post-index: 8 |
Total excess medical costs
− 6 to 0 months: US$3329 (26,214) 0 to 6 months: US$11,771 (26,904) 6 to 12 months: US$3985 (24,367) 12 to 18 months: US$2719 (16,953) All p < 0.001 |
Incremental cost of opioid abuse
− 6 to 6 months: US$15,764 6–18 months: US$7346 |
| Pasquale et al. [24], USA | USD (2010) | NRf | NRf | NRf | NRf | NRf | NRf |
Post-index period
g
Commercial US$25,469 vs US$5536 Difference: US$19,333; p < 0.0001 Medicare < 65 US$18,438 vs US$12,294 Difference: US$6145; p < 0.0001 Medicare ≥ 65 US$11,438 vs US$9613 Difference: US$1825 p < 0.0001 Abuse-related, post-index period g Commercial: US$2099 Medicare < 65: US$539 Medicare ≥ 65: US$170 |
| Rice et al. [19], USA | USD (2012) | US$5843 (25,952) vs US$2345 (18,932) Difference: US$3498 Ratio: 2.5; p < 0.001 |
US$5465 (10,532) vs US$3997 (11,483) Difference: US$1467 Ratio: 1.4; p < 0.001 |
US$3163 (9880) vs US$871 (5232) Difference: US$2291 Ratio: 3.6; p < 0.001 |
US$1821 (5904) vs US$49 (825) Difference: US$1772 Ratio: 36.9; p < 0.001 |
US$2826 (5169) vs US$2045 (4287) Difference: US$781 Ratio: 1.4; p < 0.001 |
US$17,518 (35,488) vs US$7671 (25,639) Difference: US$9847 Ratio: 2.3; p < 0.001 |
US$20,343 (36,498) vs US$9716 (26,676) Difference: US$10,627 Ratio: 2.1; p < 0.001 |
| Rice et al. [20], USA | USD (2012) | US$10,011 (41,249) vs US$3212 (23,465) Difference: US$6798; p < 0.001 |
US$7386 (14,882) vs US$4603 (12,582) Difference: US$2784; p < 0.001 |
US$1885 (5047) vs US$616 (2444) Difference: US$1269; p < 0.001 |
NR | US$3019 (5762) vs US$2494 (6123) Difference: US$525; p < 0.001 |
US$19,282 (47,886) vs US$8431 (29,880) Difference: US$10,851; p < 0.001 |
US$22,301 (48,876) vs US$10,925 (31,363) Difference: US$11,376; p < 0.001 |
| Howard et al. [26], USA | USD (2012) | Proportion of excess cost of abuse per patient, %h; 36 | Proportion of excess cost of abuse per patient, %h; 41 | Proportion of excess cost of abuse per patient, %h; 23 | NR | NR |
Total medical costs
US$17,518 vs US$7671 Difference: US$9847a |
NR |
| Roland et al. [37], USA | USD (NAi) | Pre-index periodd,j US$712 (3552.7) vs US$85 (1007.6); p < 0.0001 Post-index periodj,k US$881 (3831.0) vs US$101 (1090.6); p < 0.0001 DID: 152; p < 0.0001 Abuse-related Pre-index periodd,j Abusers: US$89 (1027.7) Post-index periodj,k Abusers: US$301 (955.4) DID: 212; p < 0.0001 |
Pre-index periodd,j US$777 (1548.9) vs US$205 (715.4); p < 0.0001 Post-index periodj,k US$860 (1447.2) vs US$221 (663.6); p < 0.0001 DID: 67; p < 0.0001 Abuse-related Pre-index periodd,j Abusers: US$26 (180.5) Post-index periodj,k Abusers: US$116 (262.7) DID: 90; p < 0.0001 |
Pre-index periodd,j US$126 (416.3) vs US$13 (98.3); p < 0.0001 Post-index periodj,k US$129 (396.3) vs US$15 (84.1); p < 0.0001 DID: 2; p < 0.0001 |
NR |
Costs for all prescriptions filled (all non-opioid and opioid)
Pre-index periodd,j US$367 (764.9) vs US$82 (289.6); p < 0.0001 Post-index periodj,k US$398 (736.5) vs US$87 (263.0); p < 0.0001 DID: 26; p < 0.0001 Costs for opioid prescriptions filled l Pre-index periodd,j US$146 (613.0) vs US$3 (57.8); p < 0.0001 Post-index periodj,k US$161 (570.3) vs US$3 (40.5); p < 0.0001 DID: 16; p < 0.001 |
NR | Pre-index periodd,j US$1856 (4446.1) vs US$372 (1406.3); p < 0.0001 Difference: US$1484 Post-index periodj,k US$2138 (4577.3) vs US$408 (1556.8); p < 0.0001 Difference: US$1730 DID: 245; p < 0.0001 |
| Rossiter et al. [61], USA | USD (2011) | NR | NR | NR | NR |
Commercially insured patients
US$11,230 (13,784) vs US$11,529 (14,155) Difference: − US$299; 95% CI − 1060 to 461; p = 0.440 Medicare-eligible patients US$10,649 (9387) vs US$12,152 (19,769) Difference: − US$1504; 95% CI − 4113 to 1106; p = 0.258 Medicaid patients US$12,851 (24,320) vs US$12,165 (11,994) Difference: US$686; 95% CI − 1580 to 2953; p = 0.552 |
Commercially insured patients
US$37,846 (53,282) vs US$28,390 (50,575) Difference: US$9456; 95% CI 6648–12,264; p < 0.001 Medicare-eligible patients US$34,965 (44,885) vs US$24,920 (44,423) Difference: US$10,046; 95% CI 2565–17,527; p = 0.009 Medicaid patients US$34,607 (44,852) vs US$23,106 (39,096) Difference: US$11,501; 95% CI 6632–16,369; p < 0.001 Annual medical cost savings associated with ERO with abuse-deterrent technology (per patient; total) Diagnosed abusers Commercially insured: US$9456; US$34,730,641 Medicare-eligible: US$10,046; US$0 Medicaid: US$11,501; US$15,769,878 Uninsured: US$11,501; US$35,408,151 Sub-total for diagnosed abusers: US$85,908,669 Undiagnosed abusers Commercially insured: US$7565; US$138,922,564 Medicare-eligible: US$8036; US$0 Medicaid: US$9200; US$63,079,510 Uninsured: US$9200; US$141,632,603 Sub-total for diagnosed abusers: US$343,634,677 Total annual cost savings: US$429,543,346 |
NR |
| Holly et al. [50], USA | USD (2011) | Proportion of excess cost of abuse per patient, %h; 76 | Proportion of excess cost of abuse per patient, %h; 10 | Proportion of excess cost of abuse per patient, %h; 14 | NR | NR | US$39,753 vs US$31,178 Difference: US$8575a |
NR |
Data are presented as mean (SD) per patient for matched cohorts during follow-up period, unless otherwise specified
DID difference in difference, ED emergency department, ERO extended-release opioid, ICD-9-CM the International Classification of Diseases, Ninth Revision, Clinical Modification, LAO long-acting opioids, NA not applicable, NR not reported, OUD opioid use disorder, PPPM per-patient-per-month, PPPY per-patient-per-year, SAO short-acting opioids, SD standard deviation, STD short-term disability, WC, workers’ compensation
ap value NR
bDiagnoses grouped by 3-digit ICD-9-CM code
cCosts are unadjusted
dPre-index period ranges from − 6 to 0 months relative to index date
ePost-index period ranges from 0 to 6 months relative to index date
fSee Figure 2 of Pasquale et al. [24] for the mean abuse-related costs in the post-index period
gPost-index period includes 365 days after index date
hRefer to Table 3 of Howard et al. [26] for breakdown of top 10 most costly 3-digit ICD-9 codes by place of service
iCosts were charged costs, not adjusted
jPPPM costs
kPost-index period includes 12 months after index date
lTable 6 of study also reports PPPM costs for SAO, LAO, and transdermal fentanyl prescriptions
Additionally, several matched cohort studies reported direct healthcare costs over a 12-month follow-up period that consisted of a 6-month period prior to and a 6-month period following a patient’s index date, which was defined as the date of the first formal abuse diagnosis. The total healthcare cost difference between abusers and matched non-abuser controls began to increase prior to the index date, with excess costs of more than US$3000 per person in the pre-index period [17, 18, 21, 22, 25]. Following the initial diagnosis of abuse, this cost difference increased substantially to US$7971–US$12,727 per person in the post-index period [17, 18, 21, 22, 25]. Other studies reported average per-patient excess costs for the full 12-month period centered on the index date and found that the excess medical costs associated with opioid abuse ranged from US$9847 to US$15,100 [19–21, 25, 26] and excess total healthcare costs were over US$16,000 [25]. One study extended the follow-up period to 18 months post-index, finding that excess costs associated with abuse extend for at least 1 year longer than previously documented and thus reflecting the need for considerable follow-up care over time [25]. Following the incident opioid abuse or OUD diagnosis, excess costs were largely driven by the treatment of opioid and non-opioid substance abuse [17, 18, 21, 22, 25], rehabilitation costs [18, 19, 21, 22], inpatient costs [18, 19, 22, 25], and/or ED costs [19]. Results also suggest that many opioid-abusing individuals are polysubstance abusers and incur considerable excess costs due to the presence of other substance abuse preceding their initial opioid abuse diagnosis [18, 21, 25].
The high costs observed in the abuser groups of matched cohort studies were echoed by the findings of other noncomparative studies. One study found that total aggregate healthcare costs for individuals diagnosed with opioid abuse, dependence, or poisoning in the USA were approximately US$26 billion (2013 USD) [27]. Another study examined patients considered to be high-cost opioid abusers (accounting for top 20% of total healthcare costs) and lower-cost opioid abusers (all remaining patients) and found that high-cost abusers incurred significantly higher mean annual direct healthcare costs compared with the lower-cost group (US$89,177 vs US$11,653; p < 0.001) [28]. Additionally, this systematic review identified 5 economic models [29–33]; however, it is difficult to draw direct conclusions from the cost inputs used in these models because of their varying methods. One economic model estimated total combined direct costs associated with opioid-related poisoning to be approximately US$1.76 billion annually in the USA (2011 USD) [30].
Healthcare Resource Utilization
In comparison to non-abusers, prescription opioid abusers demonstrated increased levels of utilization across several elements of healthcare resource use that are known to affect direct costs, such as days spent in the hospital, outpatient visits, inpatient visits, and the use of ED or rehabilitation facilities as well as pharmacy services (Table 2).
Table 2.
Summary of healthcare resource utilization associated with opioid abuse
| Author, country | Healthcare resource utilization, abusers vs non-abusers | |||||
|---|---|---|---|---|---|---|
| Inpatient visits | LOS, inpatient days | Outpatient visits | ED visits | Rehabilitation facility | Pharmacy | |
| Baser et al. [38], USA |
Patients prescribed an opioid
a
53.39 vs 17.06; p < 0.0001 Patients without an opioid prescription a 47.47 vs 10.69; p < 0.0001 Opioid-related Patients prescribed an opioid a 35.94 vs 0.15; p < 0.0001 Patients without an opioid prescription a 32.54 vs 0.05; p < 0.0001 |
NR |
Patients prescribed an opioid
a
99.99 vs 99.52; p < 0.0001 Patients without an opioid prescription a 99.97 vs 97.13; p < 0.0001 |
Patients prescribed an opioid
a
21.5 vs 10.55; p < 0.0001 Patients without an opioid prescription a 18.5 vs 6.20; p < 0.0001 |
NR | NR |
| Cochran et al. [35], USA | 0.8 (1.2) vs 0.1 (0.4); p <0.0001b |
Hospitalization days
4.8 (11.1) vs 0.5 (2.6); p <0.0001b |
10.3 (10.5) vs 6.5 (6.8); p <0.0001b | 1.7 (4.0) vs 0.3 (0.8); p <0.0001b OR: 1.04; 95% CI 1.02–1.05 |
NR |
Opioid days’ supply
272.5 (367.7) vs 33.2 (104.9); p <0.0001b |
|
Mental health-related hospitalization days
3.2 (7.2) vs 0.0 (0.7); p <0.0001b OR: 1.02; 95% CI 1.01–1.03 |
Mental health-related
b
9.0 (11.0) vs 0.7 (3.1); p <0.0001b OR: 1.04; 95% CI 1.04–1.05 |
Opioid units dispensed
1082.1 (2,112.3) vs 160.0 (890.1); p <0.0001b |
||||
|
Mental health-related
0.4 (0.7) vs 0.0 (0.1); p <0.0001b OR: 1.32; 95% CI 1.16–1.50 |
||||||
| Johnston et al. [34], USA |
Percent of patients with an inpatient visit
WC group a 57.7 vs 9.4c; p < 0.001 STD group a 55.2 vs 16.6; p < 0.001 |
WC group
10.6 (9.2) vs 4.6 (6.9)c; p < 0.001 STD group 10.3 (12.2) vs 5.2 (7.9)c; p < 0.001 |
Percent of patients with an outpatient visit
WC group a 96.8 vs 86.8c; p < 0.001 STD group a 98.4 vs 94.8c; p = 0.0012 |
Percent of patients with an ED visit
WC group a 61.4 vs 31.1c; p < 0.001 STD group a 66.3 vs 34.8c; p < 0.001 |
NR |
Outpatient pharmacy prescriptions
WC group 46.7 (29.0) vs 22.4 (22.1)c; p < 0.001 STD group 47.9 (28.9) vs 20.6 (20.6)c; p < 0.001 |
|
Inpatient visits
WC group 1.8 (1.3) vs 1.3 (0.7)c; p < 0.001 STD group 1.9 (1.4) vs 1.3 (0.7)c; p < 0.001 |
Office visits
WC group 11.0 (8.2) vs 5.7 (6.1)c; p < 0.001 STD group 13.8 (10.4) vs 7.2 (6.2)c; p < 0.001 |
ED visits
WC group 2.1 (3.2) vs 0.5 (1.2)c; p < 0.001 STD group 2.0 (3.4) vs 0.5 (1.1)c; p < 0.001 |
||||
|
Outpatient services
WC group 46.3 (49.1) vs 23.4 (33.6)c; p < 0.001 STD group 67.7 (62.4) vs 44.7 (49.9)c; p < 0.001 |
||||||
| Pasquale et al. [24], USA |
Pre-index
d
Commercial 243 (26.4) vs 238 (12.9)a RR ratio: 2.0; p < 0.0001 Medicare < 65 1138 (35.9) vs 1848 (29.2)a RR ratio: 1.2; p < 0.0001 Medicare ≥ 65 1320 (30.7) vs 2799 (32.5)a RR ratio: 0.9; p < 0.05 |
NR |
Pre-index
d
Commercial 889 (96.5) vs 1729 (93.9)a RR ratio: 1.0 p < 0.005 Medicare < 65 3155 (99.6) vs 6287 (99.2)a RR ratio: 1.0; p < 0.05 Medicare ≥ 65 4298 (99.9) vs 8563 (99.5)a RR ratio: 1.0; p = 0.0 |
Pre-index
d
Commercial 452 (49.1) vs 522 (28.3)a RR ratio: 1.7; p < 0.0001 Medicare < 65 1733 (54.7) vs 2922 (46.1)a RR ratio: 1.2; p < 0.0001 Medicare ≥ 65 1668 (38.3) vs 3362 (39.1)a RR ratio: 1.0; p = 0.70 |
NR | NR |
|
Post-index
e
Commercial 370 (40.2) vs 134 (7.3)a RR ratio: 5.5; p < 0.0001 Medicare < 65 1373 (43.3) vs 1613 (25.5)a RR ratio: 1.7; p < 0.0001 Medicare ≥ 65 1471 (34.2) vs 2154 (25.0)a RR ratio: 1.4; p < 0.0001 |
Post-index
e
Commercial 883 (95.9) vs 1637 (88.9)a RR ratio: 1.1; p < 0.0001 Medicare < 65 3150 (99.4) vs 6241 (98.5)a RR ratio: 1.0; p < 0.0001 Medicare ≥ 65 4295 (99.9) vs 8503 (98.8)a RR ratio: 1.0; p < 0.0001 |
Post-index
e
Commercial 473 (51.4) vs 304 (16.5)a RR ratio: 3.1; p < 0.0001 Medicare < 65 1809 (57.1) vs 2649 (41.8)a RR ratio: 1.4; p < 0.0001 Medicare ≥ 65 1795 (41.7) vs 2816 (32.7)a RR ratio: 1.3; p < 0.0001 |
||||
| Rice et al. [19], USA | See LOS | 4.5 (11.0) vs 0.9 (5.6) Difference: 3.6 Ratio: 4.9; p < 0.001 |
19.7 (17.3) vs 14.4 (15.6) Difference: 5.3 Ratio: 1.4; p < 0.001 |
ED days
2.5 (4.7) vs 0.8 (2.4) Difference: 1.7 Ratio: 3.1; p < 0.001 |
Rehabilitation facility days
6.5 (19.2) vs 0.2 (2.9) Difference: 6.2 Ratio: 31.2; p < 0.001 |
Prescription fills
31.6 (30.6) vs 22.4 (27.7) Difference: 9.2 Ratio: 1.4; p < 0.001 Unique NDC fills 13.3 (12.8) vs 8.5 (8.8) Difference: 4.8 Ratio: 1.6; p < 0.001 |
| Rice et al. [20], USA | See LOS | 5.5 (11.7) vs 0.9 (4.6) Difference: 4.7; p < 0.001 |
24.1 (20.8) vs 16.5 (18.7) Difference: 7.7; p < 0.001 |
ED days
1.7 (3.2) vs 0.6 (1.6) Difference: 1.1; p < 0.001 |
NR |
Prescription fills
36.0 (32.6) vs 29.2 (33.8) Difference: 6.7; p <0.001 Unique NDC fills 14.2 (11.6) vs 10.1 (9.7) Difference: 4.1; p <0.001 |
| Roland et al. [37] USA |
Pre-index
f
0.05 (0.13) vs 0.01 (0.03)g; p < 0.0001 Post-index h 0.07 (0.12) vs 0.01 (0.03)g; p < 0.0001 DIDi: 0.02; p < 0.0001 |
LOS per hospitalization
Pre-index f 1.28 (3.81) vs 0.12 (1.00)g; p < 0.0001 Post-index h 3.06 (5.45) vs 0.23 (1.33)g; p < 0.0001 DIDi: 1.67; p < 0.0001 |
Pre-index
f
2.23 (2.33) vs 0.70 (1.11)g; p < 0.0001 Post-index h 2.57 (2.34) vs 0.74 (1.10)g; p < 0.0001 DIDi: 0.31; p < 0.0001 |
Pre-index
f
0.18 (0.43) vs 0.02 (0.08)g; p < 0.0001 Post-index h 0.18 (0.39) vs 0.02 (0.07)g DIDi: 0.00; p < 0.0001 |
NR |
Prescription fills
Pre-index f 3.40 (3.31) vs 0.90 (1.44)g; p < 0.0001 Post-index h 3.42 (3.10) vs 0.95 (1.44)g DIDi: -0.03; p < 0.0001 |
|
Abuse-related
Pre-index f Abusers: 0.01 (0.04)g Post-index h Abusers: 0.04 (0.06)g DIDi: 0.03; p < 0.0001 |
Abuse-related
Pre-index f Abusers: 0.17 (0.74)g Post-index h Abusers: 0.52 (1.08)g DIDi: 0.35; p < 0.0001 |
Opioid prescription fills
Pre-index f 0.94 (1.12) vs 0.06 (0.23)g; p < 0.0001 Post-index h 0.86 (0.92) vs 0.06 (0.22)g; p < 0.0001 DIDi: − 0.08; p < 0.001 |
||||
|
Office visits
Pre-index f 0.85 (0.87) vs 0.30 (0.40)g; p < 0.0001 Post-index h 0.86 (0.78) vs 0.31 (0.37)g; p < 0.0001 DIDi: 0.00; p < 0.0001 |
||||||
Data are presented as mean (SD) per patient for matched cohorts during the follow-up period, unless otherwise specified
CI confidence interval, DID difference in difference, ED emergency department, LOS length of stay, PPPM per-patient-per-month, NDC National Drug Code, NR not reported, OR odds ratio, OUD opioid use disorder, RR relative risk, STD short-term disability, SD standard deviation, WC workers’ compensation
an (%) with ≥ 1 medical service
bPersons who receive an opioid misuse or dependence diagnosis within two years of filling an opioid prescription (OUDs) versus those who do not receive such a diagnosis within the same period (non-OUDs)
cUnadjusted
dPre-index period includes 365 days before the index date
ePost-index period includes 365 days after the index date
fPre-index period ranges from − 6 to 0 months relative to the index date
gPPPM
hPost-index period ranges from 0 to 6 months relative to the index date
iDID equals (abusers post-index–pre-index) – (nonabusers post-index–pre-index)
Inpatient Visits and Length of Stay
Two studies reported data on annual inpatient stays over a 12-month follow-up period; the average number of annual inpatient stays was 0.8–1.9 for abusers and 0.1–1.3 for controls, respectively [34, 35]. These studies similarly reported that abusers had a significantly higher average number of hospitalization days over a 12-month follow-up period when compared with controls (4.8 and 10.6 days for abusers and 0.5 and 5.2 days for non-abusers, respectively) [34, 35]. In addition, the average number of mental health-related hospitalization days during the same period was significantly greater for abusers compared with controls (3.2 vs 0.0; p < 0.0001) [35]. A separate study showed that patients with OUD diagnoses had higher rates of behavioral healthcare visits [incidence rate ratio (IRR): 7.2; 95% CI 3.8–13.8] compared with patients lacking such diagnoses [36].
Two studies reported the proportion of abusers with 1 or more inpatient visits during a 12-month follow-up period following diagnosis, which varied from 34.2 to 57.7% for abusers and 7.3 to 25.5% for controls [24, 34]. The average proportion of patients with an inpatient visit was highest among Medicare members aged < 65 years (43.3%), compared to privately insured US patients (40.2%) and Medicare members aged ≥ 65 years (34.2%) [24]. Among abusers with a claim for workers’ compensation, the proportion with an inpatient visit was 57.7% [34]. A separate study reported the average number of inpatient stays per-patient-per-month for abusers and controls; results showed that abusers had a significantly higher average number of inpatient stays compared with controls during both the pre- and post-index periods (p <0.0001) [37]. Two studies reported similar inpatient utilization patterns for the average number of hospitalization days assessed over a 12-month period [4.5 and 5.5 days for abusers compared with 0.9 days (both studies) for non-abusers; p < 0.001 (both studies)] [19, 20].
ED Visits
Included studies reported ED utilization as the proportion of patients with 1 or more ED visit, the average number of ED visits, or ED days over a 6- or 12-month follow-up period [19, 20, 24, 34, 35, 37, 38]. Due to inconsistencies in follow-up period length and outcome measurements, it is difficult to draw direct comparisons between these studies. However, all studies reported significantly greater frequencies of ED utilization in abusers compared with non-abusers. The sole exception was a cohort of Medicare patients aged ≥ 65 years in the pre-index period in one study (38.3 visits for abusers vs 39.1 visits for non-abusers) [24].
Pharmacy Utilization
Several included studies reported pharmacy utilization as the average number of opioid days supplied, opioid units dispensed, outpatient pharmacy prescriptions, and prescription fills (including opioid and non-opioid fills). Generally, abusers demonstrated significantly higher levels of pharmacy utilization across all categories compared with non-abusers [19, 20, 34, 35, 37]. A 12-month analysis from 2 similar studies of different claims databases demonstrated that the abuser cohort had an average of 31.6 and 36.0 prescription fills compared with 22.4 and 29.2 prescription fills in the non-abuser group (the difference between abuser and non-abuser cohorts for both studies was reported to be statistically significant, with p < 0.001) [19, 20].
Indirect Costs
Indirect costs were reported in a limited number of studies. Nonetheless, the high cost to society associated with both productivity loss and absenteeism, as well as mortality, among people who abuse prescription opioids is becoming increasingly apparent (Table 3).
Table 3.
Summary of indirect healthcare costs associated with opioid abuse
| Author, country | Currency (adjusted year) | Indirect costs | |||
|---|---|---|---|---|---|
| Work loss/absenteeism | Mortality | Productivity | Criminal justice | ||
| Florence et al. [27], USA | USD (2013) | NR | NR |
Aggregate costs (millions); % aggregate costs
Reduced productive time/increased disability: US$16,262; 95% CI 13,329–19,195; 20.7 Production lost for incarcerated individuals: US$4180; 95% CI 3957–4556; 5.3 Total lost productivity costs: US$20,441; 95% CI 17,286–23,751; 26.0 Fatal costs, lost productivity: US$21,429; 27.3 |
Aggregate costs (millions); % aggregate costs
Police protection: US$2812; 3.6 Legal and adjudication: US$1288; 1.6 Correctional facilities: US$3218; 4.1 Property lost due to crime: US$335; 0.4 Total criminal justice costs: US$7654; 9.7 |
| Inocencio et al. [30], USA | USD (2011) |
Absenteeism costs
Per case: US$618 Total (thousands): US$256,173 |
Per case: US$33,664 Total (thousands): US$13,887,512 |
Per case: US$34,285 Total (thousands): US$14,143,685 |
NR |
| Johnston et al. [34], USA | USD (2014) |
Adjusted lost wages associated with work loss
a
WC group; p = 0.5 Abusers: US$13,285 Non-abusers: US$14,963 STD group; p < 0.001 Abusers: US$9718 Non-abusers: US$7661 |
NR | NR | NR |
| Patel et al. [39], USA | USD (2012) | NR | Productivity costs attributed to opioid poisoning-related mortality: 98.6% | Total productivity costs of pediatric opioid poisonings: US$209.7 million | NR |
| Rice et al. [19], US | USD (2012) |
Total work-loss costs
Abusers: US$3773 (6648) Controls: US$2528 (4612) Difference: US$1244 Ratio: 1.5; p < 0.001 Medically related absenteeism costs Abusers: US$2395 (4305) Controls: US$1655 (2840) Difference: US$739 Ratio: 1.4; p < 0.001 |
NR |
Disability costs
Abusers: US$1378 (5347) Controls: US$873 (3600) Difference: US$505 Ratio: 1.6; p = 0.007 |
NR |
Data are presented as mean (SD) per patient for matched cohorts during follow-up period, unless otherwise specified
CI confidence interval, NR not reported, SD standard deviation, STD short-term disability, WC workers’ compensation
aAdjusted values may be found in from Figure 2 of Johnston et al. [34], SD are NR
Multiple studies demonstrated that the indirect costs related to work loss, absenteeism, and/or productivity loss were substantial among prescription opioid abusers [19, 27, 30, 34, 39]. Average absenteeism costs for prescription opioid abuse in the USA were estimated to be US$618 per case and approximately US$256 million annually in total (2011 USD) [30]. Over a 12-month follow-up period, abusers accumulated an average cost of US$3773 per person due to work loss, which was US$1244 greater than work loss costs accumulated in the control cohort [19]. Of the US$3773 average annual work-loss costs incurred by abusers, US$2395 was attributable to medically related absenteeism and US$1378 to disability (compared to US$1655 and US$873 for non-abusers, respectively, with p = 0.007 and p < 0.001) [19].
Mortality costs for abuse of prescription opioids, estimated as the net present value of lost future wages due to mortality, were estimated to be US$33,664 per case and approximately US$13.9 billion annually in total (2011 USD) [30], which was 54 times the estimated absenteeism costs associated with abuse of prescription opioids in the same study. A separate analysis reported that, in 2012, approximately 99% of lost productivity costs were attributed to opioid poisoning-related mortality, with the total lost productivity costs of pediatric opioid poisonings due to caregivers’ absenteeism and premature mortality totaling approximately US$210 million in that year [39]. Although the overall body of evidence remains limited, the contribution of mortality to the societal burden of abuse of prescription opioids has the potential to be extremely high.
Medication-Assisted Treatment
Several studies that assessed costs and resource use in patients treated with MAT were also identified by the systematic literature review. These studies illustrated that a number of factors, such as adherence to maintenance therapy, dose, formulation (film or tablet), and whether patients relapsed while on treatment, were associated with both direct costs and HRU among this patient group (Tables 4, 5). In particular, patients who relapsed while undergoing buprenorphine-medication assisted treatment (B-MAT) experienced significantly higher average total healthcare costs than patients who did not relapse (US$26,969 vs US$11,000; p < 0.001) [40]. Furthermore, 2 studies reported that patients who were non-adherent to B-MAT had significantly greater healthcare costs than B-MAT-adherent patients (US$13,280 and US$49,051 vs US$9531 and US$28,458, respectively) [41, 42].
Table 4.
Summary of direct costs associated with medication-assisted treatment studies
| Author, country | Type of opioid abuse | Treatment(s), n | Direct costs | ||||
|---|---|---|---|---|---|---|---|
| Inpatient | Outpatient | ED | Pharmacy | Total healthcare | |||
| Brady et al. [40], USA | Abuse, dependence, overdose/poisoninga |
B-MAT patients
No relapse: 357 Relapse: 120 |
US$2254 (13,069) vs US$10,860 (15,941)b; p < 0.001 | US$2562 (10,788) vs US$9964 (23,695)b; p < 0.001 | US$797 (2584) vs US$1436 (2685)b; p < 0.001 Office visits US$1470 (3395) vs US$2598 (5533)b; p = 0.079 |
US$3868 (7244) vs US$2103 (2199)b; p < 0.001 | US$11,000 (21,491) vs US$26,969 (37,669)b; p < 0.001 |
| Clark et al. [58], USA | Abuse, dependencea | MassHealth members who received treatment for opioid addiction, 2004–2010: 56,278 Buprenorphine: 18,866 Methadone: 24,309 Non-OAT behavioral health: 31,220 |
NR | NR | NR | NR | Methadone and buprenorphine treatment episodes were associated with US$223 to US$153 lower total healthcare expenditures per month than other non-OAT behavioral health treatment episodesc |
| Clay et al. [43], USA | Dependenced | Patients using buprenorphine/naloxone film formulation: 2796 Patients using tablet buprenorphine/naloxone formulation: 1510 |
Pre-indexe,f Tablet: US$9987; 95% CI 7105–14,038 Film: US$7534; 95% CI 4562–10,392 p = 0.0049 (GLM); p = 0.0040 (logistic model) |
Pre-indexe,f Tablet: US$7066; 95% CI 5799–8612 Film: US$6478; 95% CI 5346–7849 p = 0.0485 |
Pre-indexe,f Tablet: US$91; 95% CI 63–130 Film: US$66; 95% CI 48–91 p = 0.0842 (GLM); p = 0.1306 (logistic model) |
Pre-indexe,f Tablet: US$2546; 95% CI 1988–3260 Film: US$2008; 95% CI 1582–2549 p < 0.0001 |
Pre-indexe,f Tablet: US$20,632; 95% CI 16,895–25,195 Film: US$17,772 95% CI 14,644–21,569 p = 0.0008 |
| Post-indexf,g Tablet: US$8198; 95% CI 5550–12,111 Film: US$5371; 95% CI 3499–8245 p = 0.0806 (GLM); p = 0.0158 (logistic model) |
Post-indexf,g Tablet: US$6668; 95% CI 2685–16,558 Film: US$5507; 95% CI 2217–13,676 p = 0.0104 |
Post-indexf,g Tablet: US$79; 95% CI 42–145 Film: US$57; 95% CI 28–112 p = 0.3917 (GLM); p = 0.3852 (logistic model) |
Post-indexf,g Tablet: US$4467; 95% CI 2886–6963 Film: US$4028; 95% CI 2586–6275 p = 0.0039 |
Post-indexf,g Tablet: US$19,853; 95% CI 4515–87,291 Film: US$14,431; 95% CI 3277–63,532 p < 0.0001 |
|||
| Khemiri et al. [44], USA | Abuse, dependencea |
Privately insured population
Buprenorphine/naloxone ≤ 15.7 mg/day: 1949 Buprenorphine/naloxone > 15.7 mg/day: 1949 |
Privately insured population
Pre-indexe US$6985 (18,596) vs US$7607 (21,550); p = 0.34 |
Privately insured population
Pre-indexe US$6594 (11,802) vs US$7416 (24,909); p = 0.19 |
Privately insured population
Pre-indexe US$138 (781) vs US$102 (482); p = 0.09 |
Privately insured population
Pre-indexe US$2914 (5983) vs US$3688 (7882); p = 0.001 |
Privately insured population
Pre-indexe US$16,632 (27,083) vs US$18,814 (40,440); p = 0.049 |
|
Post-index
g
US$9524 (28,920) vs US$7223 (22,077); p = 0.04 |
Post-index
g
US$6246 (9366) vs US$6507 (11,935); p = 0.57 |
Post-index
g
US$169 (1290) vs US$127 (606); p = 0.35 |
Post-index
g
US$5060 (4323) vs US$7435 (4871); p = 0.0001 |
Post-index
g
US$21,001 (34,102) vs US$21,295 (29,101); p = 0.83 |
|||
|
Publicly insured population
Buprenorphine/naloxone ≤ 15 mg/day: 1041 Buprenorphine/naloxone > 15 mg/day: 1041 |
Publicly insured population
Pre-indexh US$1734 (8033) vs US$1983 (9833); p = 0.53 |
Publicly insured population
Pre-indexh US$2567 (4697) vs US$2622 (4049); p = 0.58 |
Publicly insured population
Pre-indexh US$796 (1923.21) vs US$654 (1256.92); p = 0.33 |
Publicly insured population
Pre-indexh US$1243 (2869) vs US$1196 (2450); p = 0.27 |
Publicly insured population
Pre-indexh US$6340 (11,337) vs US$6455 (11,818); p = 0.82 |
||
|
Post-index
g
US$1595 (7765) vs US$1241 (7362); p = 0.46 |
Post-index
g
US$6076 (8623) vs US$5640 (7176); p = 0.39 |
Post-index
g
US$978 (2251) vs US$915 (1698); p = 0.62 |
Post-index
g
US$5998 (7019) vs US$6817 (4748); p = 0.03 |
Post-index
g
US$14,648 (16,426) vs US$14,614 (12,398); p = 0.97 |
|||
| Masters et al. [51], USA | Addiction, abuse, misuse, overusea | Cases: 1126 Controls: 10,314 |
US$7719 vs US$5378f Difference: US$2341; p = 0.1231 |
US$11,360 vs US$8564f Difference: US$2796; p < 0.0001 |
Hospital ambulatory (includes ED) costs
US$4303 vs US$4212f Difference: US$91; p = 0.8336 |
US$9696 vs US$10,755f Difference: US$ -1,059; p = 0.4210 |
Year 1
US$38,020 vs US$31,641f; p = 0.0049 Year 2 US$30,312 vs US$28,316f; p = 0.3096 Year 3 US$29,330 vs US$28,348f; p = 0.6066 |
| Shah et al. [45], USA | OUDa | PT: 5275 NPT: 5275 |
NR | NR | NR | NR |
Total direct medical costs
US$23,003 vs US$25,626; p < 0.01 |
| Shah et al. [46], USA | OUDa | ER-naltrexone: 1041 Buprenorphine: 20,566 Methadone: 745 NPT: 6883 |
NR | NR | NR | NR |
% change in total costs
ER naltrexone: +5; p = 0.17 Buprenorphine: +43; p < 0.01 Methadone: +47.7; p < 0.01 NPT: +38.3; p < 0.01 |
| Tkacz et al. [41], USA | Abuse, dependence, overdose/poisoninga | B-MAT adherent: 146 B-MAT non-adherent: 309 |
US$10,982 (4142) vs US$26,470 (3163)i; p < 0.001 | US$9288 (1871) vs US$14,570 (1430)i; p = 0.011 | US$1891 (717) vs US$4439 (547)i; p < 0.001 | US$6156 (269) vs US$3581 (205)i; p < 0.001 | US$28,458 (5376) vs US$49,051 (4108)i; p = 0.001 |
| Tkacz et al. [42], USA | Abuse, dependence, overdose/poisoninga | B-MAT adherent: 205 B-MAT non-adherent: 272 |
US$2090 (9632) vs US$6175 (16,837)j; p < 0.001 | US$2372 (5831) vs US$5971 (19,658)j; p = 0.004 | US$648 (1804) vs US$1191 (3081)j; p = 0.014 | US$5103 (8889) vs US$2158 (2978)j; p < 0.001 US$4962 (493) vs US$1990 (176)i,k; p < 0.001 |
US$11,857 (17,442) vs US$17,399 (32,742)j; p = 0.485 US$9531 (1110) vs US$13,280 (1415)I,k; p = 0.001 |
Data are presented as mean (SD) per patient, unless otherwise specified. Currency is US$ for all studies; year of valuation was not reported in any of the included studies
B-MAT buprenorphine-medication assisted therapy, CI confidence interval, ED emergency department, ER extended-release, GLM generalized linear model, NPT non-pharmacological therapy, NR not reported, OAT opioid agonist therapy. OUD opioid use disorder, PMPM per member per month, PT pharmacologic therapy, SD standard deviation, SE standard error
aUnclear whether patient population is limited to prescription opioid abuse only, or if population includes heroin users
bPaid amount
cSee Figure 2 of Clark et al. [58] for chart of PMPM total expenditures for MassHealth members who received treatment for opioid addiction
dPatient population does not include heroin users
ePre-index period includes 12 months before the index date
fAdjusted costs
gPost-index period includes 12 months after index date
hPre-index period includes 6 months before index date
iMean (SE) adjusted post-period costs
jBivariate results
kMultivariate results
Table 5.
Summary of healthcare resource utilization associated with medication-assisted treatment studies
| Author, country | Type of opioid abuse | Treatment(s), n | Healthcare resource utilization, abusers vs non-abusers | ||||
|---|---|---|---|---|---|---|---|
| Inpatient visits | LOS, days | Outpatient visits | ED visits | Pharmacy | |||
| Brady et al. [40], USA | Abuse, dependence, overdose/poisoninga |
B-MAT patients
No relapse: 357 Relapse: 120 |
49 (13.7) vs 88 (73.3)b; p < 0.001 | NR | 7.5 (15.1) vs 21.1 (25.2); p < 0.001 Office visits 12.7 (12.6) vs 16.5 (18.9); p = 0.333 |
107 (30.0) vs 68 (56.7)b; p < 0.001 |
Prescription fills
26.3 (22.4) vs 21.5 (21.0); p = 0.003 |
| Clay et al. [43], USA | Dependence | Patients using buprenorphine/naloxone film formulation: 2796 Patients using tablet buprenorphine/naloxone formulation: 1510 |
Mean probability to have ≥ 1 hospitalization
Pre-index c Tablet: 0.34; 95% CI 0.30–0.39 Film: 0.3; 95% CI 0.26–0.35; p = 0.004 |
NR |
Pre-index
c
Tablet: 8.74; 95% CI 7.96–9.61 Film: 8.93; 95% CI 8.14–9.80; p = 0.2074 |
Mean probability to have ≥ 1 ED visit
Pre-index c Tablet: 0.14; 95% CI 0.12–0.15 Film: 0.12; 95% CI 0.11–0.13; p = 0.1306 |
Pharmacy claims
Pre-index c Tablet: 28.32; 95% CI 24.37–32.90 Film: 26.76; 95% CI 23.16–30.92; p = 0.0893 |
|
Post-index
d
Tablet: 0.23; 95% CI 0.20–0.25 Film: 0.19; 95% CI 0.17–0.22; p = 0.0158 |
Post-index
d
Tablet: 9.51; 95% CI 8.60–10.52 Film: 9.88; 95% CI 8.95–10.92; p = 0.0185 |
Post-index
d
Tablet: 0.11; 95% CI 0.09–0.13 Film: 0.1; 95% CI 0.08–0.12; p = 0.3852 |
Post-index
d
Tablet: 33.61; 95% CI 27.65–40.85 Film: 32.71; 95% CI 26.95–39.70; p = 0.2624 |
||||
| Khemiri et al. [44], USA | Abuse, dependencea |
Privately insured population
Buprenorphine/naloxone ≤ 15.7 mg/dayb: 1949 Buprenorphine/naloxone > 15.7 mg/dayb: 1949 Publicly insured population Buprenorphine/naloxone ≤ 15 mg/dayb: 1041 Buprenorphine/naloxone > 15 mg/dayb: 1041 |
In the publicly insured population, the probability of psychiatric hospitalization in the year following the treatment initiation was 17% lower in the higher-dose group (p = 0.0214). |
Privately insured population, psychiatric inpatient
Post-index c 5.9 vs 3.8; p = 0.02 |
NS | NS |
Privately insured population, pharmaceutical claims
Pre-index d 31.8 vs 34.6; p = 0.01 Post-index c 39.4 vs 43.0; p = 0.01 |
| Tkacz et al. [41], USA | Abuse, dependence, overdose/poisoninga | B-MAT adherent: 146 B-MAT non-adherent: 309 |
0.52 (0.26) vs 1.41 (0.20)e; p < 0.001 |
Inpatient
3.7 (1.1) vs 10.0 (0.8)e; p < 0.001 |
27.3 (2.3) vs 30.1 (1.8)e; p = 0.264 | 0.78 (0.22) vs 1.61 (0.17)e; p < 0.001 |
Prescription fills
32.8 (1.4) vs 25.8 (1.0)e; p < 0.001 |
| Tkacz et al. [42], USA | Abuse, dependence, overdose/poisoninga | B-MAT adherent: 205 B-MAT non-adherent: 272 |
31 (15.1) vs 106 (39.0)f; p < 0.001 | NR | 8.6 (15.6) vs 12.6 (21.2); p = 0.030 Office visits 15.0 (13.2) vs 12.6 (15.4); p = 0.002 |
61 (29.8) vs 114 (41.9)f; p = 0.006 |
Prescription fills
28.1 (20.4) vs 22.9 (23.1); p < 0.001 |
| Shah et al. [45], USA | OUDa | PTb: 5275 NPTb: 5275 |
PT vs NPT: 0.5 vs 0.6; p < 0.01 | NR | PT vs NPT: 37.1 vs 42.5; p < 0.01 | “No difference in ED visits across the two cohorts during follow-up period” | NR |
| Shah et al. [46], USA | OUDa | ER-naltrexone: 1041 Buprenorphine: 20,566 Methadone: 745 NPT: 6883 |
% change in inpatient visits from baseline to follow-up
ER naltrexone: − 46.6; p < 0.01 Buprenorphine: − 20.8; p < 0.01 Methadone: − 23.2; p = 0.06 NPT: − 15.1; p < 0.01 |
NR |
% change in outpatient visits from baseline to follow-up
ER naltrexone: +24.7; p < 0.01 Buprenorphine: +68.1; p < 0.01 Methadone: +195.2; p < 0.01 NPT: +92.8; p < 0.01 |
% change in ED visits from baseline to follow-up
ER naltrexone: − 26.1; p < 0.01 Buprenorphine: − 13.3; p < 0.01 Methadone: − 8.6; p = 0.35 NPT: − 15.5; p < 0.01 |
NR |
Data are presented as mean (SD) per patient, unless otherwise specified. Currency is US$ for all studies; year of valuation was not reported in any of the included studies
Data are presented as mean (SD) per patient during follow-up period, unless otherwise specified
B-MAT buprenorphine-medication assisted therapy, ED emergency department, ER extended-release, LOS, length of stay, NPT non-pharmacological therapy, NR not reported, NS not significant, OUD opioid use disorder, PT pharmacologic therapy, SD standard deviation, SE standard error
aUnclear whether patient population is limited to prescription opioid abuse only, or if population includes heroin users
bMatched cohort
cPost-index period ranges from 0 to 12 months relative to the index date
dPre-index period ranges from − 12 to 0 months relative to the index date
eAdjusted mean (SE) post-period service utilization
fn (%) with ≥ 1 medical service
Among patients treated with buprenorphine/naloxone combination therapy, those who were administered a tablet had higher total healthcare costs than patients who were treated with a film formulation [43]. A separate analysis in which patients were treated with either a high or low dose of buprenorphine/naloxone, however, showed that dose did not affect costs [44].
A matched cohort analysis of patients with OUD demonstrated that those who were treated with pharmacological therapy incurred significantly lower total direct medical costs compared with patients treated with non-pharmacological therapy (US$23,003 vs US$25,626) [45]. Among patients with OUD who were treated with MAT or non-pharmacological therapy, those treated with extended-release naltrexone did not incur a significantly higher increase in total healthcare costs from baseline over the 12-month follow-up period, whereas patients treated with buprenorphine, methadone, and non-pharmacological therapy did experience significantly higher increases in total healthcare costs [46].
International Studies
Two studies from outside the USA were identified, including 1 economic model from Greece and a study of hospitalizations related to opioid poisoning in Australia [33, 47]. The study from Greece was a budget-impact analysis estimating the potential economic savings that could be derived from switching patients receiving buprenorphine monotherapy or methadone to once-weekly buprenorphine/naloxone opioid substitution treatment [33]. Results suggested that this treatment switch could minimize mean annual costs per patient by approximately 50% and increase access to opioid substitution therapy in Greece. The Australian study found that hospitalizations due to opioids (excluding heroin) increased from 23 to 58% between 1998 and 2009, along with an increased rate of poisoning deaths involving prescription opioids and other illicit substances between 2002 and 2011 (0.78–1.19 deaths/100,000 population) [47].
Quality Assessment
Quality assessment was conducted on 47 of the 49 included studies using peer-reviewed checklists published by Task Forces sponsored by the International Society of Pharmacoeconomics and Outcomes Research (ISPOR) and others; 2 government reports [48, 49] that were identified in this review did not undergo quality assessment due to the lack of a validated checklist. Most studies (38) that were retrospective in design properly described the attributes of the data sources used to conduct the study and clearly defined study populations and variable definitions. However, several studies (16) did not clearly report quality checks or data cleaning procedures. Further details of the quality assessment for individual studies are reported in Online Appendix E.
Discussion
This systematic literature review of 49 unique studies highlights the considerable economic burden of prescription opioid abuse. Most of the identified studies examined direct costs and HRU, which were significantly higher for prescription opioid abusers than for non-abusers in nearly all matched cohort analyses. Fewer studies reported data on indirect costs; however, those that did suggested a high societal burden related to productivity losses and absenteeism as well as mortality among those who abuse opioids.
This review identified studies published from 2012 to 2017, and thus included studies that have previously been reported in earlier reviews as well as new evidence that contributes to the overall body of knowledge describing the economic burden of abuse of prescription opioids. The current review includes a larger number of studies (49) compared with previously published similar systematic literature reviews, including Oderda et al. [10] (16 publications), Meyer et al. [9] (23 publications), and Strassels [11] (41 publications). Although each review used different inclusion and exclusion criteria, the relatively high number of studies in this review suggests that the economic burden of prescription opioid abuse is an area of continued research interest.
Earlier reviews assessed the economic burden of abuse of prescription opioids from the perspective of payers, with many of the identified studies reporting claims data to evaluate the overall or per-patient economic burden of opioid abuse compared with a matched population [9–11]. Data sources have included both private insurance claims and government claims databases [primarily US Medicaid, Medicare, and the Veteran’s Health Administration (VHA)]. Oderda et al. [10] reported that costs of opioid abuse may be higher among patients in the publicly funded programs (Medicaid and the VHA) compared with the US privately insured population.
The current review captured several recent retrospective claims analyses quantifying the costs associated with abuse of prescription opioids in US-focused privately insured populations that were not included in previous reviews [17, 18, 21–23, 25, 26, 34, 35, 40–43, 45, 46, 50, 51]. Studies that evaluated annual healthcare costs suggested that costs for a privately insured population of abusers (US$20,343 to US$28,718) were similar to the costs of abusers in the VHA population (US$28,882) [17–23, 38]. Results from these analyses also indicated that excess costs per patient are similarly high in the privately insured US population with annual average excess costs of approximately US$9000 to US$16,000 [17–22, 25] compared with the approximately US$16,000 excess costs per patient reported in Oderda et al. [10]. However, the overall economic burden of opioid abuse may be higher in the Medicaid and VHA populations as the prevalence of abusers has been reported to be 10- and 7-fold higher for the Medicaid and VHA populations, respectively, compared with the privately insured population [38, 52]. Differences across the various privately and publicly insured populations are likely to result from a number of factors, including amounts reimbursed by patients’ insurance plans and private and public payer structures. Furthermore, varying prevalence rates of prescription opioid abuse across these different populations may result in costs to payers and society that do not necessarily follow the same pattern as the direct costs above: for example, a higher prevalence of abuse among the < 65-year Medicare population than the privately insured population in the USA may result in higher plan and societal costs among the < 65-year Medicare patients compared with privately insured US patients [53].
Several of the included retrospective claim analyses evaluated costs during the pre- and post-index periods [17, 18, 21, 22, 25], and supported the observation that excess costs of opioid abuse begin to accumulate well before the initial diagnosis. Additionally, excess costs persisted beyond the typically studied 12-month follow-up period, which can be driven by other substance abuse [18, 21, 25]. This trend was not previously discussed in past systematic reviews and highlights the incremental increases in cost that are observed both prior to and after an abuse diagnosis [9, 10].
Prescription opioid abusers utilized healthcare resources more intensively than non-abusers, including days spent in the hospital, outpatient visits, and inpatient visits. In addition to a higher overall number of hospitalization days, the average number of mental health-related hospitalization days was significantly greater for opioid abusers compared with controls in one study [35]. This result complements other research indicating that mental health disorders may be predictors of opioid abuse and is an important distinction when considering economic burden as mental health-related hospitalizations are often longer than other types of inpatient stays [5, 54, 55].
While there is still a lack of peer-reviewed analyses assessing indirect costs and societal burden associated with abuse of prescription opioids—highlighting an important evidence gap in the published literature—3 additional studies identified by this review further substantiate the indirect cost burden reported in earlier reviews [9, 10, 27, 34, 39]. Previous reviews reported that workplace costs comprised the bulk of societal economic burden and were generally related to lost earnings and productivity [9–11]. Two studies identified in this review suggest that mortality associated costs are also a potential key factor in the economic burden landscape, with one study reporting total mortality costs of nearly US$14 billion (2011 USD) [30, 39]. A report recently released by the White House Council of Economic Advisors estimated that the total costs associated with abuse of opioids (both licit and illicit) would be substantially higher when calculating indirect costs using the value of a statistical life method [56]. The report estimated that mortality costs associated with opioid abuse, including heroin, may be as high as 3- to 7.6-fold of non-mortality costs. While this study has not been peer reviewed, the findings highlight a need to better understand the indirect cost implications of abuse of opioids, including economic implications of increased mortality.
When published in 2009, the review by Strassels [11] noted that the economic implications of abuse-deterrent formulations (ADFs) that were in development at the time would be dependent on the reductions in societal burden of misuse, abuse, and diversion, particularly from the payer perspective; this remains the case today. The value and effectiveness of ADFs were recently evaluated in a report by the Institute for Clinical and Economic Review (ICER) [57]. As the report was not a peer-reviewed publication, it was not included in the formal systematic literature review. Although ICER’s economic model suggested that ADFs could lead to cost increases for the healthcare system in the base case, a scenario analysis that accounted for cases of diverted abuse noted that cost neutrality could be achieved in certain scenarios that accounted for reductions in societal burden.
A number of studies that examined MAT were also identified in the current review, many of which were not included in previous systematic reviews [40, 42, 45, 46, 51, 58]. These studies examined disparate and varied economic elements related to MAT, indicating that adherence to therapy, dose, formulation, and whether relapse occurs are all associated with direct costs as well as HRU among those undergoing therapy. One study reported that patients receiving pharmacological treatments incurred lower direct medical costs compared with those treated with non-pharmacological therapies [45]. Studies also reported that patients who did not adhere to MAT had substantially greater healthcare costs than MAT-adherent patients [41, 42]. Further investigation into the relationship between MAT and the economic burden of prescription opioid abuse is needed.
Only two English-language studies [33, 47] from outside the USA met the criteria for inclusion in this systematic review. Nonetheless, European countries have noted a shift in recent years from heroin use toward abuse of prescription opioids. For example, in 2014, 18 countries reported that > 10% of all opioid treatment admissions were for problems related to non-heroin opioids, an increase from 11 countries in the year prior [59]. Given these trends, the economic burden of opioid abuse outside the USA may be an area that warrants future research.
Limitations
The findings reported in the current systematic literature review are subject to several limitations. The review was restricted to literature published in the last 5 years, building on evidence from prior systematic reviews. Results of key studies that were published prior to 2012 are contextualized in this review and references are available in the earlier publications. In many of the included studies, it was difficult to discern whether study subjects abused heroin in addition to prescription opioids, particularly in MAT studies. In addition, study designs varied considerably making it difficult to directly compare findings. Furthermore, it is possible that the definitions of “abuse” differed across studies; such definitions were taken as specified within each study, and the particular type of prescription opioid abuse investigated in each study is reported in Electronic Supplementary Material 1: Online Appendix D. Finally, restricting the review to English-language literature only may have excluded potentially relevant studies of opioid abuse from outside the USA and other English-speaking countries.
Conclusions
Findings from this systematic literature review suggest that the economic burden associated with prescription opioid abuse is substantial such that, for the privately insured US population, annual average excess costs ranged from approximately US$9000 to US$16,000 above those of non-abusers. Additionally, this review suggests that the economic burden of prescription opioid abuse is characterized not only by direct healthcare costs and medical utilization, but also by considerable indirect costs and societal burden.
Additional research into the societal economic burden of prescription opioid abuse is of interest within and outside of the USA because an improved understanding of the magnitude of these indirect costs will inform policy making. As demonstrated herein, the literature supporting these areas remains sparse, and future research could focus on elements of indirect costs, including those associated with mortality. The economic implications of MAT and ADFs also warrant further study, and any future inquiries on these topics should carefully evaluate both costs and benefits.
Electronic supplementary material
Below is the link to the electronic supplementary material.
Author Contributions
MR, LMS, NYK, and JGE were the primary developers of the study design. Review of identified studies and data extraction were done primarily by CP and NS. All authors reviewed and discussed the study results and contributed to writing and editing the manuscript. The authors take full responsibility for the content of the manuscript but thank Tim Peoples of Analysis Group, Inc. for providing medical writing support. The methods of this review were prespecified in a protocol that was developed and executed by Analysis Group without input from the study funder, Purdue Pharma L.P. The authors would also like to thank the anonymous reviewers for their thoughtful comments.
Data Availability Statement
The authors declare that the data supporting the findings of this study are available within the article and its supplementary information files.
Compliance with Ethical Standards
This study was funded by Purdue Pharma L.P. NYK, CP, MR, LMS, and NS are employees of Analysis Group, Inc., a company that received funding from Purdue Pharma L.P. to conduct this study. JGE is a full-time employee of Purdue Pharma L.P.
References
- 1.Ahrnsbrak R, Bose J, Hedden SL, Lipari RN, Park-Lee E. Key substance use and mental health indicators in the United States: Results from the 2016 National Survey on Drug Use and Health. 2017. https://www.samhsa.gov/data/sites/default/files/NSDUH-FFR1-2016/NSDUH-FFR1-2016.htm#opioid1. Accessed 23 Jan 2018.
- 2.Degenhardt L, Charlson F, Mathers B, Hall WD, Flaxman AD, Johns N, et al. The global epidemiology and burden of opioid dependence: results from the global burden of disease 2010 study. Addiction. 2014;109(8):1320–1333. doi: 10.1111/add.12551. [DOI] [PubMed] [Google Scholar]
- 3.American Psychiatric Association . Diagnostic and statistical manual of mental disorders. 5. Arlington: American Psychiatric Publishing; 2013. [Google Scholar]
- 4.Hedegaard H, Warner M, Miniño AM. Drug overdose deaths in the United States, 1999–2016. Hyattsville, MD: US Department of Health and Human Services, Centers for Disease Control and Prevention, National Center for Health Statistics; 2017. Report No.: 294.
- 5.Hughes A, Williams MR, Lipari RN, Bose J, Copello EAP, Kroutil LA. Prescription drug use and misuse in the United States: results from the 2015 National Survey on Drug Use and Health. In: NSDUH Data Review. 2016. https://www.samhsa.gov/data/sites/default/files/NSDUH-FFR2-2015/NSDUH-FFR2-2015.htm. Accessed 02 Jan 2018.
- 6.National Institutes of Health. What is the federal government doing to combat the opioid abuse epidemic? Testimony by Nora D. Volkow, Director, National Institute on Drug Abuse House Committee on Energy and Commerce, Subcommittee on Oversight and Investigations. 2015. https://www.drugabuse.gov/about-nida/legislative-activities/testimony-to-congress/2016/what-federal-government-doing-to-combat-opioid-abuse-epidemic. Accessed 02 Jan 2018.
- 7.National Institutes of Health. Federal efforts to combat the opioid crisis: a status update on CARA and other initiatives. Testimony by Nora Volkow, Director, National Institute on Drug Abuse and others to House Committee on Energy and Commerce. 2017. https://www.drugabuse.gov/about-nida/legislative-activities/testimony-to-congress/2017/federal-efforts-to-combat-opioid-crisis-status-update-cara-other-initiatives. Accessed 02 Jan 2018.
- 8.Birnbaum HG, White AG, Schiller M, Waldman T, Cleveland JM, Roland CL. Societal costs of prescription opioid abuse, dependence, and misuse in the United States. Pain Med. 2011;12(4):657–667. doi: 10.1111/j.1526-4637.2011.01075.x. [DOI] [PubMed] [Google Scholar]
- 9.Meyer R, Patel AM, Rattana SK, Quock TP, Mody SH. Prescription opioid abuse: a literature review of the clinical and economic burden in the United States. Popul Health Manag. 2014;17(6):372–387. doi: 10.1089/pop.2013.0098. [DOI] [PMC free article] [PubMed] [Google Scholar]
- 10.Oderda GM, Lake J, Rudell K, Roland CL, Masters ET. Economic burden of prescription opioid misuse and abuse: a systematic review. J Pain Palliat Care Pharmacother. 2015;29(4):388–400. doi: 10.3109/15360288.2015.1101641. [DOI] [PubMed] [Google Scholar]
- 11.Strassels SA. Economic burden of prescription opioid misuse and abuse. J Manag Care Spec Pharm. 2009;15(7):556–562. doi: 10.18553/jmcp.2009.15.7.556. [DOI] [PMC free article] [PubMed] [Google Scholar]
- 12.Liberati A, Altman DG, Tetzlaff J, Mulrow C, Gotzsche PC, Ioannidis JP, et al. The PRISMA statement for reporting systematic reviews and meta-analyses of studies that evaluate health care interventions: explanation and elaboration. Ann Intern Med. 2009;151(4):W65–W94. doi: 10.7326/0003-4819-151-4-200908180-00136. [DOI] [PubMed] [Google Scholar]
- 13.Moher D, Liberati A, Tetzlaff J, Altman DG, Group P. Preferred reporting items for systematic reviews and meta-analyses: the PRISMA statement. Ann Intern Med. 2009;151(4):264–269. doi: 10.7326/0003-4819-151-4-200908180-00135. [DOI] [PubMed] [Google Scholar]
- 14.Berger ML, Martin BC, Husereau D, Worley K, Allen D, Yang W, et al. A questionnaire to assess the relevance and credibility of observational studies to inform health care decision making: an ISPOR-AMCP-NPC Good Practice Task Force report. Value Health. 2014;17(2):143–156. doi: 10.1016/j.jval.2013.12.011. [DOI] [PMC free article] [PubMed] [Google Scholar]
- 15.Motheral B, Brooks J, Clark MA, Crown WH, Davey P, Hutchins D, et al. A checklist for retrospective database studies–report of the ISPOR Task Force on Retrospective Databases. Value Health. 2003;6(2):90–97. doi: 10.1046/j.1524-4733.2003.00242.x. [DOI] [PubMed] [Google Scholar]
- 16.Drummond MF, Jefferson TO. Guidelines for authors and peer reviewers of economic submissions to the BMJ. The BMJ Economic Evaluation Working Party. BMJ (Clinical Research ed). 1996;313(7052):275–283. doi: 10.1136/bmj.313.7052.275. [DOI] [PMC free article] [PubMed] [Google Scholar]
- 17.Howard J, Kirson N, Scarpati L, Dincer A, Hanway J, Zichlin M, et al. Diagnosis-level drivers and trajectory of excess costs prior to and after diagnosis of opioid abuse. J Manag Care Spec Pharm. 2016;22(10-a Suppl):S44. [Google Scholar]
- 18.Kirson NY, Scarpati LM, Enloe CJ, Dincer AP, Birnbaum HG, Mayne TJ. The economic burden of opioid abuse: Updated findings. J Manag Care Spec Pharm. 2017;23(4):427–445. doi: 10.18553/jmcp.2017.16265. [DOI] [PMC free article] [PubMed] [Google Scholar]
- 19.Rice JB, Kirson NY, Shei A, Cummings AK, Bodnar K, Birnbaum HG, et al. Estimating the costs of opioid abuse and dependence from an employer perspective: a retrospective analysis using administrative claims data. Appl Health Econ Health Policy. 2014;12(4):435–446. doi: 10.1007/s40258-014-0102-0. [DOI] [PMC free article] [PubMed] [Google Scholar]
- 20.Rice JB, Kirson NY, Shei A, Enloe CJ, Cummings AK, Birnbaum HG, et al. The economic burden of diagnosed opioid abuse among commercially insured individuals. Postgrad Med. 2014;126(4):53–58. doi: 10.3810/pgm.2014.07.2783. [DOI] [PubMed] [Google Scholar]
- 21.Scarpati LM, Kirson NY, Zichlin ML, Jia ZB, Birnbaum HG, Howard JC. Drivers of excess costs of opioid abuse among a commercially insured population. Am J Manag Care. 2017;23(5):276–282. [PubMed] [Google Scholar]
- 22.Howard J, Kirson N, Scarpati L, Dincer A, Hanway J, Zichlin M, et al. The economic burden of opioid abuse and its drivers: evidence from a payer perspective. Postgrad Med. 2016;128(S2):42. [Google Scholar]
- 23.Howard J, Kirson N, Scarpati L, Dincer A, Hanway J, Zichlin M, et al. The costs and cost drivers of opioid misuse by diagnosis: abuse, dependence, and overdose/poisoning. Postgrad Med. 2016;128(S2):41. [Google Scholar]
- 24.Pasquale MK, Joshi AV, Dufour R, Schaaf D, Mardekian J, Andrews GA, et al. Cost drivers of prescription opioid abuse in commercial and Medicare populations. Pain Pract Off J World Inst Pain. 2013;14(3):E116–E125. doi: 10.1111/papr.12147. [DOI] [PubMed] [Google Scholar]
- 25.Scarpati LM, Kirson NY, Jia ZB, Wen J, Howard J. Opioid abuse: A detailed examination of cost drivers over a 24-month follow-up period. J Manag Care Spec Pharm. 2017;23(11):1110–1115. doi: 10.18553/jmcp.2017.17019. [DOI] [PMC free article] [PubMed] [Google Scholar]
- 26.Howard J, Kirson N, Shei A, Cummings A, Birnbaum H. Drivers of excess costs associated with opioid abuse among commercially insured patients. J Manag Care Spec Pharm. 2016;22(4 Suppl):S58–S59. [Google Scholar]
- 27.Florence CS, Zhou C, Luo F, Xu L. The economic burden of prescription opioid overdose, abuse, and dependence in the United States, 2013. Med Care. 2016;54(10):901–906. doi: 10.1097/MLR.0000000000000625. [DOI] [PMC free article] [PubMed] [Google Scholar]
- 28.Shei A, Rice JB, Kirson NY, Bodnar K, Enloe CJ, Birnbaum HG, et al. Characteristics of high-cost patients diagnosed with opioid abuse. J Manag Care Spec Pharm. 2015;21(10):902–912. doi: 10.18553/jmcp.2015.21.10.902. [DOI] [PMC free article] [PubMed] [Google Scholar]
- 29.Asche CV, Clay E, Kharitonova E, Zah V, Ruby J, Aballea S. Budgetary impact of the utilization of buprenorphine/naloxone sublingual film and tablet for Medicaid in the United States. J Med Econ. 2015;18(8):600–611. doi: 10.3111/13696998.2015.1036760. [DOI] [PubMed] [Google Scholar]
- 30.Inocencio TJ, Carroll NV, Read EJ, Holdford DA. The economic burden of opioid-related poisoning in the United States. Pain Med. 2013;14(10):1534–1547. doi: 10.1111/pme.12183. [DOI] [PubMed] [Google Scholar]
- 31.Descoteaux A, Borrelli E, Kogut S. A budget impact analysis of abuse deterrent opioid formulation. Value Health. 2017;20(5):A1–A383. doi: 10.1016/j.jval.2017.05.005. [DOI] [Google Scholar]
- 32.Carter J, Frost M, Sanjurjo V. Determining the economic impact of medication nonadherence in persons treated with depot-injectable or sublingual buprenorphine for opioid use disorder. J Manag Care Spec Pharm. 2017;23(10-a Suppl):S1–S92. doi: 10.18553/jmcp.2017.23.10-a.s1. [DOI] [Google Scholar]
- 33.Geitona M, Carayanni V, Petratos P. Economic evaluation of opioid substitution treatment in Greece. Heroin Addict Relat Clin Probl. 2012;14(3):77–88. [Google Scholar]
- 34.Johnston SS, Alexander AH, Masters ET, Mardekian J, Semel D, Malangone-Monaco E, et al. Costs and work loss burden of diagnosed opioid abuse among employees on workers compensation or short-term disability. J Occup Environ Med. 2016;58(11):1087–1097. doi: 10.1097/JOM.0000000000000865. [DOI] [PubMed] [Google Scholar]
- 35.Cochran BN, Flentje A, Heck NC, Van Den Bos J, Perlman D, Torres J, et al. Factors predicting development of opioid use disorders among individuals who receive an initial opioid prescription: mathematical modeling using a database of commercially-insured individuals. Drug Alcohol Depend. 2014;138:202–208. doi: 10.1016/j.drugalcdep.2014.02.701. [DOI] [PMC free article] [PubMed] [Google Scholar]
- 36.Calcaterra SL, Keniston A, Blum J, Crume T, Binswanger IA. The association between stimulant, opioid, and multiple drug use on behavioral health care utilization in a safety-net health system. Subst Abuse. 2015;36(4):407–412. doi: 10.1080/08897077.2014.996697. [DOI] [PMC free article] [PubMed] [Google Scholar]
- 37.Roland CL, Joshi AV, Mardekian J, Walden SC, Harnett J. Prevalence and cost of diagnosed opioid abuse in a privately insured population in the United States. J Opioid Manag. 2013;9(3):161–175. doi: 10.5055/jom.2013.0158. [DOI] [PubMed] [Google Scholar]
- 38.Baser O, Xie L, Mardekian J, Schaaf D, Wang L, Joshi AV. Prevalence of diagnosed opioid abuse and its economic burden in the veterans health administration. Pain Pract Off J World Inst Pain. 2014;14(5):437–445. doi: 10.1111/papr.12097. [DOI] [PubMed] [Google Scholar]
- 39.Patel AM, Wheeler DC, Rose SR, Nadpara PA, Pakyz AL, Carroll NV. Economic burden associated with pediatric opioid poisonings. Value Health. 2017;20(5):A1–A383. doi: 10.1016/j.jval.2017.05.005. [DOI] [Google Scholar]
- 40.Brady B, Tkacz J, Nadipelli V, Volpicelli J, Ronquest N, Un H, et al. Relapse in opioid use disorder: implications for health care utilization and costs. Value Health. 2016;19(3):A188. doi: 10.1016/j.jval.2016.03.1375. [DOI] [Google Scholar]
- 41.Tkacz J, Volpicelli J, Un H, Ruetsch C. Relationship between buprenorphine adherence and health service utilization and costs among opioid dependent patients. J Subst Abuse Treat. 2014;46(4):456–462. doi: 10.1016/j.jsat.2013.10.014. [DOI] [PubMed] [Google Scholar]
- 42.Tkacz J, Brady B, Nadipelli V, Volpicelli J, Ronquest N, Un H, et al. The association between buprenorphine medication-assisted treatment adherence and health care service utilization and costs. Value Health. 2016;19(3):A187. doi: 10.1016/j.jval.2016.03.1371. [DOI] [Google Scholar]
- 43.Clay E, Khemiri A, Zah V, Aballea S, Ruby J, Asche CV. Persistence and healthcare utilization associated with the use of buprenorphine/naloxone film and tablet formulation therapy in adults with opioid dependence. J Med Econ. 2014;17(9):626–636. doi: 10.3111/13696998.2014.925463. [DOI] [PubMed] [Google Scholar]
- 44.Khemiri A, Kharitonova E, Zah V, Ruby J, Toumi M. Analysis of buprenorphine/naloxone dosing impact on treatment duration, resource use and costs in the treatment of opioid-dependent adults: a retrospective study of US public and private health care claims. Postgrad Med. 2014;126(5):113–120. doi: 10.3810/pgm.2014.09.2805. [DOI] [PubMed] [Google Scholar]
- 45.Shah A, Atreja N, Duncan M, Tai K, Gore M. Health care utilization and costs associated with pharmacological therapy versus non-pharmacologic therapy for opioid dependence. J Manag Care Spec Pharm. 2017;23(10-a Suppl):S42. [Google Scholar]
- 46.Shah A, Duncan M, Atreja N, Sun X, Tai K, Gore M. Health care utilization and costs associated with opioid dependence treatments. J Manag Care Spec Pharm. 2017;23(10-a Suppl):S42–S43. [Google Scholar]
- 47.Blanch B, Pearson SA, Haber PS. An overview of the patterns of prescription opioid use, costs and related harms in Australia. Br J Clin Pharmacol. 2014;78(5):1159–1166. doi: 10.1111/bcp.12446. [DOI] [PMC free article] [PubMed] [Google Scholar]
- 48.Weiss AJ, Elixhauser A, Barrett ML, Steiner CA, Bailey MK, O’Malley L. Opioid-related inpatient stays and emergency department visits by state, 2009–2014. Statistical brief #219. December 2016. Agency for healthcare research and quality. https://www.hcup-us.ahrq.gov/reports/statbriefs/sb219-Opioid-Hospital-Stays-ED-Visits-by-State.pdf. Accessed 23 Jan 2018.
- 49.Commonwealth of Massachusetts Health Policy Commission. Opioid use disorder in Massachusetts: an analysis of its impact on the health care system, availability of pharmacologic treatment, and recommendations for payment and care delivery reform. Massachusetts Heath Policy Commission; 2016.
- 50.Holly P, Kirson N, Shei A, Howard J, Cummings A, Birnbaum H. Understanding drivers of excess costs among continuous users of extended-release/long-acting opioids diagnosed with opioid abuse, dependence, or poisoning. J Manag Care Spec Pharm. 2016;22(4 Suppl):S59. [Google Scholar]
- 51.Masters ET, Mardekian J, Ramaprasan A, Saunders K, Gross DE, Palmer RE, et al. Natural language processing-identified problem opioid use and its associated health care costs. Value Health. 2016;19(3):A4. doi: 10.1016/j.jval.2016.03.018. [DOI] [PubMed] [Google Scholar]
- 52.Centers for Medicare and Medicaid Services (CMS). Centers for Medicare and Medicaid Services (CMS) opioid misuse strategy 2016. 2017. https://www.cms.gov/Outreach-and-Education/Outreach/Partnerships/Downloads/CMS-Opioid-Misuse-Strategy-2016.pdf. Accessed 14 June 2018.
- 53.Dufour R, Joshi AV, Pasquale MK, Schaaf D, Mardekian J, Andrews GA, et al. The prevalence of diagnosed opioid abuse in commercial and Medicare managed care populations. Pain Pract Of J World Inst Pain. 2014;14(3):E106–E115. doi: 10.1111/papr.12148. [DOI] [PubMed] [Google Scholar]
- 54.Edlund MJ, Sullivan M, Steffick D, Harris KM, Wells KB. Do users of regularly prescribed opioids have higher rates of substance use problems than nonusers? Pain Med. 2007;8(8):647–656. doi: 10.1111/j.1526-4637.2006.00200.x. [DOI] [PubMed] [Google Scholar]
- 55.Heslin KC, Elixhauser A, Steiner CA. Hospitalizations involving mental and substance use disorders among adults, 2012. HCUP Statistical Brief #191. Agency for Healthcare Research and Quality, Rockville, MD. 2015. https://www.hcup-us.ahrq.gov/reports/statbriefs/sb191-Hospitalization-Mental-Substance-Use-Disorders-2012.pdf. Accessed 14 June 2018. [PubMed]
- 56.The Council of Economic Advisers. The underestimated cost of the opioid crisis. 2017. https://www.whitehouse.gov/sites/whitehouse.gov/files/images/The%20Underestimated%20Cost%20of%20the%20Opioid%20Crisis.pdf. Accessed 14 June 2018.
- 57.Institute for Clinical and Economic Review (ICER). Final evidence report—Abuse-deterrent formulations of opioids: Effectiveness and value. 2017. https://icer-review.org/wp-content/uploads/2016/08/NECEPAC_ADF_Evidence_Report_062817.pdf. Accessed 14 June 2018.
- 58.Clark RE, Baxter JD, Aweh G, O’Connell E, Fisher WH, Barton BA. Risk factors for relapse and higher costs among Medicaid members with opioid dependence or abuse: opioid agonists, comorbidities, and treatment history. J Subst Abuse Treat. 2015;57:75–80. doi: 10.1016/j.jsat.2015.05.001. [DOI] [PMC free article] [PubMed] [Google Scholar]
- 59.United Nations Office on Drugs and Crime (UNODC). World drug report: global overview of drug demand and supply. 2017. https://www.unodc.org/wdr2017/field/Booklet_2_HEALTH.pdf. Accessed 19 Jan 2018.
- 60.Electricwala BS, Carroll NV, Nadpara P, Cannon E, Wander C. Prevalence, incremental cost and resource utilization associated with opioid overdose in the United States. Value Health. 2017;20(5):A371–A372. [Google Scholar]
- 61.Rossiter LF, Kirson NY, Shei A, White AG, Birnbaum HG, Ben-Joseph R, et al. Medical cost savings associated with an extended-release opioid with abuse-deterrent technology in the US. J Med Econ. 2014;17(4):279–287. doi: 10.3111/13696998.2014.897628. [DOI] [PubMed] [Google Scholar]
Associated Data
This section collects any data citations, data availability statements, or supplementary materials included in this article.
Supplementary Materials
Data Availability Statement
The authors declare that the data supporting the findings of this study are available within the article and its supplementary information files.