Abstract
Background:
Pediatric cardiac intensive care unit rounds require high levels of efficiency in data transfer and decision making to achieve optimal performance. Traditional survey methods do not discriminate and prioritize effectively the elements of rounds essential to a provider. In this study, we describe our experience with a novel survey method (Kano analysis) to assess customers’ (surgeons, intensivists, cardiologists, advanced practice nurses, and nurses) requirements from rounds.
Methods:
A 26-point survey divided into 3 domains (presentation, decision, and process elements) was conducted among Pediatric Intensive Care Unit (PICU) providers. Based on the survey, attractive, must be, performance, indifferent, and reverse categories were identified using methods described in the literature. Average satisfaction and dissatisfaction coefficients and percentages of attractive and mandatory elements in subgroups were compared. Results from the quantitative analysis were charted on a categorization plane.
Results:
The survey was returned by all providers with 96% valid responses. The highest satisfaction coefficient in the presentation domain was for “one line statement about the patient” (0.76), in the decision domain “rhythm/anti-arrhythmics” (0.54), and in the process domain “reformatting presentation script” (0.77). The highest dissatisfaction gradients were for “overnight events” (-0.91), “rhythm/anti-arrhythmics” (-0.71), and “asking families to join rounds” (-0.49). Among the 5 subgroups, surgeons required the largest percentage of items as mandatory or attractive and had the highest dissatisfaction coefficients in all 3 categories.
Conclusion:
Kano survey can provide rapid and precise actionable data to restructure a new process. Further research potentially also involving patients and families in the Kano survey may provide insight on patient-centered care models.
What is known about this subject?
Kano analysis on identifying customer requirements was first proposed by Dr. Noriaki Kano in 1984. Although popular in manufacturing industry, its utility in various health care processes has only recently been explored.
What this study adds?
This article describes utilization of this methodology to evaluate stakeholder’s requirements for daily morning intensive care unit rounds. Potential application in other systems discussed.
INTRODUCTION
Effective and efficient daily rounds in any inpatient hospital setting are essential for data transfer and critical decision making. Multiple studies have been conducted regarding optimization of intensive care unit (ICU) rounds both in adult1 and pediatric medicine.2–4 Pediatric cardiac surgical rounds add the additional complexities of time restriction [due to operating room (OR) schedule] and shared leadership (cardiac surgeon, intensivist, and cardiologist). In our mixed medical surgical pediatric ICU (PICU) with moderate surgical volume (150 cases/year), an internal staff satisfaction survey (n = 65) demonstrated overall poor satisfaction (measured as a subjective quality score on a scale of 1–100, where 100 is the best possible quality) with cardiac surgical rounds (60.6 ± 22.9), as compared with medical rounds (70.7 ± 19.0) and overall quality of care (79.7 ± 15.5). Restructuring and formatting of the rounding process was urgently needed. To identify requirements viewed as critical to the process (Critical to Quality) by the various stakeholders, we conducted a survey of different subgroups participating in rounds. The design team’s goals were to determine which features led to more satisfied customers and use this information to prioritize what we needed to build. Customers in this project refer to the internal customers of the rounds process (surgeons, intensivists, cardiologists, advanced practice nurses, and nurses). In a traditional survey, respondents can potentially choose all items as “very important.” With the time constraints of the rounding process, this methodology would not have allowed us to differentiate or prioritize the items. We decided to utilize Kano survey methodology to evaluate stakeholders’ opinions.
The Kano method was developed by Professor Noriaki Kano of Tokyo Rika University and colleagues in 1984.5 This method gained traction in the manufacturing and service industry and is an important tool in the development of the House of Quality model of Quality Function deployment.6 Kano’s model classifies a product or service feature as fitting into 1 of 4 categories depending on how customers react to the provided level of functionality. The 4 categories include (1) Performance (or 1-dimensional): With greater service, one sees greater customer satisfaction, (2) Must be: The service is expected by the customer. If it is present, it does not lead to an increase in satisfaction, but its absence causes intense dissatisfaction, (3) Attractive: These are unexpected features which when present cause a highly positive reaction. Also called exciters or delighters, (4) Indifferent: These are features whose presence or absence does not make a difference in customer’s reaction to a product or service (Fig. 1).7
Fig. 1.
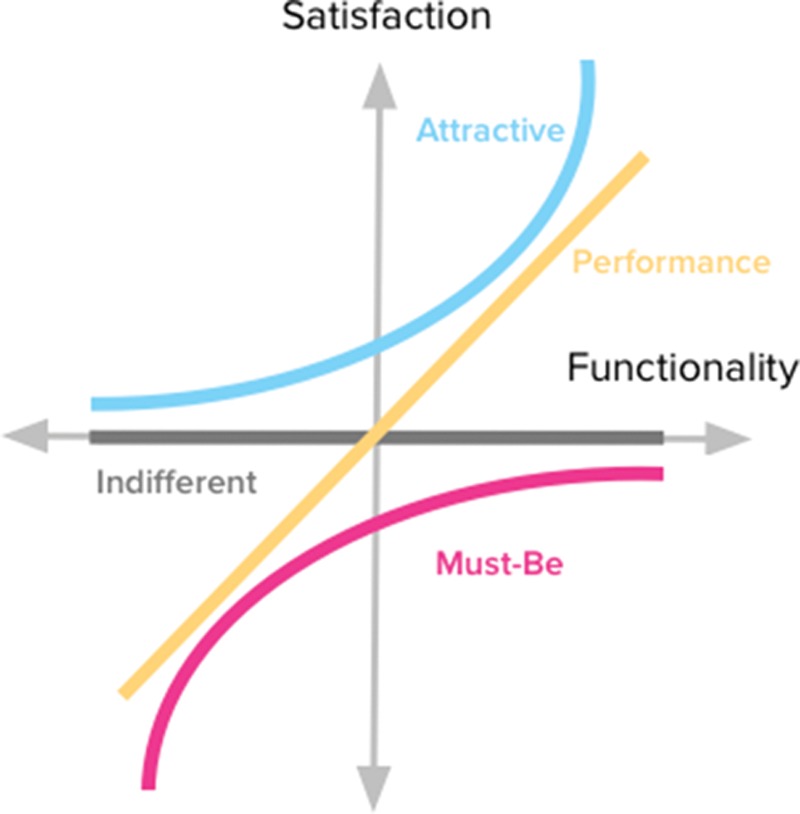
The Kano model for customers’ requirements (reproduced with permission7).
To identify customers’ requirements (above mentioned) from a product, a specific Kano questionnaire needs to be created. Each question in this questionnaire is asked in both positive and negative form. One question asks the customer how they feel if they have the feature (functional question), and the following question asks them how they feel if they did not have the feature (dysfunctional question). Responses from the questionnaire can be assigned numerical values for quantitative analysis or evaluated on an evaluation matrix (Fig. 2). After classifying each feature into different Kano categories, a new process or product is designed by adding all must be features and then adding as many performance features as possible and possibly adding a few attractive features.
Fig. 2.
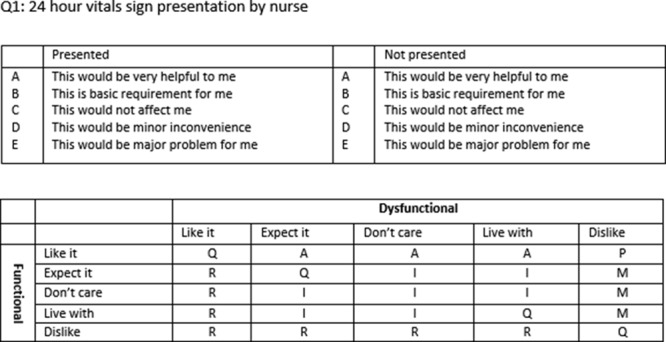
Example of a Kano question and analysis instrument.
Kano’s model has been previously used in the manufacturing industry8 and more recently in health care.9–11 This article describes our experience with design and implementation of a Kano survey and analysis to identify “customer” requirements from the rounding process.
METHODS
To identify broad themes of stakeholders’ requirements, 4 separate focus group sessions were conducted. A specific 26-point Kano questionnaire was then developed by a panel of experts based on the analysis of the focus group and the cardiac surgery rounds improvement team’s consensus. The survey was divided into presentation, decision, and process elements. We utilized the adaptation of the Kano options of Blauth et al.12 Questions have the following scale of options (as answers) in this method: “This would be very helpful to me,” “This is a basic requirement for me,” “This would not affect me,” “This would be a minor inconvenience,” and “This would be a major problem.” This questionnaire was pretested using cognitive interviews with 3 potential participants for length, flow, salience, ease of administration and response, and acceptability to respondents. Survey questions were adapted based on the feedback. Respondents (all intensivists rounding on cardiac surgery patients, all cardiologists, all APNs, all surgeons, and 8 nurses chosen at random from the pool that cares for the cardiac surgery patients) were then asked to complete the survey after a brief introduction on the nature and design of the questions. Complete Kano questionnaires were returned by all participants (n = 28). Although electronic versions of this tool are available online,13 for this project we utilized a paper version for ease of administration and analysis.
Responses from the Kano questionnaires were then analyzed both qualitatively (discrete variable) and quantitatively (continuous variable). For qualitative analysis, a separate Kano analysis matrix based on Pouliot’s revised table14 was created for all questions. This matrix allowed us to identify contradictory and reverse response pairs. A contradictory response pair occurs when a respondent selects the same choices for positive and negative questions. This implies that the survey participant did not comprehend the question or the responses. These answers were excluded from the analysis. A reverse response pair occurs when responses were either “liked not having a feature” or “disliked having it,” implying the survey participant did not want or require this process feature. Responses were then categorized as questionable, performance, mandatory, attractive, indifferent, or reverse. These responses were then tallied for all respondents in subgroups (nurses, APNs, intensivists, cardiologists, and cardiac surgeons). To assign equal weightage to each group, cumulative values of nursing responses were divided by 1.3 (6/8) and cardiac surgeons values multiplied by 3. Final values across all subgroups were again tallied to obtain cumulative scores for all survey questions. Each item was then assigned a category based on the most frequent value (mode) in the columns. For close and equal values, the prioritization scheme of must be > performance > attractive > indifferent was utilized. Process features categorized as reverse were not included in the design of the new model. Satisfaction and dissatisfaction coefficients based on the formula described by Timko15 were then calculated.
Satisfaction coefficient = (Attractive + Performance)/(Attractive + Performance + Mandatory + Indifferent).
Dissatisfaction coefficient = (Performance + Mandatory)/(Attractive + Performance + Mandatory + Indifferent).
A satisfaction coefficient indicates how much a customer’s satisfaction is increased by providing a feature, and the dissatisfaction coefficient indicates how much a customer’s satisfaction is decreased by not providing the feature. To compare the preferences among the different subgroups, the percentage of mandatory and attractive selections among all responses were calculated and compared for different categories. Mandatory and attractive choices were chosen as they are most likely to impact dissatisfaction or satisfaction among customers. Average satisfaction and dissatisfaction coefficients across all elements in the subgroups were also calculated and compared.
The quantitative analysis as described by Dumonchel16 was conducted. In this analysis, all positive responses were translated into a numerical score on a satisfaction potential scale as +4 (like), +2 (must be), 0 (neutral), -1 (live with), and -2 (dislike), and negative questions scored as -2 (like), -1 (must be), 0 (neutral), 2 (live with), and 4 (dislike). The larger the number, the more an answer determines how much the customer wants the feature. Numerical values are asymmetrical as the answers on the negative end (reverse and questionable) are weaker than those on the positive end (must be and performance). Adjustments in values, as previously described for qualitative analysis, were done. Mean and SDs of all questions from all respondents were then calculated. To categorize them into Kano categories, these values were then plotted on a categorization plane with dysfunctional values on the x axis and functional values on the y axis. Standard descriptive statistics were done and presented as mean (± SD). All analysis was done on JMP® (SAS institute, N.C.). As part of the quality improvement program of cardiac surgery rounds, this project was reviewed and considered a quality improvement work by the University of Illinois College of Medicine at Peoria, Institutional Review Board.
RESULTS
Surveys were returned by 28 providers (8 nurses, 6 intensivists, 7 cardiologists, 2 surgeons, and 5 APNs). Validity of the responses, as judged by the number of questionable responses, was best for the decision category with 100% analyzable responses from APNs, intensivists, cardiologists, and surgeons and 6.25% “questionable” responses from nursing. In presentation category, 15.6 % of APNs and 4.6% of nursing responses were questionable, whereas the rest of the subgroups had 100% logical responses. Process questions were most difficult to comprehend with all subgroups having questionable responses (nurses, 8.7%; surgeons, 7.1%; intensivists, 4.7%; cardiologists, 4.4%; and APNs, 4.2%). Overall, across all categories, the percentage of questionable responses was 4.1% (data not shown).
Of the 16 presentation characteristics in the survey, 8 categories were identified as mandatory [24-hour vital signs, labs [complete blood count, chemistry, blood gas, cultures], fluid balance, and medications (inotropes and anti-arrhythmics, diuretics), 3 as performance [overnight events, chest x-ray (CXR), medications: sedation], 1 as attractive (1 line statement about the patient), and 4 as indifferent (daily weight, ventilator settings, nutrition, medications: antibiotics). Categories with the highest satisfaction coefficients were 1 line statement about the patient (0.76), overnight events (0.55), and CXR (0.62). Categories with highest dissatisfaction coefficients were overnight events (-0.94), fluid balance (-0.77), and CXR (-0.75). An example of interpretation of the satisfaction coefficients would be that if the CXR was displayed, it would lead to an increase in satisfaction by a coefficient of 0.62. However, if the CXR was not displayed, it would lead to a decrease in satisfaction by a coefficient of 0.75 (Table 1). Quantitative analysis showed daily weight in the attractive quadrant. The rest of the elements were in the performance quadrant (Fig. 3).
Table 1.
Binary Analysis and Coefficients for Presentation Elements
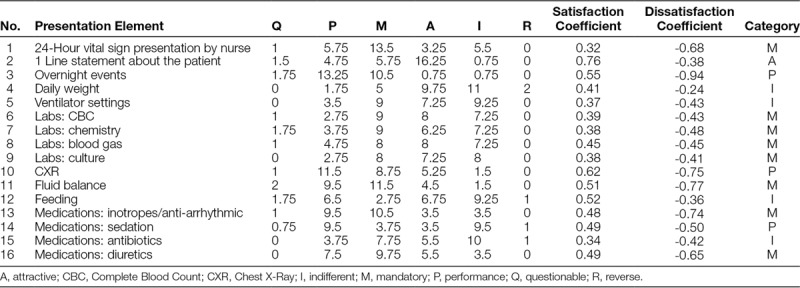
Fig. 3.
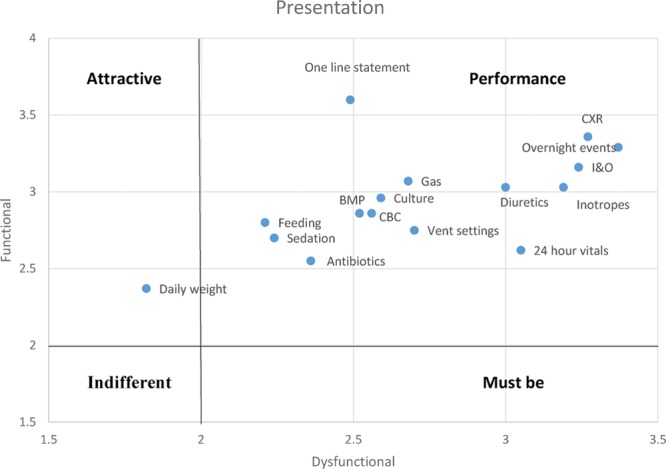
Presentation categorization plane. BMP, Basic Metabolic Panel; CBC, Complete Blood Count; CXR, Chest X-Ray; I&O, Input and output.
Among 8 decision elements, 2 were identified as mandatory (diuretics and chest tubes/drains/wires). Two performance elements were also assigned (inotropes and rhythm/anti-arrhythmics). No decision element was categorized as attractive. Rhythm/anti-arrhythmics had the highest satisfaction coefficient (0.54) and also the highest dissatisfaction coefficient (-0.71; Table 2). Quantitative analysis ranked the majority of elements in the performance category with social/discharge planning in the attractive quadrant and sedation and laboratory schedule in the indifferent quadrant (Fig. 4).
Table 2.
Binary Analysis and Coefficients for Decision Elements

Fig. 4.
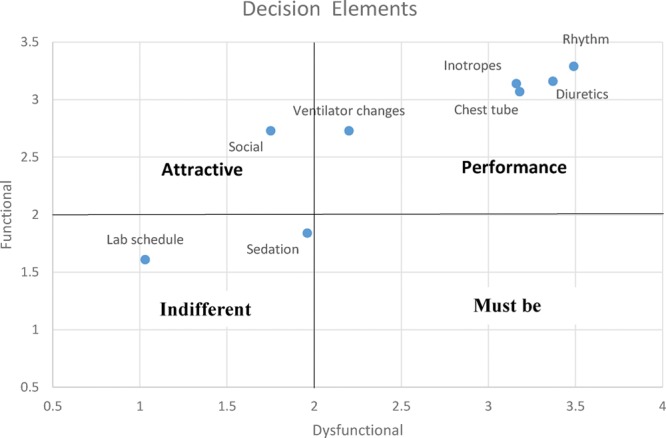
Decision categorization plane.
Elements in the process category were the possible changes in the process of rounds. Reformatting the nursing presentation script, intensivist-led rounds, checklist, pharmacy and care management joining rounds, and 1 cardiac surgeon participating in rounds (allowing rounds to continue while the other surgeon starts in the OR) were identified as attractive. Three suggested interventions were identified as reverse: 6:30 AM round start time, examine patients before rounds, and examine all patients during rounds. Process changes with the highest satisfaction coefficients were reformatting nursing presentation script (0.77) and pharmacy joining rounds (0.75). Process changes had low overall dissatisfaction coefficients. The 2 process changes with the highest dissatisfaction coefficients were pharmacy joining rounds (-0.49) and asking families to join rounds (-0.49; Table 3). Quantitative analysis showed equal number of process changes in the attractive and indifferent quadrants with only pharmacy joining rounds in the performance quadrant (Fig. 5).
Table 3.
Binary analysis and coefficients for process elements
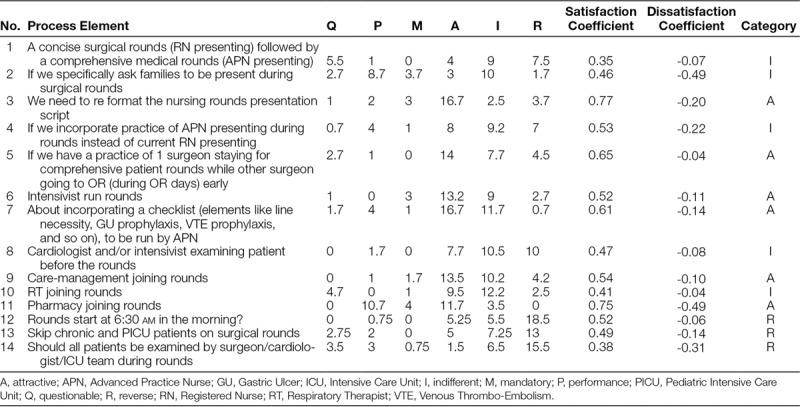
Fig. 5.
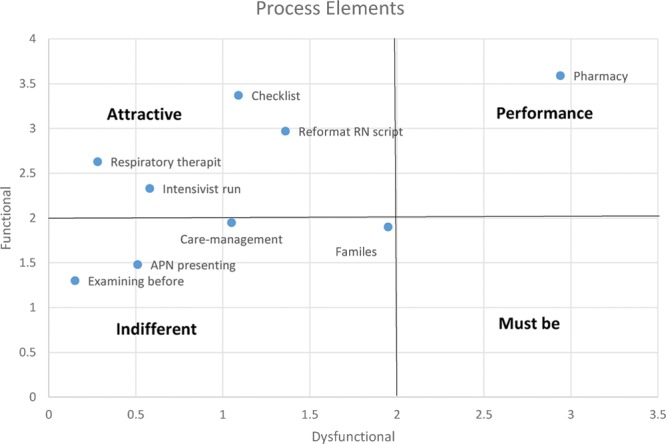
Process categorization plane.
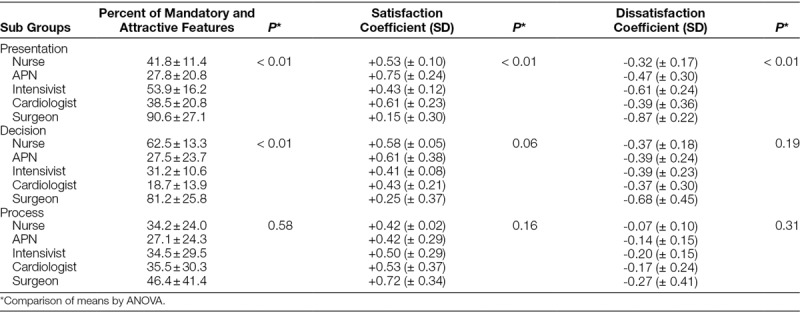
The percentages of mandatory and attractive elements identified by the subgroups in the 3 categories were calculated and compared. Overall, cardiac surgeons required the largest percentage of items as mandatory or attractive (90.6 ± 27.1 in presentation, 81.2 ± 25.8 in decision, and 46.4 ± 41.4 in process). APNs had the fewest requirements in presentation (27.8 ± 20.8) and process (27.1 ± 24.3), whereas cardiologists had the fewest in decision (18.7 ± 13.9). The difference among the 5 groups was statistically significant for presentation and decision. The average satisfaction coefficient across all variables was highest for APNs in presentation (+ 0.75 ± 0.24) and decision (+ 0.61 ± 0.38), whereas cardiac surgeons had the highest satisfaction coefficient for process (+ 0.72 ± 0.34). The dissatisfaction coefficients which most closely aligned with the percentage of mandatory elements were highest for the cardiac surgeons for all 3 categories (-0.87 ± 0.22 for presentation, -0.68 ± 0.45 for decision, and -0.27 ± 0.41 for process). The difference within the 3 groups among the coefficients was only significant for presentation (Table 4).
Table 4.
Comparison of the 5 Subgroups Requirements for Mandatory and Attractive Features and Cumulative Coefficients
DISCUSSION
Based on Kano analysis, we were able to identify and categorize various aspects of the rounding process into attractive, mandatory, performance, indifferent, and reverse categories. With qualitative and quantitative analysis, we were also able to provide hierarchal ranking of each variable. Results of this analysis were utilized to construct a House of Quality matrix to design cardiac surgery rounds in our pediatric ICU. The survey was well received and based on the low number of “questionable” responses, was comprehended well by the respondents, all of whom were exposed to this process for the first time. Kano’s method of sorting the characteristics of a process into various quality categories based on a survey completed by customers permits a straightforward approach to gain knowledge of the customers’ requirements.
Although multiple surveys have been published in the past regarding staff perception and requirements from rounds, ours is the first attempt to utilize Kano survey and analysis for this assessment. The presentation and decision categories identified in Kano analysis allowed us to prioritize, while designing the new process. For example, we know that if “overnight events” are not presented, it would lead to a decrease in satisfaction by a coefficient of 0.94, whereas missing “daily weight” would only lead to a decrease in satisfaction by 0.24. Similarly, making decisions on rhythm/anti-arrhythmic is important to staff, while missing it would lead to a dissatisfaction coefficient of 0.71, and the laboratory schedule can probably be decided afterward. As expected, there was wide variation regarding importance of various elements among the subgroups and even within subgroups (data not provided). This process allowed numerical data to be presented to the group which is valuable for change management. With multiple options identified from prior methods (focus groups, team meetings, and so on), it was necessary to identify which change would be acceptable to the majority. Characterization of some proposed changes as reverse helped to drop these from the menu of change. Since these are the changes personnel have not yet seen, it was not surprising to find low dissatisfaction coefficients for the process changes.
Although our study was not designed to compare the preferences among the different groups, we found significant differences in expectations from presentation among the providers. Surgeons, as opposed to common perception, required most of the information as “must be” or “attractive,” whereas APNs had the fewest requirements from rounds. This may be due to the fact that APNs are in the unit throughout the day and have other “opportunities” to collect that information, whereas surgeons are in the OR all day and primarily utilize rounds to assess the patients’ progress. Similarly, surgeons prefer decisions be made during rounds as compared with providers who traditionally spend most of their time in the unit. Not presenting critical information and not making critical decisions led to more dissatisfaction among surgeons and least to nursing. There was greater similarity within the process variables among the groups, although surgical preferences again were strongest. This difference was not significant.
Most of the reports on Kano analyses in health care have focused on patient satisfaction and requirements. Hejaili et al.9 did a cross-sectional, 20-point survey in 10 dialysis centers in 4 countries (total n = 830). Kano questions were based on physical factors (room, facilities) and reliability, inspiration, empathy, and helpfulness of the staff. They observed higher satisfaction coefficients and “1-dimensional” responses from Arab patients and higher dissatisfaction coefficients and “must-be” and “attractive” responses from Austrian patients. In our study, we also observed significant differences among the 5 groups. With heterogeneity of roles, time commitments, and training biases, this was not unexpected. Because all providers are equal partners in patient care, it is good to know other groups’ preferences as a new process is designed.
In our study, qualitative and quantitative analysis did not result in similar categorization of elements of rounds. Although based on the same principles, they utilize slightly different mathematical and conceptual methods. Quantitative analysis is considered superior as there is significant data loss with qualitative analysis.16 Quantitative analysis in our dataset was affected by very large variation due to discrepant categories. In designing our Critical to Quality rounding practice, we utilized the results of the qualitative analysis only. We described both methods here to elucidate the principles. Researchers can opt to choose whichever method works for their particular project and population.
Disadvantages of the Kano questionnaire are its length and requirement of time and commitment on the part of the respondents. More recently, investigators from Mayo Clinic11 utilized a novel strategy of using only 1 question per respondent (of 4 possible) regarding the effects of 4 proposed interventions on patient perception. They had an 88% response rate for this survey (158 of 180). With a limited survey population in the PICU, this strategy would not have given us enough information, although it can be utilized as we design the Kano survey for patient expectations from rounds.
CONCLUSION AND LIMITATIONS
The Kano survey is a powerful tool not only to assess patients’ satisfaction and requirements but also to assess staff requirements and to evaluate the response for any process change. We believe that our article would generate more awareness regarding this tool among medical researchers. As with any customer requirement assessment method, conflicting opinions and needs require judgment calls, repeat measurements, experiments, and iterations as necessary. Results from our analysis regarding presentation and decision elements can be directly applicable to other similar institutions. However, process variables are very unit specific, based on local practices and cultures, and each institution would have to conduct their own Kano analysis to identify what may or may not work for them. Due to complexity and length of our questionnaire, we did not utilize patients’ and families’ preferences. In any family-centered model of care, the voice of patient and family is equally, if not more important, in design and lack of families’ opinions is a limitation of our study. Suitably worded Kano surveys need to be conducted among families of ICU patients to make the rounds patient centered.
DISCLOSURE
The authors have no financial interest to declare in relation to the content of this article.
REFERENCES
- 1.Dodek PM, Raboud J. Explicit approach to rounds in an ICU improves communication and satisfaction of providers. Intensive Care Med. 2003;29:1584–1588.. [DOI] [PubMed] [Google Scholar]
- 2.Justice LB, Cooper DS, Henderson C, et al. Improving communication during cardiac ICU multidisciplinary rounds through visual display of patient daily goals. Pediatr Crit Care Med. 2016;17:677–683.. [DOI] [PubMed] [Google Scholar]
- 3.Tripathi S, Arteaga G, Rohlik G, et al. Implementation of patient-centered bedside rounds in the pediatric intensive care unit. J Nurs Care Qual. 2015;30:160–166.. [DOI] [PubMed] [Google Scholar]
- 4.Lane D, Ferri M, Lemaire J, et al. A systematic review of evidence-informed practices for patient care rounds in the ICU*. Crit Care Med. 2013;41:2015–2029.. [DOI] [PubMed] [Google Scholar]
- 5.Kano N, Seraku N, Takahashi F, Tsuji S. Attractive quality and must-be quality. J Jpn Soc Qual Control. 1984;41:39–48.. [Google Scholar]
- 6.Cohen L. Quality Function Deployment: How to Make QFD Work for You. 1995Reading, MA: Addison-Wesley Publishing Company. [Google Scholar]
- 7.Zacarias D. The complete guide to the Kano Model. Available at Foldingburritos.com/Kano-model. Accessed August 19, 2016.
- 8.Chen TY, Su CT. A Kano CKM model for customer knowledge discovery. Total Qual Manag Bus Excell. 2006;17:589–608.. [Google Scholar]
- 9.Hejaili FF, Assad L, Shaheen FA, et al. Culture-related service expectations: a comparative study using the Kano model. Qual Manag Health Care. 2009;18:48–58.. [DOI] [PubMed] [Google Scholar]
- 10.Cordero-Ampuero J, Darder A, Santillana J, et al. Evaluation of patients’ and physicians’ expectations and attributes of osteoarthritis treatment using Kano methodology. Qual Life Res. 2012;21:1391–1404.. [DOI] [PubMed] [Google Scholar]
- 11.Bellamkonda VR, Kumar R, Scanlan-Hanson LN, et al. Pilot study of Kano “Attractive Quality” techniques to identify change in emergency department patient experience. Ann Emerg Med. 2016;68:553–561.. [DOI] [PubMed] [Google Scholar]
- 12.Blauth R, Richter R, Rubinoff A. Experience in the use of Kano’s methods in the specification of BBN RS/1 Release 5.0. In, Kano methods for understanding customer-defined quality. Center for Quality of Management Journal. 1993;2:12–15.. Available at http://walden-family.com/public/cqm-journal/2-4-Whole-Issue.pdf. Accessed May 1, 2017. [Google Scholar]
- 13.Dmitriev S. What is Kano analysis. Kano analysis website. Available at http://www.kanosurvey.com/. Accessed August 19, 2016.
- 14.Pouliot F. Theoretical issues of Kano methods. In, Kano methods for understanding customer-defined quality. Center for Quality of Management Journal. 1993;2:28–35.. Available at http://walden-family.com/public/cqm-journal/2-4-Whole-Issue.pdf. Accessed May 1, 2017. [Google Scholar]
- 15.Timko M. An experiment in continuous analysis. In, Kano methods for understanding customer-defined quality. Center for Quality of Management Journal. 1993;2:17–19.. Available at http://walden-family.com/public/cqm-journal/2-4-Whole-Issue.pdf. Accessed May 1, 2017. [Google Scholar]
- 16.Dumonchel W. Thoughts on graphical and continuous analysis. In, Kano methods for understanding customer defined quality. Center for Quality of Management Journal. 1993;2:20–22.. Available at http://walden-family.com/public/cqm-journal/2-4-Whole-Issue.pdf. Accessed May 1, 2017. [Google Scholar]


