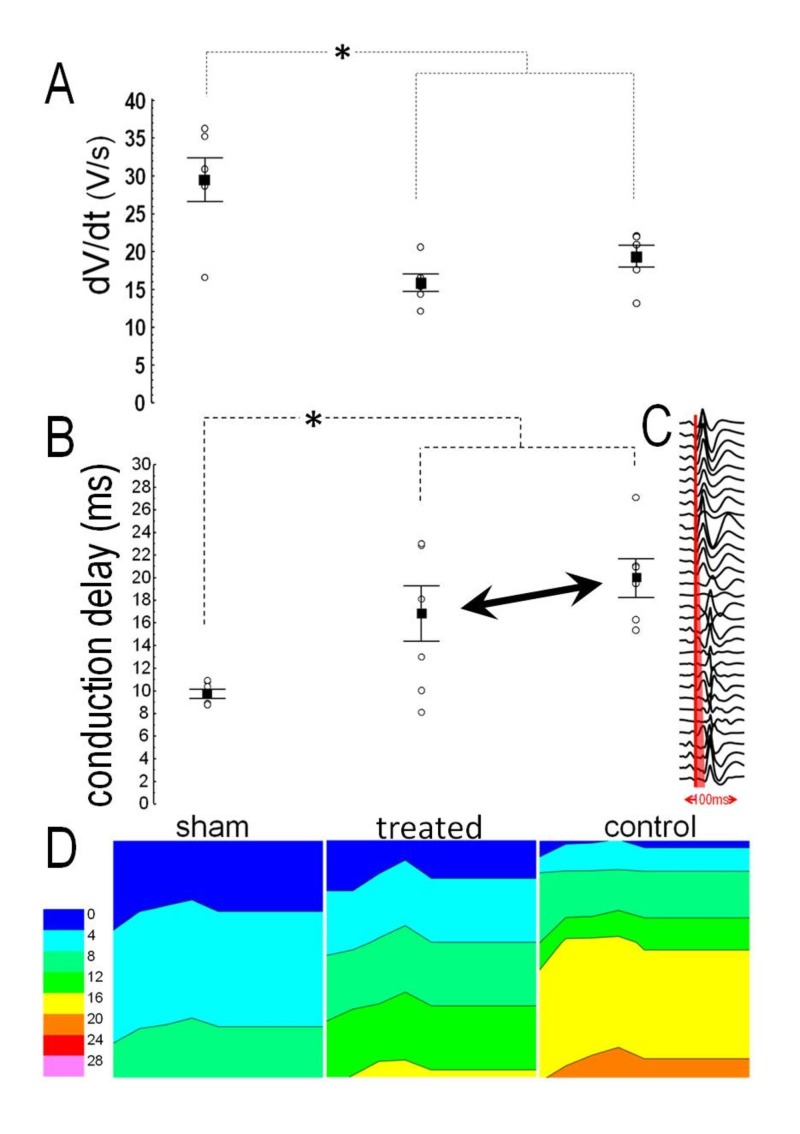
Figure 4. Local conduction.
(A): Voltage rise from monophasic action potentials was comparable in treated rats and controls, and lower than after sham-operation. (B): Conduction delay was comparable in treated rats and controls, and longer than after sham operation. (C): Examples of isochronal propagation maps. Asterisk denotes significant difference

